HAL Id: in2p3-00024152
http://hal.in2p3.fr/in2p3-00024152
Submitted on 5 Sep 2005
HAL is a multi-disciplinary open access
archive for the deposit and dissemination of
sci-entific research documents, whether they are
pub-lished or not. The documents may come from
teaching and research institutions in France or
abroad, or from public or private research centers.
L’archive ouverte pluridisciplinaire HAL, est
destinée au dépôt et à la diffusion de documents
scientifiques de niveau recherche, publiés ou non,
émanant des établissements d’enseignement et de
recherche français ou étrangers, des laboratoires
publics ou privés.
Francois de Oliveira Santos, P. Himpe, M. Lewitowicz, I. Stefan, N. Smirnova,
N.L. Achouri, J.C. Angélique, C. Angulo, L. Axelsson, D. Baiborodin, et al.
To cite this version:
Francois de Oliveira Santos, P. Himpe, M. Lewitowicz, I. Stefan, N. Smirnova, et al.. Study of
19Na
at SPIRAL. European Physical Journal A, EDP Sciences, 2005, 24, pp.237-247.
�10.1140/epja/i2004-10143-4�. �in2p3-00024152�
Study of
19
Na at SPIRAL
F. de Oliveira Santos1 , P. Himpe1,2, M. Lewitowicz1 , I. Stefan1,8, N. Smirnova2 , N.L. Achouri3 , J.C. Ang´elique3 , C. Angulo4 , L. Axelsson14 , D. Baiborodin6 , F. Becker1 , M. Bellegui5 , E. Berthoumieux7 , B. Blank12 , C. Borcea8 , A. Cassimi13, J.M. Daugas9,1, G. de France1, F. Dembinski1, C.E. Demonchy1, Z. Dlouhy6, P. Dol´egi´eviez1, C. Donzaud5, G. Georgiev1, L. Giot1, S. Gr´evy3, D. Guillemaud Mueller5, V. Lapoux7, E. Li´enard3, M.J. Lopez Jimenez1,9, K. Markenroth14, I. Matea1, W. Mittig1, F. Negoita8, G. Neyens2, N. Orr3, F. Pougheon5, P. Roussel Chomaz1 , M.G. Saint Laurent1 , F. Sarazin1,10, H. Savajols1 , M. Sawicka1,11, O. Sorlin5 , M. Stanoiu1 , C. Stodel1 , G. Thiamova6, D. Verney1, and A.C.C. Villari11 Grand Acc´el´erateur National d’Ions Lourds, B.P. 5027, F-14076 Caen Cedex, France
2 Instituut voor Kern- en Stralingsfysica, University of Leuven, Celestijnenlaan 200 D, B-3001 Leuven, Belgium 3 Laboratoire de Physique Corpusculaire, IN2P3-CNRS, ISMRA et Universit´e de Caen, F-14050 Caen, France 4 Centre de Recherches du Cyclotron, UCL, 2 chemin du cyclotron, B-1348 Louvain-la-Neuve, Belgium 5 Institut de Physique Nucl´eaire, IN2P3-CNRS, F-91406 Orsay, France
6 Nuclear Physics Institute ASCR, CZ-25068 Rez, Czech Republic 7 CEA Saclay, DSM/DAPNIA/SPHN, F-91191 Gif-sur-Yvette, France 8 Institute of Atomic Physics, P.O. Box MG6, Bucharest-Margurele, Romania 9 CEA/DIF/DPTA/PN, BP 12, 91680 Bruy`eres le Chˆatel, France
10 TRIUMF, 4004 Wesbrook Mall, Vancouver, British Columbia, V6T 2A3, Canada
11 Institute of Experimental Physics, University of Warsaw, PL-00-681 Warsaw, Hoza 69, Poland
12 Centre d’Etudes Nucl´eaires de Bordeaux-Gradignan, Le Haut-Vigneau, B.P. 120, F-33175 Gradignan Cedex, France 13 CIRIL, Rue Claude Bloch, BP 5133, F14070 Caen.
14 Experimentell fysik, Chalmers Tekniska H¨ogskola och G¨oteborgs Universitet, S-412 96 G¨oteborg, Sweden
Received: date / Revised version: date
Abstract. The excitation function for the elastic scattering reaction p(18
Ne,p)18
Ne was measured with the first radioactive beam from the SPIRAL facility at the GANIL laboratory and with a dedicated solid cryogenic hydrogen target. Several broad resonances have been observed, corresponding to new excited states in the unbound nucleus19
Na. In addition, two-proton emission events have been identified and are discussed.
PACS. PACS-key discribing text of that key – PACS-key discribing text of that key
1 Introduction
Sodium isotopes have been produced in a wide range of the neutron number, from the most neutron-rich isotope37Na (N = 26) identified for the first time in recent experiments performed at GANIL [1] with the new facility LISE 2000 and at RIKEN [2], to the most neutron-deficient isotope (N=7) lying two steps beyond the proton drip line 18Na [3].
Our knowledge about the19
Na isotope is very limited. The first observation of 19
Na was performed in 1969 by Cerny et al. [4] via the transfer reaction24Mg(p,6He)19Na. The differential cross section for this reaction was about 100 nb/sr in the laboratory frame and the resolution was about 200 keV. They observed one peak at the mass excess of 12.974 ± 0.070 MeV, a value quite close to the value E = 12.90 MeV predicted with the Isobaric Mass Multiplet Equation (IMME). This value of the mass implies this
nu-cleus is unbound against one proton emission. In another experiment, Benenson et al. [5] used the transfer reac-tion24Mg(3He,8Li)19Na to study this nucleus. Compared to the previous reaction the differential cross section was about 3 times higher and the energy resolution was about 40 keV. Two peaks were observed and attributed to the ground and first excited states. A more precise value for the mass of the ground state has been measured, which is only ER = 320 ± 12 keV above the proton emission threshold. The first excited state has been measured at Ex = 120 ± 10 keV above the ground state, but it was observed as a small peak in the tail of the ground-state peak. This result is consistent with the known properties of the other members of the T = 3/2 isobaric analog states multiplet [6], where the first excited state always lies very close to the ground state: in19O the energy difference is 96 keV, in19F it is 121 keV and in19Ne it is 85 keV. In an-other experiment performed at GANIL and based on the
invariant mass method, Zerguerras et al. [3] were able to measure the mass spectrum corresponding to19
Na. They could see only one peak, at the position of ER= 480 ± 50 keV. Regrettably, in all these published measurements the intensity for the feeding of the different states was never discussed. It is even very surprising that none of the other excited states was ever observed.
Recently, the second excited state was seen in a pre-cise resonant elastic scattering measurement performed by Angulo et al. [7]. In this case a18Ne beam impinged onto a thin (0.5 mg/cm2
) polyethylene target. The new state was observed at ER = 1066 ± 2 keV, with a width of Γ = 101 ± 3 keV and a spin of Jπ = 1
2 +
. This state corre-sponds undoubtedly to the known second excited state in the mirror nucleus 19O. It is 725 keV down shifted from its analog.
We report here the results of a new study. We have measured the resonant elastic scattering of a 18Ne beam onto a thick solid cryogenic hydrogen target. This experi-ment was the first experiexperi-ment performed with a radioac-tive beam from the SPIRAL facility at GANIL. In the following sections 2-5 we present the experimental condi-tions of this measurement. The analysis of the excitation function is presented in the sections 6-8. It is also pre-sented several calculations, using a potential model and the shell model, to compare with the measured properties and with the known states in the mirror nucleus 19O. In the final sections 9-10 two-proton events observed in the same experiment are analyzed and discussed.
2 Principle of the measurement
In order to investigate the structure of the19Na isotope, we have measured the excitation function of the elastic scattering reaction 18Ne(p,p)18Ne. The experimental ex-citation function for the elastic scattering at low energy can mainly be described by the Rutherford elastic scatter-ing formula, but it also shows up ”anomalies”, i.e. various kinds of resonances that are related to discrete states in the compound nucleus. The excitation energy of the states can be determined from the position of the resonances, the partial widths of the states from the width and intensity of the resonances, and the spin and parity of the states from the shape of the resonances and the angular distri-butions. This measurement is simple, it gives pertinent properties of the states, and the cross sections are often high, an essential condition when dealing with radioactive nuclei.
As18Ne is radioactive (T
1/2 = 1.672 s), we have mea-sured this elastic scattering in inverse kinematics: p (18Ne,p) 18
Ne. Consequently, the experiment benefits of two im-portant effects: a focusing effect that allow to increase the counting rate by a factor of about 4 for a forward angle detector, and an energy effect that improves the recon-structed resolution in the center of mass frame by a factor of close to 4 in comparison to the resolution measured in the laboratory frame.
It is very time consuming, specially using relatively low intensity radioactive beams, to change the energy of the
incoming beam by small steps to measure the full exci-tation function. To solve this problem we can use a thick target. The idea of using a thick target has been developed successfully in several experiments [8–10]. If the energy of the impinging particle (18Ne), at some point along its slowing down trajectory inside the target, corresponds to an excited state of the compound nucleus (19
Na = 18 Ne + p), the probability for elastic scattering changes signifi-cantly. The scattered proton can escape the target because of its smaller energy loss, and can be detected at forward angles in the laboratory frame after escaping the target. There is a direct correspondence between the energy of the detected proton and the center of mass energy of the scattering event. In our experiment the target was thick enough to stop the beam inside the target. Therefore, the thick target makes it possible to obtain a complete and continuous excitation function over a wide range of ener-gies, by simply detecting the scattered protons and mea-suring their energies, without changing the energy of the incident beam. As measured for example by Axelsson et al. [8] with a thick target, the final resolution can be better than 50 keV in the center of mass frame, generally good enough to study states with large widths. The disadvan-tages to use a thick target are discussed hereafter.
3 Experimental setting
The elastic scattering measurement has been performed at GANIL with a radioactive beam produced by the new SPIRAL (Syst`eme de Production d’Ions RAdioactifs en Ligne) facility [11,12]. The18
Ne beam has been produced through the projectile fragmentation of20
Ne primary beam at 95 A MeV on a carbon target, located at the new un-derground production cave of SPIRAL. For this first ex-periment, a maximum primary beam intensity of ∼ 0.20 pµA has been used, in order to limit the irradiation of the production ensemble. The radioactive atoms released from the carbon target - heated at 2000 K - were ionized by the compact and totally permanent magnet Nanogan-3 ECR ion source to the charge state 4+. The beam was ac-celerated by the new compact cyclotron CIME (Cyclotron d’Ions `a Moyenne Energie) up to an energy of 7.2 A MeV. The beam was contaminated by 15 % of 18O and a very small amount (< 1%) of18F. The efficiency of the overall production system can be disentangled in the following way: More than 90% of the produced atoms diffuse out of the target and arrive in the ECR ion source. About 15% of these atoms are extracted in the charge state 4+. The transmission of the low energy separator, corresponding to the first half of the injection line of CIME was of the order of 50%, while the transmission of the CIME acceler-ator including the beam pulsing and beam extraction was also 50%. The observed efficiencies were compatible with those expected. The present design of the Carbon target allows to increase of the primary beam intensity up to 1 pµA, which will correspond to 107 particles per second of 18Ne. It should be pointed out the excellent stability and reproducibility of the whole production and acceleration
system of SPIRAL. During the experiment one could eas-ily change the tuning of the cyclotron from18
O, used for calibrations, to18Ne in about 15 minutes. To get rid of the contamination we have used the LISE magnetic spectrom-eter as a separator. A thin carbon stripper foil (40 µg/cm2) was placed at the target position of the spectrometer to select the 10+ charge state of the beam, yielding a pure 18Ne10+ beam with a mean intensity of 2.5 105 pps. All along this experiment, the beam intensity was measured and monitored by using a multi channel plate detector placed in front of the target.
We have chosen to use a solid cryogenic hydrogen tar-get of 1 mm. We have used a pure hydrogen tartar-get for two reasons. First, the use of compound targets (e.g. (CH2)n) introduces other elements (e.g. Carbon) in which new re-actions can occur and may pollute the measurement. We have performed several tests with this kind of target and we have observed that the carbon contributes as a non negligible continuous background at our incident energy. Second, the use of a pure hydrogen target maximizes the counting rate because the highest stoechiometric ratio leads to the highest effective target thickness. The main require-ments imposed for the development of solid cryogenic tar-gets usable under vacuum are: low thickness, very thin windows, and uniform thickness and density. A special cryogenic system has been designed to make this target [13]. Cryogenic target systems have already been designed in various laboratories, particularly by directly condens-ing H2gas to make the target. In the system developed at GANIL, we have opted for a transition to the liquid phase (16.2 K - 230 mbar) before progressive solidification of the hydrogen (T < 13.9K ) [14]. Liquid helium has been used as a cold source at 4 K and the growth of the crystal has been imposed by the temperature gradient in the metal frame supporting the target. The target has been made using a metal frame to which mylar windows were glued. A stack of frames has formed an H2 target cell with an He cell on either side of the target. During the target pro-duction phase, equivalent pressure has been maintained on either side of the target windows. Once the target was formed, the helium gas was evacuated. The density of the target was probably not perfectly constant over its entire length (expected 0.8 % variations). We have used a 1 mm thick target and 6 µm mylar windows. The diameter of the entrance windows was 10 mm. The time required to produce the solid target, after placing the cryostat under vacuum, was about 3 hours and the system consumed ∼ 1 liter/h of liquid helium to maintain the solid target at low temperature (depending on the quality of vacuum). The target has been placed in the experiment vessel to intercept the beam during nearly a week (P ∼ 20 µW on the target) and during all the experiment the target temperature has stayed below 9K.
In our experiment the scattered protons escaped from the cryogenic target and were detected in a telescope of silicon detectors. The telescope was composed of 3 silicon detectors, 50 x 50 mm sized: a 150 µm ∆E detector, an 1 mm double-sided strip detector and a thick 3.5 mm Si(Li) detector. The large total thickness of the telescope has
been chosen in order to cover a large proton energy inter-val. The ∆E detector was placed 317 mm behind the tar-get in order to decrease the counting rate due to the β rays from the decay of the beam particles. The second silicon detector was placed just behind the first one. The angular acceptance was dΘ1
lab = ± 4.5◦ in the laboratory frame, corresponding to a solid angle of dΩ1
lab = 20 msr. Due to geometrical constraints the Si(Li) detector was placed farther away from this ensemble, 495 mm from the target, corresponding to a relatively narrower angular acceptance of dΘ2
lab = ± 3◦ and to a solid angle of dΩ 2
lab= 10 msr. Moreover, during a part of the experiment we have used an other configuration in which the second detector was removed.
4 Test and Calibration with p(
18O,p)
18O
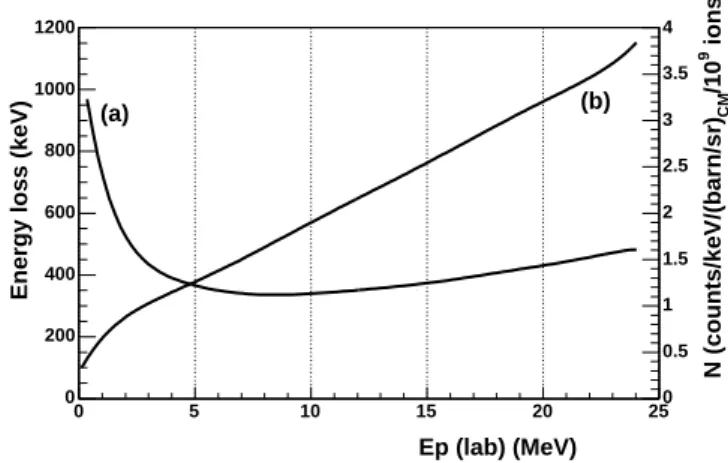
From the raw spectra, several corrections must be applied to obtain the excitation function. A first correction (figure 1-a) is applied for the energy loss of the protons inside the hydrogen target. Simulations have been performed with the energy losses calculated with the program SRIM [15]. We can observe that the energy loss changes very slowly (maximum difference of 150 keV) over the full range of the proton energies we are interested in (between 2.5 MeV and 25 MeV in the laboratory frame).
0 5 10 15 20 25 0 200 400 600 800 1000 1200 0 0.5 1 1.5 2 2.5 3 3.5 4
Energy loss (keV)
ions) 9 /10 CM N (counts/keV/(barn/sr) Ep (lab) (MeV) (a) (b)
Fig. 1. Results from one simulation of our experiment with an18
O incident beam. (a): Left axis. The energy loss (in keV) of the protons inside the hydrogen target is plotted versus the detected proton energy (in MeV) in the laboratory frame. (b): Right axis. The number of counts N (per (barns per steradian) in center of mass frame, per 109
incident ions, per keV in lab-oratory frame) is plotted as a function of the detected proton energy.
The second correction (figure 1-b) has to be applied for normalization. The effective target thickness at a certain energy depends on the energy loss of the incident ions at this energy. This effect explains why it is very important to use a pure hydrogen target. In that case, we obtain the
lowest energy loss and the highest proton density, which both increase the counting rate. Another part of the de-pendance is also coming from kinematical effects. We can observe that the counting rate (per (barns per steradian) in center of mass frame, per 109 incident ions, per keV in laboratory frame) increases with energy. We are more sensitive to higher energies, which compensates for the usually lower cross section at those energies.
The simulations have also shown that the energy reso-lution is a soft function of the center of mass energy. With a 18Ne beam, the energy straggling goes from σ
lab = 37 keV at the highest detected energies up to σlab= 41 keV at the detected energy of 2.5 MeV. Taking into account the detector resolution and the energy uncertainty coming from the angular acceptance of the detector, we calculated a total center of mass frame resolution of σcm = 25 keV, a value that underestimates the real one because of the experimental non uniformity of the target thickness.
We performed a measurement with a stable beam for several reasons: to determine the mean target thickness, to evaluate the thickness uniformity of the cryogenic tar-get, to test the analysis program. This measurement was accomplished with an 18O beam, produced at the same energy as 18Ne. The energy of the incident beam (7.2 A MeV) has been chosen to stop the18
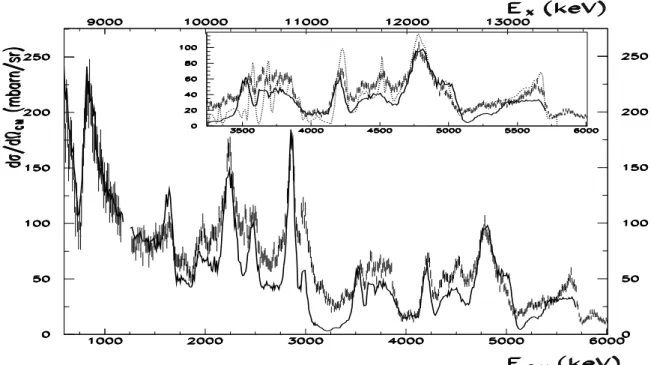
O beam at the down-stream edge of the target. The final result is shown in figure 2. This spectrum has been measured in 2.8 hours, with a mean beam intensity of 106 pps.
From our measurement we were able to perform two comparisons:
– A part of our measured excitation function was already measured in direct kinematic by Orihara et al. [16] in a very precise experiment (σlab∼ 2.5 keV). The related data are shown in the insert of figure 2 as a dotted line. The measured angle in this reference ΘCM = 168.7◦ is not equal to our mean value ΘCM = 180 ◦, but it is close enough to make that comparison interesting. The comparison shows a good agreement in energy and in normalization. Through the comparison, used as a calibration measurement, it was possible to determine precisely the mean target thickness ¯d = 1050 ± 20 µm (constant density of 88.5 mg/cm3
). Moreover, we found an energy resolution of σCM = 30 ± 10 keV, constant in this range of energy. This value is in good agree-ment with those obtained in similar experiagree-ments [8] using homogenous gas targets. Using this value of the energy resolution, we have determined a target thick-ness uniformity of σtarget= 70 µm, demonstrating the good quality of the cryogenic system used here. Fur-thermore, a small correction in normalization has led to the corrected value for the solid angle of dΩlab= 11 ± 1 msr (configuration using the Si(Li) detector). – The properties of the 19F (18O + p) states lying at
excitation energies 8 ≤ Ex ≤ 15 MeV are quite well-known. We have compared our measurement with a R-matrix calculation performed using 37 known states (from [16,6]) of 19F. These states corresponds to all known states in the measured energy range. The R-matrix calculation has been performed with the code
Anarki [17]. Figure 2 shows the result of this calcula-tion as a continuous curve, performed at the angle of ΘCM = 180◦ and using the same energy resolution as the experimental one. Again we can observe an overall excellent agreement, in normalization and in energy. Moreover, no extra peak is visible in the spectrum. However, the agreement between the calculation and our measurement is not perfect, we can observe differ-ences, mainly in normalization. We have observed neg-ligible differences in the calculations when angles are chosen within the angular acceptance of the detectors. In fact, the differences are mainly due to the uncer-tainties in the known properties of the excited states in19F. For example, we don’t know precisely the width for all excited states in that nucleus. The low energy part of the spectrum was calibrated in energy using the results of the R-matrix calculation. In figure 2, at ECM gap ≈ 1.1 MeV there is an energy-gap of ≈ 200 keV with no data. This gap results from dead layers between the first ∆E detector and the next one, and selection conditions. The protons with energies higher than this energy gap are identified and selected using a standard contour in a ∆E-E plot. The lower energy part of the spectrum is produced by a different technique. Firstly, we have applied a time of flight selection to identify the protons. Secondly, to select the particles stopped in the first detector we applied a low energy threshold on the second detector.
In conclusion, this calibration measurement allowed us to extract different parameters of our experimental setting (calibration, target thickness, resolution etc.), and the val-ues for those parameters were very close to those expected.
5 Measurement of p(
18Ne,p)
18Ne
In the case of the radioactive18Ne beam, the same anal-ysis of the data as described in the previous paragraph has been applied to produce the 19
Na spectrum of figure 3. It represents a 38 hour measurement. For the analy-sis we have used exactly the measured values of the ex-perimental parameters deduced from the 18O calibration measurement. The unique difference is in the energy reso-lution. Indeed, since18
Ne does not stop at the same posi-tion (430 µm from the target edge instead of 70 µm), the energy resolution in the center of mass frame is calculated to be 2 keV worse for 18Ne than for18O.
From a comparison with figure 2, we can clearly ob-serve similarities, several resonances are present, but with also some differences, in particular there are much less resonances observed (labelled from A to F), and they all have large widths. Indeed, the compound nucleus19Na is populated at low excitation energies which correspond to a region of a lower density of states.
6 Analysis and discussion
We have performed a similar R-matrix analysis to that performed in the case of 18O+p. For the first peak
la-Fig. 2. The measured excitation function for the elastic scattering reaction 18
O(p,p)18
O. The reconstructed differential cross section (CM, Θ = 180◦) is plotted as a function of the center of mass energy E
CM (lower axis) and the excitation energy EX
in19
F (upper axis). The error bars are statistical. The continuous curve represents a R-Matrix calculation using the known properties of states in19
F. All widths are not known, this may explain the differences between the experimental data and the calculated excitation function. The experimental resolution is measured to be σ = 30 keV. Insert: a zoom of the high energy part of the spectrum is shown, the continuous curve corresponds to the R-Matrix calculation, the dotted curve represents the data from Orihara et al. [16].
Fig. 3. The reconstructed differential cross section (CM, Θ = 180◦) for the elastic scattering reaction18Ne(p,p)18Ne is shown
as a function of the center of mass energy ECM (lower axis) and the excitation energy EX in 19Na (upper axis). The labels
correspond to the peaks described in the text. The continuous line represents a R-Matrix calculation when the properties of four states of19Na are taken into account (see text).
belled A in figure 3, the characteristic shape of the peak corresponds to a Jπ = 1
2 +
assignment. For that state we obtained ECM = 1076 ± 6 keV and Γ = 80 ± 20 keV. These values are in good agreement with the already known properties of the second excited state in19Na, pre-viously measured at ECM = 1066 ± 2 keV with a width of Γ = 101 ± 3 keV [7]. Taking into account the two results we obtain a mean value of ECM = 1067.0 ± 1.9 keV and Γ = 100.5 ± 3.0 keV. It is very interesting to compare this level with the known levels in19O, since the position of the excited states and the spectroscopic factors should be nearly identical for mirror nuclei. The level is at an ex-citation energy of Ex= 747 ± 14 keV in19Na, which only matches in the mirror nucleus with the known 1
2 +
state at a position of Ex = 1471.7 ± 0.4 keV. This means that the corresponding state in19
Na has been down shifted by ∆ = 725 keV ± 15 keV. To study the energy shift due to the Coulomb interaction we have performed calculations using a potential model. In a first step, we have fitted the depth of a Wood-Saxon well to reproduce the position of the analog state in 19
O. The state is calculated with a model of one neutron in the potential of a 18O core. In a second step we have computed the isospin symmetric system of one proton in the potential of a 18Ne core. For that calculation we have used the same nuclear potential as fitted in19
O, in addition to the Coulomb interaction for the proton. The calculation shows an energy shift between analog states. The largest correction is observed for the s-orbital, which corresponds to the Jπ = 1
2 +
assignment of the state. In that case, the energy shift is calculated to be ∆ = 749 keV, a value very close to the experimental one. This kind of calculation is clearly a good approxi-mation when the studied states can be well described by the simple model of one particle plus a core, i.e. when the spectroscopic factor (θ2
s.f.) for this configuration is close to 1. This is exactly the case in the mirror nucleus, the analog state is known with a measured value θ2
s.f.= 1. We performed a shell model calculation for that state, and it predicts a value very close to one, θ2
s.f. = 0.83. This cal-culated value of the spectroscopic factor, using our simple potential model, is equivalent to a width of Γ = 96 keV, again in agreement with the experimental value. In con-clusion, this state can be mainly described by the shell model configuration π(1d5/2)2
(2s1/2)1 .
The peak labelled B is intense and broad, with Γ ≈ 300 keV, and is positioned at an energy ECM ≈ 2.4 MeV corresponding to an excitation energy Ex≈ 2.1 MeV. Sur-prisingly it does not match any known state at the same position in the mirror nucleus. There are two known states in 19O at energies of E
x = 2.3715 MeV and Ex = 2.7790 MeV, but they can not match because they are assigned with spins Jπ = 9 2 + and 7 2 +
, both corresponding to an-gular momentum number ℓ = 4, which is excluded in our experiment because of the expected very narrow width for such a high angular momentum barrier. There are also two other known states in the mirror nucleus, positioned at excitation energies of Ex= 3.0671 MeV and Ex= 3.1535 MeV, with spin 3
2 + and 5 2 + , corresponding to an angular momentum number ℓ = 2, but they also can not match
because the Coulomb energy shift can not be so large as to explain the difference in energy.
The peak labelled C, positioned at an energy of ECM ≈ 3.1 MeV, corresponding to an excitation energy of Ex ≈ 2.8 MeV, has a width of Γ ≈ 500 keV. The intensity and the shape of the peak are very similar to those of the peak B. We have performed R-matrix calculations to simulate the elastic scattering including that state. In no case the calculations have fitted the experimental results.
In order to understand the origin of the peaks B and C, we have performed shell-model calculations. There are two main objectives for these calculations:
– All states are certainly not known experimentally in the mirror partner19O. Performing shell-model calcu-lations gives the possibility to predict the positions of states in19Na.
– Calculations give the possibility to predict the spectro-scopic factors θ2
s.f., i.e. the superposition probabilities between the entrance channel 18Ne + p and the dif-ferent states in the compound nucleus19
Na*, and also between the different states in19Na* and the different inelastic scattering channels18Ne∗ + p, which finally allow the calculation of the widths for elastic and in-elastic scattering.
For the nuclei with A = 19 and T = 3/2 we have per-formed a shell-model calculation in the spsdpf space and with the WBT [18] interaction. This calculation has been carried out with the shell-model code Oxbash [19]. We have allowed 0 and 1 ¯hω excitations, which have permit-ted the rising of low-lying negative-parity states. We have calculated all states up to Ex = 5.5 MeV, and all elastic scattering channels up to the angular momentum number of ℓ = 3. We have also calculated all inelastic scattering channels on the first excited state in18Ne (2+, E
x= 1887 keV [6]). We have used the experimental values of the ex-citation energies Eexp
x (see table 1) for the states in19Na or those known in the mirror nucleus. The partial widths are estimated in the standard way from the expression Γ = 2θ2
s.f.γ
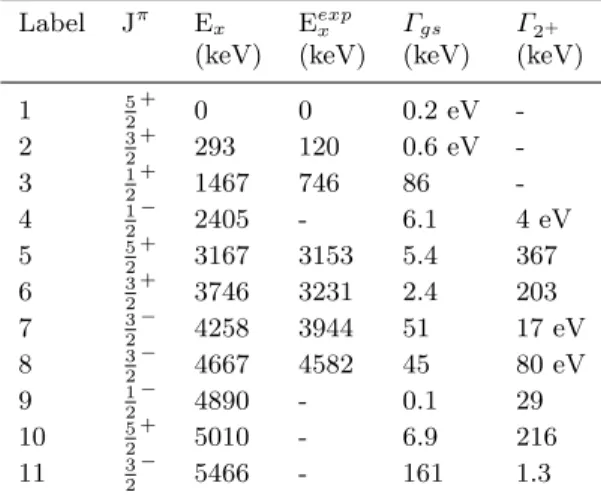
2P(ℓ,Q) where Q is the particle-decay energy, γ2 is the Wigner single-particle width and P(ℓ,Q) is the penetrability, l is the angular momentum of the transition. The penetrabilities are calculated in a Woods-Saxon well using the correct number of nodes of the wave functions. The summary of the calculations is given in table 1. It is interesting to notice that no state corresponding to the position of the peaks B and C is present in the table. A
1 2 −
state (labelled 4) is positioned at Ex = 2405 keV, but with a too narrow width of 6.1 keV to explain them. The state labelled 5 is positioned close to the position of the peak C. However, the predicted width is much too narrow to match. In fact, after a careful analysis we conclude that the peaks B and C have a shape and an intensity that can not match any interpretation in the frame of the simple elastic scattering.
To study the peaks D and E of figure 3 we proceeded an iterative analysis. The first two states in19Na (1 and 2 of table 1) are predicted to be too narrow to be observed. The known properties of state labelled 3 in table 1 have
Table 1. Predicted properties of states in 19
Na from shell model calculations. We used Qp= -320 keV. The symbol Eexpx
corresponds to the values we have used to calculate the widths Γgs and Γ2+, they correspond to the measured values of the
excitation energies when known [5, 7], or the excitation energies measured in the mirror nucleus19
O [6]. When it is not known, the predicted values Ex are used.
Label Jπ E
x Eexpx Γgs Γ2+
(keV) (keV) (keV) (keV)
1 5 2 + 0 0 0.2 eV -2 3 2 + 293 120 0.6 eV -3 1 2 + 1467 746 86 -4 1 2 − 2405 - 6.1 4 eV 5 5 2 + 3167 3153 5.4 367 6 3 2 + 3746 3231 2.4 203 7 3 2 − 4258 3944 51 17 eV 8 3 2 − 4667 4582 45 80 eV 9 1 2 − 4890 - 0.1 29 10 5 2 + 5010 - 6.9 216 11 3 2 − 5466 - 161 1.3
been introduced into the R-matrix program to produce a first excitation function, which fitted well the peak A using the slightly different values of width and energy reported in the table 2.
Table 2.Properties of the peaks measured in19
Na when figure 3 is interpreted as a pure elastic scattering. However, our R-matrix calculations can not fit the peaks B and C, the values are just indicative. See figure 3 and table 1 for labels.
Labels Jπ E x(keV) Γgs(keV) A - 3 1 2 + 756 ± 6 80 ± 20 B - ≈2.1 MeV ≈300 keV C - ≈2.8 MeV ≈500 keV D - 7 3 2 − 4371 ± 10 30 ± 10 E - 8 3 2 − 4903 ± 10 50 ± 10
In a second step we introduced in the R-matrix pro-gram the states predicted with Γgs > 10 keV, i.e. the three states labelled 7, 8 and 11 of table 1. They all have spin 3
2
−. Starting from the predicted properties for these states, we have computed an excitation function which was in a good agreement with the experimental excitation function. It reproduced the peaks D and E when we used the slightly modified properties reported in table 2. The predicted properties for the state 11 have been used with-out modification, but can not be used as real measured properties since states at excitation energies higher than 5 MeV are difficult to analyze. Indeed, at these high en-ergies there is a quite high density of broad states which are not easy to disentangle.
The final result of the above analysis is plotted in figure 3 as a continuous line. We can observed an good overall agreement, except for the peaks B and C.
7 Inelastic scattering
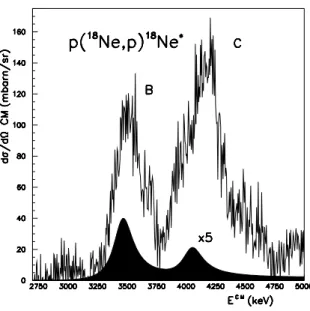
The two main observed peaks B and C can not be ex-plained by the elastic scattering channel. Nevertheless, the shell-model calculations (table 1) have revealed several states with broad widths in the inelastic channel, corre-sponding to the reaction: p(18Ne,p)18Ne∗(2+,1.887 MeV). The use of a thick target does not allow us to separate the different contributions, this is the main disadvantage of using a very thick target, the inelastic scattering contri-bution is added to the elastic scattering. The question then arises whether the two peaks could be explained by inelas-tic scattering process. The observed shape of the peaks may fit with what is expected from an inelastic scatter-ing. But the inelastic scattering cross sections is usually at least a factor 10 times lower than the elastic scattering cross sections. However, in the hypothesis of an inelas-tic scattering contribution, the excitation function has to be re-analyzed to take into account other kinematics and energy losses. This may affect drastically the excitation function. The re-analysis of the data has been performed in several steps. First, we have subtracted the calculated excitation function of figure 3 from the experimental exci-tation function to reveal the hypothetical inelastic contri-bution. Then we have re-analyzed this spectrum to pro-duce an excitation function. It resulted in the final exper-imental histogram shown in figure 4.
We can observe that peaks B and C are at energies close to the predicted positions for states 5 and 6 (from ta-ble 1). A calculation has been performed with the program Anarki to predict the excitation function for the inelastic scattering. We tried for states 5 and 6 different values of the parameters. A typical result is shown in figure 4 (using Γgs = 10 keV and Γ2+= 200 keV) as a filled surface
(am-plified by a factor 5). We can observe that the agreement is good for the shape and the position of the peaks, but there is a very large discrepancy in the intensity. Only a small part of the experimental peaks may be due to the in-elastic scattering contribution. Our conclusion is that the two main peaks B and C can not be explained only by the elastic neither the inelastic scattering channel. Therefore, we have searched for other possible processes.
8 Two-proton emission from
19Na
At our incident energy, several reaction channels are open: – In the case of18O:18O + p (elastic scattering),18O∗ + p (inelastic scattering with gamma emission),15N + α (Q = +3.98 MeV), 16 O + 3 H (Q = -3.7 MeV), 18F + n (Q = -2.44 MeV),17O + d (Q = -5.82 MeV), 14N + n + α (Q = -6.85 MeV), 14C + p + α (Q = -6.23 MeV).
Fig. 4.Peaks B and C from figure 3 have been re-analyzed in the inelastic scattering hypothesis. This new result is compared with a R-matrix calculation (the black surface amplified by a factor 5) using peaks 5 and 6 from table 1 with Γgs= 10 keV
and Γ2+= 200 keV. Although the shape and the position of the
peaks are in good agreement, the intensities are very different.
– In the case of18Ne:18Ne + p (elastic scattering),18Ne∗ + p (inelastic scattering with gamma emission),17F + 2p (Q = -3.922 MeV),16
O + 3p (Q = -4.522 MeV), 14O + α + p (Q = -5.113 MeV).
Several of these inelastic reactions result in the emis-sion of protons, which might produce extra peaks in our excitation function. Therefore, it is important to measure the contribution of these different channels. For that ob-jective we examined several questions:
– Do we feed other reaction channels than the elastic scattering ? To answer this question we used a tele-scope of silicon detectors. The teletele-scope has allowed a clear identification of the particles with a standard E-∆E plot. We have identified several channels, mainly β radioactivity rays or α particles production, but the telescope allowed the rejection of those particles. The α particles are observed as a low intensity contribution and with a continuous energy distribution, in contrast with the proton distribution.
– Do we have several contributions in the proton spectra ? We have performed several experimental tests with stable beams (18
O, 12 C, 24
Mg) to answer that ques-tion. The very good agreement found in the analysis of the data for the18O beam is in agreement with the hypothesis that other channels are negligible. More-over, no extra peak was visible in the 18O excitation function, even if several reaction channels are open in-cluding those with proton emission. In conclusion, in the case of stable beams there was no other contribu-tion in the excitacontribu-tion funccontribu-tion.
– Is the previous conclusion still valid for the 18Ne ra-dioactive beam ? In order to clarify this point an ad-ditional analysis was performed with a silicon strip-detector, allowing the detection of particles in coin-cidence. In the case of the 18O beam, no coincidence event was observed. But, in the case of the18
Ne beam, we observed events with proton multiplicity equal to 2.
We have observed a few hundred of events with two protons detected in coincidence. Thus, the spectrum cor-responding to the detection of single protons should be contaminated by protons coming from two-proton emis-sions. Indeed, the probability to detect only one proton after a two-proton emission is much larger than the prob-ability to detect the two protons in coincidence. In fact, in that case the probability is larger by a factor ℜ, which depends on the angular distribution of the two protons and the solid angle of the detectors.
In figure 5, we plotted the individual laboratory en-ergies from two-proton events (continuous line) and com-pared it with the energies in laboratory obtained in the region of the peaks B and C (elastic scattering background subtracted) when only one proton is detected (dashed line). 50000 6000 7000 8000 9000 10000 11000 12000 13000 14000 200 400 600 800 1000 Counts (a.u.) (keV) Lab E 1 proton 2 protons B C
Fig. 5.The individual energies in laboratory frame of the two-proton events (continuous line) are plotted and compared with the energies obtained when only one proton is detected (dashed line). A similar pattern is observed in the region of the peak B and C.
A similar pattern is observed for the two plots, two peaks are present but shifted in energy. These observed differences may be due to kinematical effects. Indeed, when we have two protons emitted from a nucleus, the second proton is shifted due to the emission of the first one. This effect has been estimated from a simulation using a se-quential emission process and an uniform angular distri-bution in center of mass. We found that kinematics pro-duce an energy shift in agreement with the observed one. Moreover, the factor ℜ, corresponding to the ratio between
the number of one-proton events divided by the number of two-proton events, has been estimated from our sim-ulation, and has been found to be ℜsim = 67, close to the experimental value ℜexp = 83, which corresponds to the ratio between the number of protons in the two peaks B and C divided by the number of detected two-proton events.
Thus, our conclusion is that the two peaks labelled B and C result from a complex combination of several two-proton emissions but when only one of the two two-protons is detected.
9 Analysis of the two-proton events
The analysis of the two-proton events can be performed in the framework of a sequential mode, i.e. the 2 protons are emitted one after another from one initial state in the compound nucleus 19
Na, through one intermediate state in the nucleus18Ne. But that problem has an infinite num-ber of solutions because we start with the two measured energies (e1 and e2) for the transitions and we have to deduce 3 excitation energies: the initial state in19
Na, the intermediate state in 18
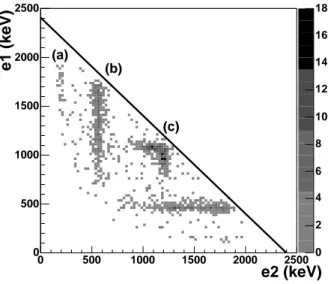
Ne, and the final state in17 F. To obtain a solution we have to assign the final state of 17F in the initial conditions. However this problem still gives two solutions, because we do not know which proton has been emitted first. An example of an ensemble of solutions is shown in figure 6 in the case where the final state is the ground state of17F. 0 500 1000 1500 2000 2500 0 500 1000 1500 2000 2500 0 2 4 6 8 10 12 14 16 18 e1 (keV) e2 (keV) (a) (b) (c)
Fig. 6.The reconstructed two dimensional energy distribution of the experimental two-proton events. The y axis corresponds to the center of mass energy of the first transition, from one excited state in 19Na to one excited state in18Ne, the x axis
is the energy of the second transition from the state in 18
Ne to 17
Fgs. The continuous line corresponds to the maximum
energy available in center of mass system. The 3 clusters of events producing the vertical lines labelled (a), (b) and (c), correspond to sequential transitions (see text).
In figure 6 the center of mass energy of the first transi-tion is plotted versus the energy of the second transitransi-tion. It is very interesting to observe that the points aligned along straight lines, thus providing a hint for a sequential decay. Indeed, the kinematical and energy loss corrections between the detected energies and the center of mass en-ergies are so strong, that this observation constitutes a confirmation of our interpretation of the data. This also means that the final state 17
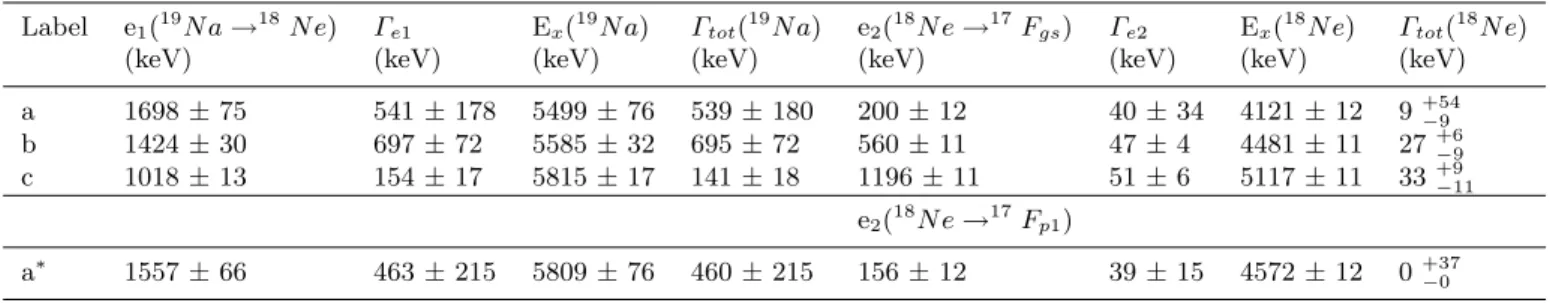
Fgs is a realistic hypothe-sis. The widths of the lines correspond to widths of the transitions. The energy resolution of the method has been estimated to be about 40 keV. The final interpretation is chosen after checking two conditions: the maximum en-ergy available in the center of mass is limited by the beam energy, and the first transition has always to be broader than the second one, because the width of the first transi-tion is a convolutransi-tion of the width of the initial state with the width of the intermediated state. In figure 6 we can observe 3 clusters of points, the vertical lines labelled (a), (b) and (c). The analysis of the data has been performed using the Breit-Wigner formula for the shape of the states. The maximum energy available in the center of mass is in-dicated by the line e1+ e2= 2400 keV in figure 6. We can observe that some events are very close to that limit, this may indicate that some transitions are cut. In the analysis, an energy limit has been introduced to take into account this effect. The total widths Γtot of the states have been determined taking into account our energy resolution. The results of this analysis are summarized in table 3.
Moreover, the first excited state in17F is only 495 keV above the ground state. We have also to consider the decay to this final state. In this hypothesis there is not enough energy left in the center of the mass frame to interpret a large part of the events seen in the transitions (b) and (c) of figure 6. This means it is not the correct interpre-tation for these events. On the other hand, all the events of the transition (a) can be analyzed in that hypothesis. The results are summarized in the last row of table 3 and labelled (a∗).
As a final check we have compared our measured states on 18Ne with the known properties of the excited states in that nucleus.
The state determined from transition (a) in the first row of table 3 is not known, the closest states in18Ne are a 1− state positioned 399 keV above our measured state, at Ex = 4520 ± 7 keV [20], and a 2+ state positioned 505 keV below, at Ex = 3616.4 ± 0.6 keV [21]. On the contrary, a correspondence can be found within the error bars in the (a∗) hypothesis. There is a known state at Ex = 4589± 7 keV, with Jπ = 0+ [21], which gives +17 keV energy difference. There are two other known states at Ex = 4523.7± 2.7 keV, with Jπ = 3+ [22], and at Ex = 4520± 7 keV, with Jπ = 1− [21], which give an energy difference of -48.3 keV and -52 keV. Our measured width is also in agreement with the known values Γ = 4 ± 4 keV, Γ = 18 ± 3 keV and Γ = 9 ± 6 keV. In the 0+ hypothesis, the proton may decay to the ground state of 17F (Jπ = 5
2
+) or to the first excited state at E
x = 495 keV (Jπ = 1
2 +
Table 3.Results corresponding to the two-proton events analyzed in the sequential mode. The widths Γe1and Γe2refer to the
widths of the proton transitions, and Γtotto the widths of the excited states.
Label e1( 19
N a →18N e) Γe1 Ex(19N a) Γtot(19N a) e2( 18
N e →17Fgs) Γe2 Ex(18N e) Γtot(18N e)
(keV) (keV) (keV) (keV) (keV) (keV) (keV) (keV)
a 1698 ± 75 541 ± 178 5499 ± 76 539 ± 180 200 ± 12 40 ± 34 4121 ± 12 9+54 −9 b 1424 ± 30 697 ± 72 5585 ± 32 695 ± 72 560 ± 11 47 ± 4 4481 ± 11 27+6 −9 c 1018 ± 13 154 ± 17 5815 ± 17 141 ± 18 1196 ± 11 51 ± 6 5117 ± 11 33+9 −11 e2(18N e →17Fp1) a∗ 1557 ± 66 463 ± 215 5809 ± 76 460 ± 215 156 ± 12 39 ± 15 4572 ± 12 0+37 −0
has l = 2 momentum transfer, and for the second case l = 0. The lower angular momentum barrier may explain why we observe the transition to the first excited state.
The state determined from the transition (b) can be associated with two states in18Ne: the state at E
x= 4520 ± 7 keV, Jπ= 1−, or the state at E
x= 4523.7 ± 2.9 keV, Jπ = 3+
. In those cases the differences in energy are ∆ e = 39 ± 18 keV and ∆ e = 43 ± 14 keV.
The state determined from the transition (c) can be associated with two states: Ex = 5153 ± 8 keV with Γ ≤ 20 keV and Jπ = 3− [20], and Ex = 5106 ± 8 keV with Γ = 45 ± 2 keV and Jπ = 2+
[24]. The energy difference is ∆ e = +36 ± 19 keV and ∆ e = -11 ± 19 keV.
The final overview of the results is presented in fig-ure 7. All known states in18Ne are shown above the pro-ton emission threshold up to 1.5 MeV. The observed two-proton transitions are drawn as discontinuous lines. It is interesting to observe that all lines are connected with a known state in18Ne, and inversely all known states above the proton emission threshold have been fed by a two-proton transition. Two states in19Na positioned very close to each other, at 5809 keV and 5815 keV, may be related to one unique state. In the mirror nucleus 19O there are several states known at close energies, two of them may be the analogue states since they have large widths: Γ = 490 keV at Ex = 5.54 MeV with Jπ = 32
+
, and Γ = 110 keV at Ex = 6.120 MeV with Jπ = 32
+
. However, it is probable that the states determined in 19
Na from the two-proton emission result from the mixed combination of several broad states. In that hypothesis the two-proton emission happens up to the maximum energy available in the center of mass frame, which seems to be the case here. Several aspects of the experiment has to be examined in the light of the new results:
– The non observation of two-proton decays from the compound nucleus 19
F in the measurement with the stable beam 18
O may be explained by the fact that other decay channels are open in that nucleus, mainly the alpha emission, with much larger branching ratios. They should have reduced drastically the two-proton contribution.
– As discussed above, in figure 3 the peaks B and C cor-respond to the detection of only one proton of the two-proton transitions. The efficiency to detected this kind
Ne+p 18 Na 19 F+2p 17 [320] [3922] 0 120 =101 keV 1/2+ Γ 746 =141 keV Γ 5815 + =45 keV 2 Γ 5106 -<20 keV 3 Γ 5153 + 0 0 =460 keV Γ 5809 + =4 keV 0 Γ 4589 495 1/2+ O 5/2+ =695 keV Γ 5585 -=9 keV 1 Γ 4520 + =18 keV 3 Γ 4523.7 =50 keV 3/2-Γ 4903 =30 keV 3/2-Γ 4371 (a*) (b) (c) Two-proton transitions
Fig. 7.Level scheme which summarizes the known states prop-erties of 19
Na. All known unbound states above the proton emission threshold on18
Ne are shown here up to 1.5 MeV. The observed two-proton transitions are shown with non continu-ous lines. They are all connected with known states in18
Ne.
of event is increased by focusing effects at forward an-gles. The focusing effects also exist in inelastic scatter-ing with gamma emission. However simulations show that the focusing effect is higher when the total avail-able energy is shared by two protons. This explains why we observe only the peaks B and C, correspond-ing to two-proton decays (p,pp), and not other peaks corresponding to inelastic (p,pγ) contributions. How-ever, these inelastic contributions should be present in figure 3 with a lower intensity, and they may ex-plain the small differences we can observe between the R-matrix calculation and the experimental result. An example of (p,pγ) contribution has been shown in
fig-ure 4 for the inelastic scattering on the first excited state.
10 Three-proton, simultaneous two-proton
emissions ?
The three-proton emission channel is open in our experi-ment but no event with 3 protons in coincidence has been observed. This does not mean they are not produced since our detection efficiency is very low for this kind of events. However, the probability to observe 2 of the 3 protons is much larger. In this case we should observe 3 two-proton coincidences. They are not observed in figure 6. But, it is possible that 2 of the 3 protons have energies very close, as it seems to be the case with the events of the transi-tion labelled (c). In this case, they are not resolved, we only see twice two-proton coincidences. Our simulation of the process has shown that we never have enough energy in the center of mass frame to produce 3 proton transi-tions where two of them are detected with the energies we have measured. In conclusion, no three-proton emission was observed in our experiment.
In figure 6, it is surprising to observe that the transi-tion labelled (c) is located near the line e1 = e2. For these events, the difference in energy is very small, the mean value for |e1 − e2|lab = 500 ± 370 keV and |e1 + e2|lab = 21200 ± 510 keV. These events may be related to the simultaneous emission of two protons (2He emission) [23, 24]. The equality of the energies may be a natural conse-quence of this decay mode. However, we were not able to measure the angular distribution for these events because our angular acceptance was relatively narrow. Since the analysis of these events using the sequential decay mode involves an intermediate excited state in 18
Ne which is known, it is probable that the equality of the energies is just accidental.
11 Conclusions
We have performed an experiment to measure the elastic scattering excitation function of a18Ne radioactive beam from the SPIRAL facility on a thick solid cryogenic hy-drogen target. We have observed two new states in the compound nucleus 19
Na with Jπ=3 2 −
, at Ex=4371 ± 10 keV with Γ =30 ± 10 keV and at Ex=4903 ± 10 keV with Γ =50 ± 10 keV. The understanding of the decay process was crucial to understand the high excitation energy part of the 19
Na excitation function. We have also observed two intense peaks mainly corresponding to the detection of single protons from two-proton emissions. A strip de-tector allowed to identify the two-proton transitions. It is important to notice that the detection of two-proton events is enhanced at forward angles from focusing effects in inverse kinematics. The two-proton events have been in-terpreted in a sequential decay mode, and three new states with large width may have been determined in19Na.
Future experiments of elastic scattering at low energy are possible even with much lower beam intensities. They will provide an efficient tool to undertake the spectroscopy of the most exotic nuclei. These future experiments aimed at the search of states at high excitation energies in the unbound neutron-deficient nuclei should take into account the detection of the multi-proton events and include pro-ton detectors of high granularity and energy resolution. In addition, the improvement of the detection system by in-creasing the total acceptance and by measuring the angu-lar distribution will allow the efficient spectroscopy of the intermediate states from multi-particle emissions, as it has been demonstrated in our experiment with the measure-ment of states in 18Ne from two-proton emissions. How-ever, it is important that future theoretical studies shed light on the two-proton emission from excited states, and particularly on the simultaneous emission mode.
12 Acknowledgement
We would like to thank the GANIL staff and the technical support for the successful challenge of providing for the first time the SPIRAL beam with good optical qualities. We thank M. Ploszajczak for stimulating discussions. This work has been supported by the European Community-Access to Research Infrastructure action of the Improving Human Potential Program, contract N◦HPRI1999-00066.
References
1. S.M. Lukyanov, Yu. E. Penionzhkevich, R. Astabatyan, S. Lobastov, Yu. Sobolev, D. Guillemaud-Mueller, G. Faivre, F. Ibrahim, A.C. Mueller, F. Pougheon, O. Perru, O. Sor-lin, I. Matea, R. Anne, C. Cauvin, R. Hue, G. Georgiev, M. Lewitowicz, F. de Oliveira Santos, D. Verney, Z. Dlouhy, J. Mrazek, D. Baiborodin, F. Negoita, C. Borcea, A. Buta, I. Stefan and S. Grevy, J. Phys. G. 28, (2002) L41.
2. M. Notani, H. Sakurai, N. Aoi, Y. Yanagisawa, A. Saito, N. Imai, T. Gomi, M. Miura, S. Michimasa, H. Iwasaki, N. Fukuda, M. Ishihara, T. Kubo, S. Kubono, H. Kumagai, S.M. Lukyanov, T.K. Onishi, Yu.E. Penionzhkevich, S. Shimoura, T. Teranishi, K. Ue, V. Ugryumov, A. Yoshida, Phys. Lett. B 542, (2003) 84.
3. T. Zerguerras, B. Blank, Y. Blumenfeld, T. Suomijrvi, D. Beaumel, B.A. Brown, M. Chartier, M. Fallot, J. Giov-inazzo, C. Jouanne, V. Lapoux, I. Lhenry-Yvon, W. Mittig, P. Roussel-Chomaz, H. Savajols, J.A. Scarpaci, A. Shrivas-tava and M. Thoennessen, Eur. Phys. J. A, 20, (2004) 389. 4. J. Cerny, R.A. Mendelson, G.J. Wozniak, J.E. Esterl and
J.C. Hardy, Phys. Rev. Let. 22, (1969) 612.
5. W. Benenson, A. Guichard, E. Kashy, D. Mueller, H. Nann and L.W. Robinson, Phys. Let. B 58, (1975) 46.
6. D.R. Tilley, H.R. Weller, C.M. Cheves, R.M. Chasteler, Nucl. Phys. A 595, (1995) 1.
7. C. Angulo, G. Tabacaru, M. Couder, M. Gaelens, P. Leleux, A. Ninane, F. Vanderbist, T. Davinson, P.J. Woods, J.S. Schweitzer, N.L. Achouri, J.C. Ang´elique, E. Berthoumieux, F. de Oliveira Santos, P. Himpe, and P. Descouvemont, Phys. Rev. C 67, (2003) 014308.
8. L. Axelsson, M.J.G. Borge, S. Fayans, V.Z. Goldberg, S. Grevy, D. Guillemaud-Mueller, B. Jonson, K.-M. Kallman, T. Lonnroth, M. Lewitowicz, P. Manng˚ard, K. Markenroth, I. Martel, A. C. Mueller, I. Mukha, T. Nilsson, G. Nyman, N. A. Orr, K. Riisager, G. V. Rogatchev, M.-G. Saint-Laurent, I. N. Serikov, O. Sorlin, O. Tengblad, F. Wenander, J. S. Winfield, and R. Wolski, Phys. Rev. C 54, (1996) R1511. 9. V.Z. Goldberg, V.I. Dukhanov, A.E. Pakhomov, G.V.
Rogachev, I.N. Serikov, M. Brenner, K-M. K¨allman, T. L¨onnroth, P. Manng˚ard, L. Axelsson, K. Markenroth, W. Trzaska and R. Wolski, Physics of Atomic Nuclei (Yadernaja Fizika) 60, (1997) 1186.
10. K. Markenroth, L. Axelsson, S. Baxter, M.J.G. Borge, C. Donzaud, S. Fayans, H.O.U. Fynbo, V.Z. Golberg, S. Gr´evy, D. Guillemaud-Mueller, B. Jonson, K.-M. K¨allman, S. Leen-hardt, M. Lewitowicz, T. L¨onnroth, P. Manngard, I. Mar-tel, A.C. Mueller, I. Mukha, T. Nilsson, G. Nyman, N.A. Orr, K. Riisager, G.V. Rogatev, M.-G. Saint-Laurent, I.N. Serkov, N.B. Shul’gina, O. Sorlin, M. Steiner, O. Tengblad, M. Thoennessen, E. Tryggestad, W. H. Trzaska, F. Wenan-der, J.S. Winfield, and R. Wolski, Phys. Rev. C 62, (2000) 034308.
11. A.C.C. Villari, C. Barue, G. Gaubert, S. Gibouin, Y. Huguet, P. Jardin, S. Kandri Rody, F. Landre Pellemoine, N. Lecesne, R. Leroy, M. Lewitowicz, C. Marry, L. Maunoury, J.Y. Pacquet, J.P. Rataud, M.G. Saint-Laurent, C. Stodel, J.C. Angelique, N.A. Orr, R. Lichtenthaler, Nucl. Phys. A 701, (2002) 476c.
12. A.C.C. Villari and the SPIRAL group, Nucl. Instr. and Meth. B 204, (2003) 31.
13. W. Mittig and P. Roussel-Chomaz, Nuclear Physics A 693, (2001) 495.
14. P. Dol´egi´eviez, P. Robillard, P. Gallardo, M. Ozille, D. Heuze, GANIL Report A00 01, (2000)
15. http://www.srim.org/
16. H. Orihara, G. Rudolf and Ph. Gorodetzky, Nucl. Phys. A 203, (1973) 78.
17. E. Berthoumieux, B. Berthier, C. Moreau, J.P. Gallien, A.C. Raoux, Nucl. Instr. and Meth. B 136-138, (1998) 55. 18. E.K. Warburton, B.A. Brown, Phys. Rev. C, (1992) 923. 19. B. A. Brown, A. Etchegoyen and W. D. M. Rae,
MSU-NSCL report N 524.
20. K.I. Hahn, A. Garcia, E. G. Adelberger, P. V. Magnus, A. D. Bacher, N. Bateman, G. P. A. Berg, J. C. Blackmon, A. E. Champagne, B. Davis, A. J. Howard, J. Liu, B. Lund, Z. Q. Mao, D. M. Markoff, P. D. Parker, M. S. Smith, E. J. Stephenson, K. B. Swartz, S. Utku, R. B. Vogelaar, and K. Yildiz, Phys. Rev. C 54, (1996) 1999.
21. A. Garcia, E. G. Adelberger, P. V. Magnus, D. M. Markoff, K. B. Swartz, M. S. Smith, K. I. Hahn, N. Bateman, and P. D. Parker, Phys. Rev. C 43, (1991) 2012.
22. D.W. Bardayan, J.C. Blackmon, C.R. Brune, A.E. Cham-pagne, A.A. Chen, J.M. Cox, T. Davinson, V.Y. Hansper, M.A. Hofstee, B.A. Johnson, R.L. Kozub, Z. Ma1, P.D. Parker, D.E. Pierce, M.T. Rabban, A.C. Shotter, M.S. Smith, K.B. Swartz, D.W. Visser, and P.J. Woods, Phys. Rev. Lett. 83,(1999) 45.
23. V.I. Goldansky, Nuclear Physics 19, (1960) 482.
24. J. G´omez del Campo, A. Galindo-Uribarri, J. R. Beene, C. J. Gross, J. F. Liang, M. L. Halbert, D. W. Stracener, D. Shapira, R. L. Varner, E. Chavez-Lomeli, M. E. Ortiz, Phys. Rev. Lett. 86, (2001) 43.