HAL Id: hal-01151246
https://hal.archives-ouvertes.fr/hal-01151246
Submitted on 12 May 2015HAL is a multi-disciplinary open access
archive for the deposit and dissemination of sci-entific research documents, whether they are pub-lished or not. The documents may come from teaching and research institutions in France or abroad, or from public or private research centers.
L’archive ouverte pluridisciplinaire HAL, est destinée au dépôt et à la diffusion de documents scientifiques de niveau recherche, publiés ou non, émanant des établissements d’enseignement et de recherche français ou étrangers, des laboratoires publics ou privés.
Electro-active elastomer composite based on doped
titanium dioxide Electro-active elastomer composite
based on doped titanium dioxide
Alaedine Kossi, Georges Bossis, Jacques Persello
To cite this version:
Alaedine Kossi, Georges Bossis, Jacques Persello. Electro-active elastomer composite based on doped titanium dioxide Electro-active elastomer composite based on doped titanium dioxide. Journal of Materials Chemistry C, Royal Society of Chemistry, 2015, Journal of Materials Chemistry C, pp.1546 - 1556. �10.1039/c4tc02535k�. �hal-01151246�
Electro-active elastomer composite based on doped titanium dioxide
Alaedine Kossi*, Georges Bossis and Jacques Persello
Laboratoire de Physique de la Matière Condensée LPMC, CNRS UMR 7336, University of Nice-Sophia Antipolis, Parc Valrose 06108 Nice, France
*Corresponding author: Alaedine Kossi; Tel: +33 492 076 535; E-mail: [email protected]
Journal of Materials Chemistry C, 2015, 3, 1546 - 1556
Received 6th November 2014 Accepted 13th December 2014 DOI: 10.1039/c4tc02535k www.rsc.org/MaterialsC
Electro-active elastomer composite based on doped titanium dioxide
Alaedine Kossi*, Georges Bossis and Jacques Persello
Laboratoire de Physique de la Matière Condensée LPMC, CNRS UMR 7336, University of Nice-Sophia Antipolis, Parc Valrose 06108 Nice, France
*Corresponding author: Alaedine Kossi; Tel: +33 492 076 535; E-mail: [email protected] Abstract: Recently, electro-active composites have been considered by several researchers
because they exhibit an interesting change in their viscoelastic properties under an applied electric field. However, their relative elastic modulus change ΔG’=G'(E)-G'(0) is still low and rarely exceed 100 kPa. In this article, we demonstrated that, by synthesizing mesoporous aggregates of titanium dioxide (TiO2) and by adsorbing acetylacetone dipolar molecule
(Acac) onto the TiO2 surface, the TiO2-Acac/PDMS electrorheological elastomer achieved a
relative elastic modulus change ΔG’ higher than 500 kPa for an applied electric field of 2 kV mm-1. The dependence of the electrorheological response of TiO
2-Acac/PDMS on the DC
electric field strength, AC electric field frequency and shear strain magnitude was discussed regarding the conductivity ratio and permittivity ratio between doped TiO2 semiconducting
particles and the PDMS matrix. The high electrorheological performance of TiO2-doped Acac
as semiconducting particles filled in the elastomeric matrix makes this kind of material a promising candidate for application in the automotive industry, robotics, vibration isolators, building applications or electro-active actuators.
Keywords: electrorheological elastomer, electromechanical properties,
semiconductor-insulator composites, TiO2 colloidal particles, PDMS cross-linked matrix
1. Introduction
Magnetorheological and electrorheological fluids are suspensions of micro- or sub-microparticles dispersed in a liquid matrix whose viscosity can be changed by the application of a magnetic or an electric field, respectively. Their solid counterparts are magnetorheological elastomers (MREs) and electrorheological elastomers (EREs).
Magnetorheological elastomers can exhibit a change of their Young’s modulus of several hundred kPa under the application of a magnetic field of 0.2-0.5 Tesla and have numerous applications as actuators, vibration isolators or variable capacitors.1, 2
Electrorheological elastomers (EREs) are made by suspending semiconducting particles in a cross-linkable insulating polymer. The semiconducting particles are aligned under an applied electric field to form columns in the insulating medium and then the structured dispersion is cross-linked to maintain the anisotropic structure in the polymeric network. In response to an applied electric field ERE composites manifest a rapid and reversible change of modulus. The main cause inducing the ER effect is the mismatch in dielectric constant and conductivity between semiconducting particles and insulating medium that generate dipolar interactions in the presence of an AC or DC electric field. Theoretical models based on linear electrostatics have been developed to understand the physical mechanisms involved in the ER effect, regarding the role of the permittivity and conductivity in the interaction forces between particles. These studies showed that the attraction force in ER fluids increases with the
applied electric field according to a quadratic law 𝐹𝑒𝑙𝑒𝑐 ∝ 𝐸02.3-5 However, lower exponents (1≤n<2) in the dependence of Felec on E0 were observed experimentally at a high applied
electric field.6,7 This deviation from the quadratic law was interpreted theoretically by considering, in addition to the solid particle conductivity, the dependence of the matrix conductivity on the electric field which gives rise to a saturation of the local electric field.8,-16
The possibility to vary the electromechanical characteristics of EREs and their structural stability make them attractive for developing new smart materials with potential application in the automotive industry, robotics and prosthetic limbs, vibration isolators, building applications and electro-active actuators. 17-25 For this purpose, ERE composites containing
different inclusions and dispersed in different matrices, PANI/PDMS,22 PbTiO3/AR7,26
Starch/Silicone oil/Silicone rubber,27, 28 polythiophene/polyisoprene,29 Pb(Zr0.5,Ti0.5)O3/Acrylic rubber,30
polydiphenylamine/poly(styrene-block-isoprene-block-styrene,31 poly(p-phenylene)/Acrylic elastomer,32 or cellulose/BMIMCl gel,33 have been investigated. These systems exhibited an increase of their electromechanical properties, and, in particular, of their storage modulus sensitivity {(G'(E)-G'(0))/G’(0)}. However their relative modulus change {G'(E)-G'(0)} was still low and rarely exceeded 100 kPa (compared for instance to 1 MPa for the magnetorheological elastomers (MREs)). Furthermore the matrices used for these EREs were too soft (zero field modulus around 100 kPa: cf. table 2) for most of the applications. Other type of ER materials based on a particular morphology of semiconducting particles emerged and showed an interesting ER effect when used as electrorheological fluids (ERFs).34-37 It has been reported that the use of mesoporous
Ce-doped TiO2 enhanced the ER response of Ce-doped TiO2/silicone oil ER fluid and its yield
stress was 20 times higher than that of pure dense TiO2/PDMS fluid.38, 39 Other workers
reported that ERFs based on nano-sized particles showed a so called giant electrorheological effect (GER) when the nanoparticles were coated by molecules having high dipole moments.40, 41
In this work, we investigated the response of an electrorheological elastomer (ERE) based on doped titanium dioxide. The specificity of this material lies in three main points: (i) the modification of the intrinsic properties of pure TiO2 by adding an aluminium cation (Al3+) as
substitution impurities of (Ti4+) in the TiO2 lattices during their growth, (ii) the synthesis of
TiO2 aggregated nanoparticle with a high specific surface area and (iii) the adsorption of
Acetylacetone dipolar molecules (Acac) as a doping agent on the TiO2 surface. The aim
underlying these choices was the improvement of relative modulus change (ΔG’) developed by conventional electrorheological elastomers. Indeed, by proceeding so, it was expected that the dielectric properties of the semiconducting particles were improved, the attraction force between particles (when subjected to an external electric field) was amplified, and therefore the electro-rheological response was enhanced. In a previous study we have shown that by doping TiO2 nanoparticles with Acac we could obtain a good ER fluid with a large increase of
shear modulus.42 The aim of this work was to obtain such a high field induced modulation, not in the fluid phase but in an elastomeric matrix having a zero field modulus high enough, like PDMS, to be used for active damping applications. This result is not at all granted because the cross-linking pre-polymers are about one hundred times more viscous than the silicone oil used for ER fluid and also because the chain like structure induced by the field can be partly destroyed by the cross-linking process. Here we investigated the electrorheological response of 20 v. % Acac-doped TiO2 semiconducting particles that were embedded and
aligned in PDMS cross-linkable matrix as an ERE. In the first section we present the process used for synthesizing the TiO2 particles, their morphological characterization, then the
preparation of the TiO2-Acac/PDMS ERE and the experimental conditions for measuring the
shear moduli (elastic modulus G’ and loss modulus G”). In the second section we first study the kinetics of polymerization by following the viscoelastic properties of samples under an oscillatory shear with and without field during curing. Then we present the electrorheological response of the cross-linked material in terms of the shear modulus increase and of induced current versus electric field amplitude and frequency; here the obtained results were discussed qualitatively in relation to the non linear model of conductivity. Finally we demonstrate the variation in the viscoelastic properties of the TiO2-Acac/PDMS ERE versus the magnitude of
the shear strain, for an AC and DC applied electric field. 2. Experimental section
2-a Particles synthesis
Nano-sized TiO2 powder was synthesized via a sol–gel method,42 using titanium
tetraisopropoxide (Sigma-Aldrich, 98 %, solution), 2-Propanol (Sigma-Aldrich, ACS reagent, ≥99.5 %), aluminium isopropoxide (Aldrich, 99.99 %), ammonium hydroxide
(Sigma-Aldrich, 28 % NH3 in H2O), acetylacetone (Sigma-Aldrich, ReagentPlus®, ≥99 %), nitric acid
(Sigma-Aldrich, ACS reagent, 70 %), acetic acid (Sigma-Aldrich, ACS reagent, ≥99.7 %) and ultrapure water (≥18 M.cm) as starting materials. In a typical procedure, titanium (IV)
tetraisopropoxide (0.388 mol), was rapidly added to ultrapure water (640 ml) and then stirred for 30 min. A white precipitate formed immediately upon addition of the titanium (IV) isopropoxide. The resultant colloid was recovered by centrifugation (10000 g for 30 min). The centrifugation cake was added into a jacketed three-necked flask reactor equipped with a mechanical stirring containing 750 ml of an aqueous solution, of molar composition ; 0.36 M nitric acid, 1 M acetic acid and 0.05 M aluminium isopropoxide. Al3+ was used here in small quantity as impurity, in order to create ionic substitution defects in the TiO2 lattice during
growth and to improve the dielectric properties (permittivity and conductivity) of the synthesized TiO2 (pure TiO2 had weak electrorheological response).38, 43 The pH of the
colloidal solution after addition of the cake was measured to be between 1 and 2. Peptization occurred after heating the product at 80 °C for 1 h under medium stirring, whereupon the slurry became a stable sol. Then the sol was cooled down to room temperature and a 17 M ammonium hydroxide solution was added drop by drop into the TiO2 sol under low stirring in
order to form a white gel. The pH of the resultant colloidal suspension was measured to be close to 7. The gel was then collected by centrifugation (10000 g for 30 min) and dried at 110 °C overnight. The powder was crushed and ground into fine powder using a mortar and pestle and was further calcined in air at 500 °C for 4 h.
2-b Particles characterization
Morphological characterization of the obtained TiO2 was shown in Figure 1. TEM
pictures performed on the obtained TiO2 particles in aqueous medium at pH≈ 7 (Figure 1 (a)
and (a’)) showed spherical particles with a diameter between 12 and 20 nm that were aggregated between them in a form of large clusters having a weak density. After heat treating TiO2 powder at 500 °C for 4h in air, the SEM picture (Figure 1 (b)) showed
relatively dense aggregates formed from the TiO2 nanoparticles. The density of the calcined
TiO2 was measured using a 5 cm3 standard flask pycnometer and was found to be about 3.84 g
cm-3. The type of porosity and specific surface area of the calcined TiO
Figure 1: Morphological characterization of synthesized TiO2 particles: (a) TEM picture of the
dilute TiO2 suspension as obtained at pH 7; inset (a’) TEM picture of the same TiO2 with a
magnified scale, (b) SEM picture of TiO2 after heat-treatment at 500 °C, (c) and (d) are the N2
adsorption/desorption isotherm and the BET plot of N2 adsorption performed on the
calcined TiO2 powder, respectively, (e) and (f) the SANS spectra of TiO2 powder (calcined at
500°C/4h) dispersed in PDMS silicone oil (20 v. %) giving, respectively, the scattered intensity Iq (cm-1) versus wave vector q (A°-1) and the corresponding Porod representation q4Iq (cm-5)
as a function of wave vector q (A°-1).
determined by a N2 adsorption/desorption technique. Figure 1 (c) shows a hysteresis in the
N2 adsorption/desorption isotherm for relative pressures 0.55 < P/P0 < 0.95 which is a typical
characteristic of mesoporous or nanoporous aggregates. The BET plot of N2
adsorption/desorption (Figure 1 (d)) showed that the value of the specific surface area of TiO2 powder (Abet) was about 295 m2g-1. Small angle neutron scattering (SANS) was
performed on calcined TiO2 particles that were dispersed in PDMS oil (20 v. % TiO2/PDMS).
The SANS spectra giving the scattered intensity Iq (cm-1) versus wave vector q (A°-1) (Figure
1 (e)) showed a relative maximum of the scattered intensity for a value of wave vector q about
0.356 nm-1 giving an average diameter of TiO2 nanoparticles close to 18 nm which was in
agreement with that estimated from TEM observations. The Porod plot of the scattered intensity q4Iq (cm-5) as a function of the scattering wave vector q (A°-1) (Figure 1 (f)) showed
envelope of micrometric grains and the second at high q values which was due to the scattering inside the nanoparticles of 18 nm of diameter. This behaviour is characteristic of porous systems formed from nanoparticles assembling where two length scales were largely separated; nanoparticles on one hand and micrometric grains on the other.
2-c Preparation of the TiO2 ERE
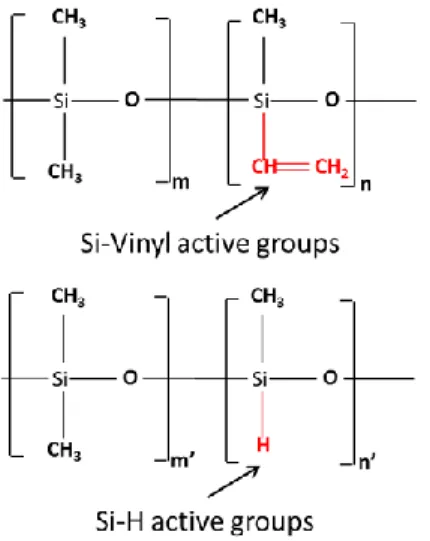
Figure 2: The chemical structure of PDMS crosslinking pre-polymers.
TiO2 particles were introduced into a cross-linkable liquid composition comprising two
polysiloxane (PDMS) constituents: as shown in Figure 2, one of them carrying Si-vinyl groups and the other carrying Si-H groups. Crosslinking by hydrosilylation reaction was initiated thermally and with a platinum-based catalyst. These cross-linking materials (cross-linking agents and catalyst) were integrated into two separated containers, Rhodorsil RTV141 A, viscosity 3.5 Pa.s, density 1.02 g cm-3 at 25 °C and Rhodorsil RTV141 B, viscosity 0.65
Pa.s, density 1.02 g/cm3 at 25 °C, that were purchased from Bluestar Silicones. To 10 parts of Rhodorsil RTV141 A were added 1 part of Rhodorsil RTV141 B in order to obtain the crosslinking reactions with a molar stoichiometry of groups, Si-vinyl / Si-H close to 1. The amount of TiO2 particles was fixed at 50 wt. % (~20 v. %) in the whole mixture then a few
drops of acetylacetone was added to the mixture (the Acac amount was less than 1.5 wt. % in order to obtain surface adsorption of Acac/TiO2 ≤ 1Acac molecule per nm2). The process
A in a mortar until obtaining a homogeneous dispersion, then the mixture was degassed under vacuum for 30 min using a vacuum pump for removing any air bubbles that may be traped in the mixture. At this stage no crosslinking reaction was started. The Rhodorsil RTV141 B component was then added to the mixture. After homogenizing the whole by mechanical stirring, the dispersion was degassed again for 5 min and then rapidly poured onto the rheometer plateau to monitor the crosslinking reaction (controlled by temperature and time) with or without an applied electric field under shear.
2-d Electrorheological measurements
The viscoelastic properties were measured by using an Anton Paar Physica MCR301 rheometer which was equipped with an electrorheological temperature device (Anton Paar) consisting of a parallel plate geometry of 25 mm diameter (PP25/E) and a Peltier temperature device (P-PTD200/E) allowing rheological measurements under applied electric field with thermally controlled environment. A regulated DC power supply (XANTREX-Model HPD 30-10SX) and AC voltage (Hameg function generator HM8030-5) combined with a high voltage amplifier (Trek Model 609E-5) were used to apply DC or AC electric field in the range of 0 to 4 kV/mm across a 1 mm gap between plate geometries. Multimeter (TENMA 72-7735) was used to measure the DC or AC electric current passing through the gap during crosslinking under applied electric field and rheological monitoring.
3. Results and discussion
3-a Cross-linking kinetics with and without an applied electric field:
The polymerization kinetics of the TiO2-Acac particles-filled PDMS (20 v. % TiO2-Acac
filler in reacting PDMS) was monitored by measuring the storage and loss moduli during cross-linking reaction at constant strain magnitude γ=0.1 % and ω=100 rad/s. the crosslinking reaction is carried out at a constant temperature of 80 °C. The experiments were carried out under three different conditions. In one, pure PDMS pre-polymers were cross-linked without
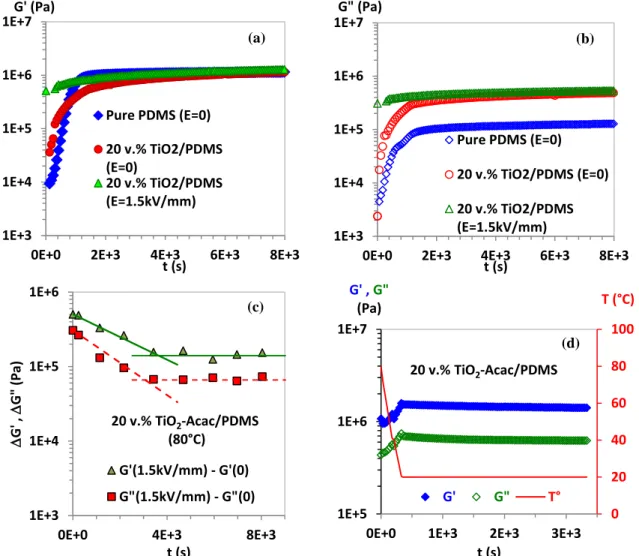
Figure 3: TiO2 ERE cross-linking kinetics, (a) G’ of pure PDMS and G’ of 20 v. % TiO2/PDMS
without pre-alignement (E=0kV/mm) and with pre-alignement at E=1.5 kV/mm AC electric field strength (νac=10 Hz), (b) G” of pure PDMS and G” of 20 v. % TiO2/PDMS with and
without pre-alignement, (c) ΔG’=G’E=1.5kV/mm- G’E=0 and ΔG”= G”E=1.5kV/mm- G”E=0 during
cross-linking of 20 v.% TiO2/PDMS, (d) variation of G’ and G” of the TiO2-Acac/PDMS ERE after the
end of cross-linking (at E= 0 kV/mm) versus time as the sample was cooled down (linear ramp of temperature from 80 to 20°C) and maintained at constante T= 20°C. Shear moduli are measured at strain amplitude γ= 0.1 % and ω=100 rad/s and for fig. (a), (b) and (c) the temperature was fixed at T=80°C.
particles and in the second one, TiO2-Acac particles were randomly distributed in PDMS
pre-polymers without pre-alignment during crosslinking. In the third one an AC electric field strength of 1.5 kV/mm with a frequency of 10 Hz was applied to pre-align the particles in PDMS precursors before starting polymerization and was maintained during the entire cross-linking reaction time. The use of an AC electric field was deliberately chosen to prevent the electrophoretic transport towards electrodes (phase separation resulting from the accumulation
1E+3 1E+4 1E+5 1E+6 1E+7
0E+0 2E+3 4E+3 6E+3 8E+3 G' (Pa) t (s) Pure PDMS (E=0) 20 v.% TiO2/PDMS (E=0) 20 v.% TiO2/PDMS (E=1.5kV/mm) (a) 1E+3 1E+4 1E+5 1E+6 1E+7
0E+0 2E+3 4E+3 6E+3 8E+3 G" (Pa) t (s) Pure PDMS (E=0) 20 v.% TiO2/PDMS (E=0) 20 v.% TiO2/PDMS (E=1.5kV/mm) (b) 1E+3 1E+4 1E+5 1E+6
0E+0 4E+3 8E+3
D G' , D G" (Pa) t (s) 20 v.% TiO2-Acac/PDMS (80°C) G'(1.5kV/mm) - G'(0) G"(1.5kV/mm) - G"(0) (c) 0 20 40 60 80 100 1E+5 1E+6 1E+7
0E+0 1E+3 2E+3 3E+3
T (°C) G' , G" (Pa) t (s) 20 v.% TiO2-Acac/PDMS G' G" T° (d)
of the particles on the electrode surfaces) that may occurred by applying a DC electric field in the first step of crosslinking process (where the dispersion is still fluid). Figures 3 (a) and 3 (b) show that both G’ and G” of pure PDMS increase from a few kPa to their equilibrium
values (G’=0.90 MPa and G”= 87 kPa) for t= 1260 s. However in the presence of 20 v. %
TiO2-Acac filler in reacting PDMS pre-polymer (without pre-alignment), the cross-linking
rate was slowed significantly with G’ and G” (of 20 v. % TiO2-Acac/PDMS) reaching
equilibrium after 3300s. We assumed that the addition of TiO2-Acac filler caused the
reduction of the activity of platinum catalyst complex and then the reduction of the cross-linking rate. After reaching the equilibrium, we observed no significant difference in the storage moduli G’ of both pure PDMS and 20 v. % TiO2-Acac/PDMS, while additional
energy dissipation was observed in TiO2-Acac/PDMS network (Figure 3 (b)) where its loss
modulus G” was about 4.8 time higher than that of pure PDMS. Figure 3 (a) and 3 (b) show a
comparison of the cross-linking kinetics between TiO2-Acac/PDMS without an applied
electric field and pre-aligned TiO2-Acac/PDMS with an applied electric field. With an
applied AC electric field (E=1.5 kV/mm and ν=10 Hz) the nominal ER response of the TiO2
-Acac/PDMS in its fluid phase (before starting cross-linking at t=0 s) was about G’=0.50 MPa and G”=0.30 MPa; then both G’ and G” were increased during the crosslinking time until reaching their equilibrium values (G’ = 1.04 MPa and G” = 0.486 MPa) at t=3300 s. However, before reaching the equilibrium, the increase on G’ and G” under the applied
electric field was less pronounced than that without pre-alignment or in other words we did not have the addition of the part of modulus induced by the electric field (at t = 0) and the one given by the polymerization of the PDMS network. This behaviour can be easily seen in Figure 3 (c) where the relative change during time, ΔG’=G’E=1.5kV/mm- G’E=0 and ΔG”=
G”E=1.5kV/mm- G”E=0, was decreased exponentially until reaching the equilibrium values
ΔG’=0.140 MPa and ΔG”=0.0660 MPa. This decrease of ΔG’ and ΔG” may be attributed to
Figure 4: Evolution of the current during cross-linking at constant T=80 °C under rheological monitoring of the TiO2-Acac/PDMS ER with pre-alignment under an applied AC amplitude
E=1.5 kV/mm and νac=10 Hz.
prevent the particles from moving during the polymerization stage, thus reducing the electrostatic forces. As shown in Figure 4, the limited amplitude of the applied AC electric field was due to the high conduction of the sample at 80 °C in the first stages of crosslinking where the sample remained still fluid or partially cross-linked preventing the application of high electric field strength. The equilibrium values of ΔG’ and ΔG” were reached at the same time (t~3300 s) as the electric current of the sample tends to a lower limit of 7 µA. After the end of polymerisation, the sample was cooled down from 80 °C to 20 °C, and we measured G’(0) and G”(0) at the constant temperature of 20 °C during several minutes to ensure that both G’(0) and G”(0) reached their stable values (Figure 3 (d)). We noticed that by cooling down the sample to 20 °C, G’(0) and G”(0) were increased from respectively 0.90 MPa and
0.066 MPa to reach 1.50 MPa and 0.70 MPa. After reaching the stable values of G’(0) and G”(0) at 20 °C, the resulting elastomers were characterized by FT-IR spectroscopy to
monitore the cross-linking reaction. the FT-IR spectra of both TiO2-Acac/PDMS and pure
PDMS elastomers showed that the characteristic absorption peaks of the Si-H groups (that are present in the FT-IR spectra of cross-linking pre-polymer) disappear completely confirming the total consummation of the Si-H groups by hydrosilylation and hence, the relatively high density of the obtained elastomer network with G’(0) =1.5 MPa (more details about FT-IR
characterization of samples are available in electronic supplementary information).
0 5 10 15 20 25
0E+0 2E+3 4E+3 6E+3
I (mA)
Table 1: dielectric properties measured at 20 °C PDMS matrix TiO2 Particles
ε
r 2.7 * 120σ (S.m-1)
1 10-13 * 2.50 10-7
* Data from provider.
In subsequent experiments, the viscoelastic properties were measured at a fixed temperature of 20 °C, for different values of DC electric field strength, electric field frequency and oscillatory shear strain magnitude. The dielectric properties ( conductivity and relative permittivity) of both TiO2 particles and crosslinked matrix were given at the same
temperature of 20 °C and are shown in Table 1.
3-b The DC Electric field-dependency of electrorheological response of the TiO2-Acac
/PDMS ERE:
Shear moduli (G’ and G”) were measured under shear strain magnitude, γ=0.1 % and ω=100 rad/s, as a function of the applied DC electric field strength. The experiments
consisted of applying suddenly a DC electric field and maintaining it during 270 s before turning off the field; the change of the moduli was recorded during this field pulse. The effect of the field on moduli under various DC electric field strengths was reported in Figure 5. We observed in parts (a) and (b) an instantaneous increase of G’ and G” when the DC electric field was applied. As shown in Figure 5 (c), where the dash-dotted curve corresponds to a linear behaviour, the relative change in elastic modulus [ΔG’=G'(E)-G'(0)] was nearly
proportional to the applied DC electric field Edc and not to the quadratic law (Edc)2 as it should
be the case for linear electrostatics. J. N. Foulc et al. (1994) attributed this deviation from linear electrostatics to the fact that, under DC voltage, the conductivity of the matrix became field-dependent and was dramatically increased when a certain local field strength Em was
exceeded; then the attraction force Felec between particles and the storage modulus
enhancement G’elec at a small strain magnitude became proportional to Edc.11,13,14 In our case,
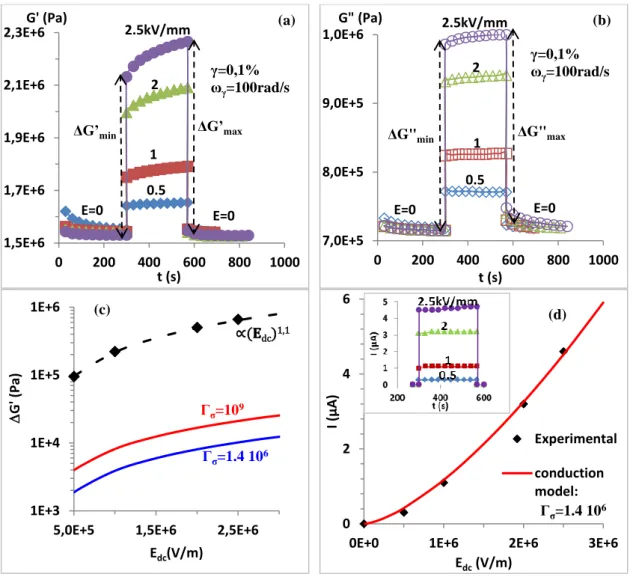
Figure 5: the DC electric field dependence of the storage modulus and loss modulus by applying the switching electric fields of different values; (a) variation of G’ (b) variation of G” (c) the relative change in elastic modulus: diamond: experimental values, blue and red lines: calculated ΔG’ using eq. (4) for conductivity ratios Γσ =1.4 106 and Γσ = 109 respectively,
dash-dotted curve corresponds to ΔG’∝ Edc1.1, (d) variation of the current as a function of the applied electric field; diamond: experimental values, red line: calculated current using equation (3) for Γσ =1.4 106 (inset the variation of the current as a function of application
time of a constant electric field for the different applied Edc).
of attraction force dependence on the electric field was predicted by Gonon et al. (1999) at a
high applied field where the saturation regime was reached and they found that Felec∝ 𝐸𝑑𝑐1.12.11
However Figure 5 (a) shows a difference in the measured ΔG’ between its value just after the application of the field at t=t0 (that we call ΔG’min) and after t=270 s of electric field induction
(that we call ΔG’max); in particular when the DC applied electric field strength became strong.
This evolution during the time of application of the field could not be attributed to the current variation because, as shown in the inset (d) of Figure 5, the current was practically
1,5E+6 1,7E+6 1,9E+6 2,1E+6 2,3E+6 0 200 400 600 800 1000 G' (Pa) t (s) E=0 E=0 2.5kV/mm γ=0,1% ωγ=100rad/s ΔG’min ΔG’max (a) 2 1 0.5 7,0E+5 8,0E+5 9,0E+5 1,0E+6 0 200 400 600 800 1000 G" (Pa) t (s) E=0 E=0 γ=0,1% ωγ=100rad/s ΔG"min ΔG"max (b) 0.5 1 2 2.5kV/mm 1E+3 1E+4 1E+5 1E+6
5,0E+5 1,5E+6 2,5E+6
D G' (Pa) Edc(V/m) Γσ=1.4 106 ∝(𝐄dc)1,1 Γσ=109 (c) 0 2 4 6
0E+0 1E+6 2E+6 3E+6
I (µ A ) Edc(V/m) Experimental conduction model: (d) Γσ=1.4 106
unchanged during this time even at high applied electric field strength. The more likely explanation is the existence of a slow rearrangement of the particles which get closer from each other, then increasing the moduli. Theoretical estimation of the variation of the current and the attraction force as a function of the applied electric field has been given in the literature using the conduction model. 14, 15 In this model the authors considered, for the case where the ratio of the conductivities Γσ=σP/σM >>1, that the electrical conduction in the
interparticle gap can be separated into two zones for nearly touching particles (see Figure 6). The first one, dominated by the conductivity σP of the particles; had a radius δ. The second
one was the outer zone (x> δ) where authors considered that the sphere surfaces are
equipotential and that, at a high applied electric field, the conductivity of the matrix became field-dependent. The radius δ was determined by equating Cp=CM where Cp and CM are
respectively the conductance associated with these two zones: x< δ and x> δ.
Figure 6: Schematic view showing the electrical conduction zones and notations used in the conduction model.
Figure 7: Experimental measurement of the conductivity; circle: σP= σpellet/ Φv (Φv=0.44),
1E-9 1E-8 1E-7 1E-6 1E-5 1E-4 1E-3
1E-2 1E+0 1E+2 1E+4 1E+6
s
(S.
m
-1)
n(Hz)
TiO2 ERE composite TiO2 ERF composite TiO2
triangle: suspension TiO2-Acac/ PDMS ERF Φv=0.20 and diamond: TiO2-Acac/PDMS ERE
Φv=0.21.
In this model the radius δ was practically proportional to 𝐸𝑑𝑐0.5 but decreased with the
conductivity ratio as 𝛿 ∝ (𝑙𝑛𝛤𝜎)−1.
The attraction force between two nearest particles was expressed as:
𝐹𝑒𝑙𝑒𝑐 = 4𝜋𝑎2𝜀𝑀𝐸𝑑𝑐2 (𝑎 𝛿⁄ )
2
(1)
In equation (1), the attraction force increases by decreasing δ and therefore by increasing
Γσ.
Using the conduction model, the dependence between the applied electric field Edc and the current IP passing through a single chain of aligned particles was derived in the case of near touching particles and was expressed as: 15,16
𝐼𝑃 = 4𝜋𝑎𝜎𝑃(2𝑎𝐸𝑑𝑐)2√𝜀𝑀
𝐹𝑒𝑙𝑒𝑐 ⁄ (2)
The total current I passing through all the chains was expressed as:
𝐼 = 𝑁𝐶ℎ𝑎𝑖𝑛𝑠𝐼𝑃 = 3 2𝜙 ( 𝑅 2𝑎) 2 𝐼𝑃 (3)
where ϕ is the particle volume fraction and R is the radius of the plate geometry used on the
rheometer (R=12.5 10-3 m).
Inserting (1) and (2) into equation (3) we found that 𝐼 ∝ 𝐸𝑑𝑐2
√𝐹𝑒𝑙𝑒𝑐 ∝ 𝐸𝑑𝑐
1.5.15,16 Figure 5 (d)
shows a comparison between the experimental and calculated results using equation (3) for the current passing through the sample. The best fit was obtained for a conductivity ratio Γσ= 1.4 106 giving σP=1.4 10-7 S.m-1. The conductivity of TiO2/Acac was deduced from the
measurement of the conductivity σeff of a pellet of TiO2 having a volume fraction Φv=0.44.
We assumed that σP= σeff/ Φv. The frequency dependence of σP as well as the conductivity of
the suspension before and after polymerization is represented in Figure 7. We noticed in particular that, as expected, the conductivity was strongly decreased in the elastomer but that
the frequency dependency is quite similar in the liquid phase and in the elastomer. The experimental conductivity ratio at a low frequency was then equal to Γσ =2.5 106 which is not so far from the one 1.4 106 deduced from the fit of the model, taking into account the uncertainty due to the approximation σP= σeff/ Φv. The relative change in the storage modulus
can be obtained as follow:13
∆𝐺
′=
3 2𝜙
1 𝜋𝑎2 𝐹𝑒𝑙𝑒𝑐 (1+𝛾2)(4)
The shear strain appearing in equation (4) can be neglected in our case. Experimental results of ΔG’ versus the DC applied electric field are compared with those calculated by inserting equation (1) into (4). Figure 5 (c) shows that both experimental and computed results had practically the same dependence on the electric field where ΔG’∝ 𝐸𝑑𝑐1.1. However theoretical estimation of ΔG’ is lower by about two orders of magnitude compared to our
experimental results even if the conductivity ratio Γσ was increased to 109 (Figure 5(c)). This high value of ΔG’ observed on nanoparticles coated with molecules of high dipole moment
could come from the variation of the force at very short separation. In the approach leading to Equation (4) the change of force with the separation distance dF/ds is not considered since only the projection of the constant force near contact on the shear direction is taken into account. The short range force should also include the Van der Waals interaction and likely interactions between dipoles adsorbed on the surface of the particles. This is beyond the scope of this paper but certainly worth being explored.
As shown in Figure 5 (a) or 5 (c), the relative change in storage modulus
(ΔG’=G'(E)-G'(0)) of TiO2-Acac/PDMS ERE exhibited high values when compared with those of other ER Elastomers that have been investigated before (Table 2). For example, for a DC applied electric field of 2 kV/mm, oscillatory shear strain γ=0.1 % and ω=100 rad/s, TiO2
-Acac/PDMS ERE response reached the ΔG’ value up to 0.5 MPa. This high performance of TiO2-Acac/PDMS ERE was attributed to the particular morphology of the synthesized TiO2
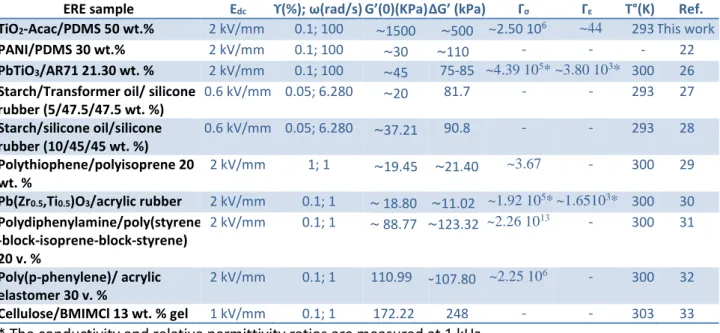
Table 2: Relevant recently published studies on the viscoelastic properties of the ERE under a DC applied electric field.
ERE sample Edc ϒ(%); ω(rad/s) G’(0)(KPa) ΔG’ (kPa) Γσ Γε T°(K) Ref.
TiO2-Acac/PDMS 50 wt.% 2 kV/mm 0.1; 100 ~1500 ~500 ~2.50 106 ~44 293 This work
PANI/PDMS 30 wt.% 2 kV/mm 0.1; 100 ~30 ~110 - - - 22
PbTiO3/AR71 21.30 wt. % 2 kV/mm 0.1; 100 ~45 75-85 ~4.39 105* ~3.80 103* 300 26
Starch/Transformer oil/ silicone rubber (5/47.5/47.5 wt. %) 0.6 kV/mm 0.05; 6.280 ~20 81.7 - - 293 27 Starch/silicone oil/silicone rubber (10/45/45 wt. %) 0.6 kV/mm 0.05; 6.280 ~37.21 90.8 - - 293 28 Polythiophene/polyisoprene 20 wt. % 2 kV/mm 1; 1 ~19.45 ~21.40 ~3.67 - 300 29
Pb(Zr0.5,Ti0.5)O3/acrylic rubber 2 kV/mm 0.1; 1 ~ 18.80 ~11.02 ~1.92 105* ~1.65103* 300 30
Polydiphenylamine/poly(styrene -block-isoprene-block-styrene) 20 v. % 2 kV/mm 0.1; 1 ~ 88.77 ~123.32 ~2.26 1013 - 300 31 Poly(p-phenylene)/ acrylic elastomer 30 v. % 2 kV/mm 0.1; 1 110.99 ~107.80 ~2.25 106 - 300 32 Cellulose/BMIMCl 13 wt. % gel 1 kV/mm 0.1; 1 172.22 248 - - 303 33
* The conductivity and relative permittivity ratios are measured at 1 kHz. - Data are not provided by the authors.
particles (mesoporous aggregates with a high specific area of 295 m2/g formed from nanosized particles) and to the good affinity between TiO2 surface and acetylacetone allowing
the adsorption of 1 molecule per nm2 of Acac dipolar molecules on the TiO2 surface with
practically no Acac remaining free in the insulating matrix.42 If we considered the relative
change of modulus, defined as ΔG’/G’(0)(%)=100(G'(E)-G'(0))/G’(0), its value remained
modest (33% as shown in Table 2 for 2 kV/mm, γ=0.1%) but it was just due to the high intrinsic modulus of the PDMS matrix obtained using the RTV141 reacting pre-polymers with a molar stoichiometry of groups, Si-H /Si-vinyl close to 1. The intrinsic elasticity of the PDMS matrix can be easily decreased by adding an adequate molecular agent (trimethyl (vinyl) silane for instance) to neutralize some of the Si-H groups and to reduce Si-H/Si-Vinyl molar stoichiometry. In this case the elastic modulus of the matrix will decrease whereas the effect of the field will remain constant, so the storage modulus sensitivity (ΔG’/G’(0)) can be strongly modulated depending on the needs of the applications. In our experiment, the relative change ΔG’ of TiO2-Acac/PDMS at its fluid phase (before starting cross-linking) was about
cross-linking reaction this value was decreased to 0.5 MPa at the same applied electric field. If the matrix is softer, then we expect that ΔG’ of TiO2-Acac/PDMS in its elastomeric phase
will increase to be closer to that of TiO2-Acac/PDMS in its fluidic phase.
3-c Electric field frequency dependency of the electrorheological response of TiO2
-Acac/PDMS ERE:
Experiments were carried out to measure G’ and G” of TiO2-Acac/PDMS ERE, under
shear strain magnitude γ=0.1 % and ω=100 rad/s, depending on the electric field frequency. In
Figure 8 we show the increase of modulus obtained by applying an electric field strength E=2
kV/mm for 270 s with different frequencies on the crosslinked TiO2-Acac/PDMS ERE.
Figures 8 (a) and (b) show again a large increase of the storage and loss moduli when the AC
field was turned on at a value of 2 kV/mm and different frequencies nevertheless it was less important than the value obtained in the DC field and it continuously decreased with frequency. The dependence of mechanical properties on electric field frequency can be determined by giving the variation of the attractive force as a function of frequency. In the case of nearly touching particles and Γσ=σP/σM > Γε=εP/εM, the attraction force can be
expressed as:10,13
𝐹𝑒𝑙𝑒𝑐 = 12𝜋𝑎2𝜀𝑀|𝛽∗|2exp(2|𝑅𝑒(𝛽∗)|32)𝐸02
(5)
where
|𝛽
∗|
2and
|𝑅𝑒(𝛽
∗)|
depend on the dielectric properties of the particles and the matrix and vary with frequency as:|𝛽
∗|
2=
(𝜎𝑝−𝜎𝑀)2 𝜔2𝜀02 +(𝜀𝑟 𝑃−𝜀 𝑟 𝑀)2 (𝜎𝑝+2𝜎𝑀)2 𝜔2𝜀02 +(𝜀𝑟 𝑃+2𝜀 𝑟 𝑀)2
(6) and|𝑅𝑒(𝛽
∗)| =
𝜔 2𝜀 02(𝜀𝑟𝑃−𝜀𝑟𝑀)(𝜀𝑟𝑃+2𝜀𝑟𝑀)+(𝜎𝑝−𝜎𝑀)(𝜎𝑝+2𝜎𝑀) 𝜔2𝜀 02(𝜀𝑟𝑃+2𝜀𝑟𝑀) 2 +(𝜎𝑝+2𝜎𝑀)2(7)
Therefore, the relative change in storage modulus can be calculated by inserting the expression of Felec given in equation (5) into equation (4). Using these expressions, the authors
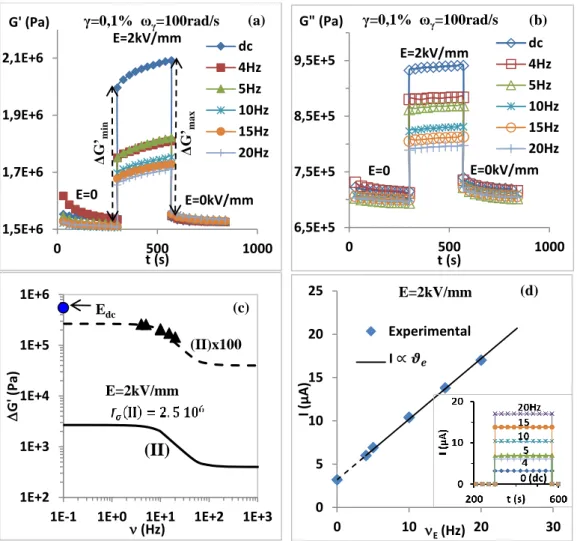
Figure 8: the applied electric field frequency dependence of the storage modulus and loss modulus after switching on the electric field; (a) the time dependance of G’ for different electric field frequencies, (b) the time dependance of G” for different electric field
frequencies, (c) the relative change in the elastic modulus versus the applied electric field frequency (triangles: experimental results; solid line: theory with s=2.5 106; dashed line:
theoretical results multiplied by 102, (d) the corresponding electric field current versus
electric field frequency; inset: the variation of the current during field application for the different electric field frequencies.
found that the attractive force and then the elastic modulus had a higher value at DC and very low frequencies, but became frequency dependent and decreased when electric field frequency was increased beyond a critical value. They demonstrated that the parameters determining this critical frequency limit were the conductivity ratio Γσ and the dielectric
permittivity ratio Γε. They also found that the calculated current was independent of the
electric field frequency when the frequency was smaller than a critical value, but became a linear function of the frequency beyond the critical value. For Γσ= 106 >> Γε=5 the authors
found that the critical value of the frequency was very low and was less than 6.7 10-4 Hz. In
1,5E+6 1,7E+6 1,9E+6 2,1E+6 0 500 1000 G' (Pa) t (s) dc 4Hz 5Hz 10Hz 15Hz 20Hz E=2kV/mm E=0kV/mm E=0 Δ G’ m in Δ G’ m ax γ=0,1% ωγ=100rad/s (a) 6,5E+5 7,5E+5 8,5E+5 9,5E+5 0 500 1000 G" (Pa) t (s) dc 4Hz 5Hz 10Hz 15Hz 20Hz E=0 E=0kV/mm E=2kV/mm γ=0,1% ωγ=100rad/s (b) 1E+2 1E+3 1E+4 1E+5 1E+6
1E-1 1E+0 1E+1 1E+2 1E+3
D G' (Pa) n(Hz) E=2kV/mm Edc (c) (II)x100 (II) 0 5 10 15 20 25 0 10 20 30 I (µ A ) nE(Hz) Experimental (d) I ∝ 𝝑𝒆 E=2kV/mm
our case Γσ~2.5 106 >> Γε~ 44, we observed the decay of G’ and ΔG’ (Figure 8 (a) and (c))
by increasing the frequency and a linear behaviour of the current I versus frequency (Figure 8 (d)). We noticed that the decrease of ΔG’ versus frequency around 10 Hz was well
reproduced by the model as shown in Figure 8 (c), but, as in the DC case, it underestimated ( in the tested electric field frequency range) our experimental results by two orders of magnitude. Because of the limit of our instrument sensitivity at very low frequencies and because of the high conduction of the sample at high frequencies we were unable to produce much more experimental measurement points to investigate the transition regimes that were observed theoretically and therefore testing the validity of the model for simulating our experimental measurements over a wide range of frequencies.
In summary we found that the electrorheological behaviour of TiO2-Acac/PDMS ERE
was governed by the conductivity mismatch; with, for the TiO2-Acac/PDMS ERE, a higher
ER response by applying a DC electric field than an AC one.
3-d Strain dependency of the electrorheological response of the TiO2-Acac/PDMS ERE:
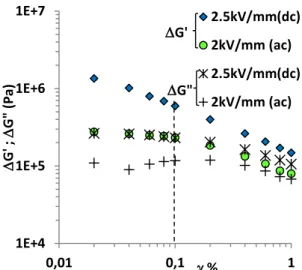
The linear viscoelastic regime of the TiO2-Acac/PDMS ERE was investigated by
measuring ΔG’ and ΔG” as a function of oscillatory shear strain magnitude (γ) at constante shear frequency ωγ=100 rad/s. We carried out measurements without an electric field, with a 2.5 kV/mm DC and 2 kV/mm AC electric field (nE=10 Hz). In Figure 9 we can see that with or without an applied electric field, the TiO2-Acac /PDMS ERE had a small linear regim for γ≤0.1 %, which was independent of DC or AC modes but was dependent on the electric field
strength. This small linear regime could be attributed to the infinitesimal deformation of columns of aligned particles locked in the cross-linked matrix that influenced the viscoelastic properties.22 We noticed also (in Figure 9) that, increasing the electric field strength from 2 to 2.5 kV/mm, the linear regime was disappeared. This evolution of nonlinearity by increasing the electric field strength is likely related to the increase of conductivity: the size of the zone r<δ (cf fig.(6)) extends with the electric field and makes the modulus sensitive to very small
strain.
Figure 9: Strain dependence of ΔG’: (closed diamond) Edc=2.5 kV/mm, (closed circle) Eac=2
kV/mm (n=10 Hz), and ΔG”: (stars) Edc=2.5 kV/mm, (plus symbols) Eac=2 kV/mm (n=10 Hz).
4. Conclusion
ER elastomers have been prepared by suspending TiO2-doped Acac particles in
cross-linkable PDMS oligomers. The particles were aligned by an AC electric field and maintained in chain like structure by an in situ polymerization to form anisotropic network. The change of the shear modulus was monitored during the polymerization process and its decrease was less than 30% indicating that the field induced structure was only slightly disturbed by the polymerization process. Electrorheological properties of TiO2-Acac/PDMS ERE were
investigated experimentally under a DC electric field, AC frequency and shear strain magnitude. The results showed that the relative change in elastic modulus (ΔG’) increases with the DC applied electric field according to a power law ≈E1.10. this deviation from the
quadratic law is due to the non linearity in the conductivity of the matrix that affects the field distribution and the attraction force between particles. However TiO2-Acac/PDMS ERE
showed a decrease of ΔG’ with the increasing AC electric field frequency. This viscoelastic
behaviour, depending on the electric field frequency, was attributed to the high conductivity ratio Γσ=σP/σM compared to the permittivity ratio Γε=εP/εM, between TiO2 semiconducting
particles and PDMS matrix. TiO2-Acac/PDMS ERE exhibited a high value of relative change
1E+4 1E+5 1E+6 1E+7 0,01 0,1 1 D G' ; D G" (Pa) % 2.5kV/mm(dc) 2kV/mm (ac) 2.5kV/mm(dc) 2kV/mm (ac) DG' DG"
in the elastic modulus ΔG’ when compared with those of other ER Elastomers that have been investigated before; ΔG’ reached 500 kPa under 2 kV/mm of a DC applied electric field at a strain γ=0.1 %. Whereas the conductivity behavior can be quite well predicted by the field dependence on the conductivity this was not at all the case for the increase of the shear modulus where the theory predicted a value which was too small by 2 orders of magnitude; a better consideration of short range forces is needed to improve the model. The high ER performance of TiO2-doped Acac as an ERE makes it a promising candidate for applications
by designing an elastomeric blend with controllable matrix hardness.
Supporting information. Electronic supplementary information (ESI) available: The
experimental setup for morphological characterization (SEM, TEM, N2 adsorption/desorption
isotherm, SANS and FT-IR) and dielectric characterization by impedance spectroscopy. See DOI: 10.1039/c4tc02535k on www.rsc.org/MaterialsC website.
Acknowledgement. One of the authors gratefully acknowledges the financial support from
the national center of scientific reshearch (CNRS). We thank Dr Alice Mija for FT-IR measurments.
References
1 M. Behrooz, X. Wang and F. Gordaninejad, Performance of a new magnetorheological
elastomer isolation system, Smart Mater. Struct., 2014, 23, 045014
2 I. Bica , Y. Dan Liu and H. J. Choi, Magnetic field intensity effect on plane electric
capacitor characteristics and viscoelasticity of magnetorheological elastomer, Colloid Polym.
Sci., 2012, 290,1115–1122
3 K.Tanaka, R. Akyama, Electrically Induced Microstructures in Micro and
Nano-Suspensions and Related Physical Properties, Journal of Physics: Conference Series, 2009, 149, 012097
4 R. A. Anderson, Electrostatic forces in an ideal spherical-particle electrorheological fluid,
5 M. Parthasarathy and D. J. Klingenberg, Electrorheology: mechanisms and models,
Materials Science and Engineering, 1996, R. 17, 57-103
6 Howard See, Ryo Sakurai, Tasuku Saito, Shigeo Asai, Masao Sumita, Relationship between
electric current and matrix modulus in electrorheological elastomers, Journal of
Electrostatics, 2001, 50, 303-312
7 Bo Liu and Montgomery T. Shaw, Electrorheology of filled silicone, J. Rheol., 2001, 45(3),
641-657
8 L. C. Davis, Polarization forces and conductivity effects in electrorheological fluids, J. Appl.
Phys., 1992, 72 (4), 1334-1340
9 X. Tang, C. Wu, and H. Conrad, On the conductivity model for the electrorheological
response of dielectric particles with a conducting film, J. Appl. Phys., 1995, 78 (6),4183-4188
10 C. W. Wu, and H. Conrad, Dielectric and conduction effects in ohmic electrorheological
fluids, J. Phys. D: Appl. Phys., 1997, 30, 2634-2642
11 P. Gonon, J.-N. Foulc, P. Atten, and C. Boissy, Particle-particle interactions in
electrorheological fluids based on surface conducting particles, J. Appl. Phys., 1999, 86 (12), 7160-7169
12 Howard See, Advances in modelling the mechanisms and rheology of electrorheological
fluids, Korea-Australia Rheology Journal, 1999, 11 (3), 169-195
13 C. W. Wu, and H. Conrad, A modified conduction model for the electrorheological effect,
J. Phys. D: Appl. Phys., 1996, 29, 3147-3153
14 J.-N. Foulc, P. Atten, and N. Félici, Macroscopic model of interaction between particles in
an electrorheological fluid, J. of Electrostatics, 1994, 33, 103-112
15 P. Atten, C. Boissy and J.-N. Foulc, The role of conduction in electrorheological fluids:
from interaction between particles to structuration of suspensions, J. of Electrostatics, 1997, 40 and 41, 3-12
effect, J. rheol. Phys., 1995, 39 (5), 1059-1073
17 Tohru Shiga, Akane Okada, and Toshio Kurauchi, Electroviscoelastic effect of polymer
blends consisting of silicone elastomer and semiconducting polymer particles,
Macromolecules, 1993, 26, 6958-6963
18 Tohru Shiga, Takashi Ohta, Yoshiharu Hirose, Akane Okada, and Toshio Kurauchi,
Electroviscoelastic effect of polymeric composites consisting of polyelectrolyte particles and polymer gel, J. Mater. Sci., 1993, 28, 1293-1299
19 Shisha Zhu, Xuepeng Qian, Hao He, Quanfu Zhang, Experimental research about the
application of ER Elastomer in the shock absorber, Advanced Materials Research, 2013, vol. 641-642, 371-376
20 Changyong Cao, and Xuianhe Zhao, Tunable stiffness of electrorheological elastomers by
designing mesostructures, Appl. Phys. Lett., 2013, 103, 041901
21 Weihua Li and Xianzhou Zhang, Research and applications of MR Elastomers, Recent
Patents on Mechanical Engineering, 2008, 1, 161-166
22 Byung D. Chin, Myung-Suk Chun, H.Henning Winter, Modulus-switching viscoelasticity
of electrorheological networks, Rheol Acta, 2009, 48, 177-189
23 Yasuhiro Kakinuma, Tojiro Aoyama, Hidenobu Anzai, Application of the
electro-rheological gel to fixture devices for micro milling process, Journal of Advanced Mechanical
Design, Systems, and Manufacturing, 2007, Vol. 1, No. 3, 387-398
24 James E. Martin and Robert A. Anderson, Electrostriction in field-structured composites:
Basis for a fast artificial muscle?, J. Chem. Phys., 1999, 111 (9), 4273-4280
25 Kexiang Wei, Quan Bai, Guang Meng, and Lin Ye, Vibration characteristics of
electrorheological elastomer sandwich beams, Smart Mater. Struct., 2011, 20, 055012
26 N. Tangboriboon, A. Sirivat and S. Wongkasemjit, Electrorheology and characterization of
acrylic rubber and lead titanate composite materials, Appl. Organometal. Chem., 2008, 22, 262-269
27 L. Hao, C. Ding, X. Zhao, A novel electric elastomer based on starch/transformer oil
drop/silicone rubber hybrid, J. Appl. Polym. Sci., 2011, 119, 2991-2995
28 L. Hao, Z. Shi and X. Zhao, mechanical behaviour of starch/silicone oil/silicone rubber
hybrid electric elastomer, Reactive & functional polymers, 2009, 69, 165-169
29 T. Puvanatvattana et Al., Electric field induced stress moduli in polythiophene/polyisoprene
elastomer blends, Reactive & functional polymers, 2006, 66, 1575-1588
30 N. Tangboriboon et Al., Electrorheological properties of novel piezoelectric lead zirconate
titanate Pb(Zr0.5,Ti0.5)O3-acrylic rubber composites, Materials Science and engineering C,
2009, 29, 1913-1918
31 K. Thongsak et al.,Electroactive
polydiphenylamine/poly(styrene-block-isoprene-block-styrene) (SIS) blends: Effects of particle concentration and electric field, Materials Science
and engineering C, 2011, 31, 206-214
32 R. Kunanuruksapong, A. Sirivat, Poly(p-phenylene) and acrylic elastomer blends for
electroactive application, Materials Science and engineering A, 2007, 454-455, 453-460
33 W. Kunchornsup, A. Sirivat, Physically cross-linked cellulosic gel via
1-butyl-3-methelimidazolium chloride ionic liquid and its electromechanical responses, Sensors and
actuators A, 2012, 175, 155-164
34 Seungae Lee, Chang-Min Yoon, Jin-Yong Hong and Jyongsik Jang, Enhanced
electrorheological performance of a graphene oxide-wrapped silica rod with a high aspect ratio, J. Mater. Chem. C, 2014, 2, 6010-6016
35 Sang Deuk Kim, Wen ling Zhang and Hyoung Jin Choi, Pickering emulsion-fabricated
polystyrene-graphene oxide microspheres and their electrorheology, J. Mater. Chem. C, 2014, 2, 7541-7546
36 Jinghua Wu, Ting Jin, Fenghua Liu, Jianjun Guo, Ping Cui, Yuchuan Cheng and Gaojie
Xu, Preeparation of rod-like calcium titanyl oxalate with enhanced electrorheological activity and their morphological effect, J. Mater. Chem. C, 2014, 2, 5629-5635
37 Y. Dong, Y. Liu, J. Yin and X. Zhao, Preparation and enhanced electro-responsive
characteristic of graphene/layered double-hydroxide composite dielectric nanoplates, J.
Mater. Chem. C, 2014, 2, 10386-10394
38 Jian B. Yin and Xiao P. Zhao, Preparation and Electrorheological Activity of Mesoporous
Rare-Earth-Doped TiO2,Chem. Mater., 2002, 14 (11), 4633–4640
39 Xiao P. Zhao and Jian B. Yin, Preparation and Electrorheological Characteristics of
Rare-Earth-Doped TiO2 Suspensions, Chem. Mater., 2002, 14 (5), 2258–2263
40 Weijia Wen, Xianxiang Huang, Shihe Yang, Kunquan Lu & Ping Sheng, The giant
electrorheological effect in suspensions of nanoparticles, Nature Materials, 2003, 2, 727 - 730
41 Ying Dan Liu and Hyoung Jin Choi, Electrorheological fluids: smart soft matter and
characteristics,Soft Matter, 2012, 8, 11961-11978
42 A. Kossi, J. Persello and B. Cabane, Acetylacetone stimulus effect on electrorheological
properties of TiO2 aggregated nanoparticles, J. Mater. Sci., 2014, 49, 811-818 43 H. Tang et al., Giant electrorheological effects of aluminium-doped TiO
2 nanoparticles, Particuology, 2010, 8, 442-446