HAL Id: hal-01693508
https://hal.archives-ouvertes.fr/hal-01693508
Submitted on 30 Jan 2018
HAL is a multi-disciplinary open access
archive for the deposit and dissemination of
sci-entific research documents, whether they are
pub-lished or not. The documents may come from
teaching and research institutions in France or
abroad, or from public or private research centers.
L’archive ouverte pluridisciplinaire HAL, est
destinée au dépôt et à la diffusion de documents
scientifiques de niveau recherche, publiés ou non,
émanant des établissements d’enseignement et de
recherche français ou étrangers, des laboratoires
publics ou privés.
Empirical Activity: Assessing the Perceptual Properties
of the Size Visual Variation in UML Sequence Diagram
Yosser El Ahmar, Xavier Le Pallec, Sébastien Gerard
To cite this version:
Yosser El Ahmar, Xavier Le Pallec, Sébastien Gerard. Empirical Activity: Assessing the Perceptual
Properties of the Size Visual Variation in UML Sequence Diagram. HuFaMo workshop, 2016, Saint
malo, France. �hal-01693508�
Empirical Activity: Assessing the Perceptual Properties of
the Size Visual Variation in UML Sequence Diagram
Yosser El Ahmar
CEA, LIST, Laboratory of Model Driven Engineering forEmbedded Systems P.C. 174, Gif-sur-Yvette,
91191, France
yosser.ELAHMAR@cea.fr
Xavier Le Pallec
University of Lille, CRIStALLab UMR 9189 59650 Villeneuve d’Ascq, France
xavier.le-pallec@univ-lille1.fr
Sébastien Gérard
CEA, LIST, Laboratory of Model Driven Engineering forEmbedded Systems P.C. 174, Gif-sur-Yvette,
91191, France
Sebastien.GERARD@cea.fr
ABSTRACT
Recent empirical studies about UML showed that software practitioners often use it to communicate. When they use diagram(s) during a meeting with clients/users or during an informal discussion with their architect, they may want to highlight some elements to synchronise the visual support to their discourse. To that end, they are free to use color, size, brightness, grain and/or orientation. The mentioned free-dom is due to the lack of formal specifications of their use in the UML standard and refers to what is called the secondary notation, by the Cognitive dimensions framework. Accord-ing to the Semiology of Graphics (SoG), one of the main references in cartography, each mean of visual annotation is characterized by its perceptual properties.
Being under modeler’s control, the 5 means of visual an-notations can differently be applied to UML graphic com-ponents: to the border, text, background and to the re-lated other graphic nodes. In that context, the goal of this research is to study the effective implementations, which maintain the perceptual properties of, especially, the size visual variation. This latter has been chosen because it is considered as the ”strongest” among the other visual means, having all the perceptual properties.
The present proposal consists of a quantitative methodol-ogy using an experiment as strategy of inquiry. The partic-ipants will be the ˜ 20 attendees of the HuFaMo workshop. They must be experts on modeling and they know UML. The treatment is the reading and the visual extraction of infor-mation from a set of UML sequence diagrams, provided via a web application. The dependent variables we study are the responses and the response times of participants, that will be validated based on the SoG principles.
CCS Concepts
•Software Engineering → UML modeling; •Software visualization → Semiology of Graphics;
Keywords
UML, Secondary notation, Size visual variable, Empirical activity.
1.
INTRODUCTION
The Unified Modeling Language (UML) is the visual lan-guage for specifying, constructing and documenting software
intensive systems. Recent empirical studies about UML in practice [14] [4] showed that UML artefacts are mostly used for communications. Stakeholders of these communications might be familiar with UML (e.g. members of the technical team) or not (e.g. clients) [9]. In such situations, modelers may need to highlight information that they deem relevant for the discussion (e.g. the main class in a class diagram; model, view and controller elements; a modeler’s own sub-system; distribution of tasks between technical members; project progression). This is to synchronize the visual sup-port with their discourse. In that context, while the UML specification describes exhaustively its primary notation, its semantics, it lacks highlighting abilities for such contextual information. The secondary notation, defined by the Cog-nitive Dimensions framework [11], may deal with such con-cerns. It refers to the free use and change of the possible means of visual annotations: size, brightness, grain, color and orientation. The previously mentioned five means of visual annotations are relatively rapidly perceived because the reader’s eye can detect their variation without moving the visual brush. According to the Semiology of Graph-ics (SoG), one of the main references in cartography, each mean of visual annotation is characterized by its perceptual properties. In fact, it can be selective: allows readers to dis-tinguish groupings (e.g. all green marks), ordered: allows readers to perceptually order marks (e.g. from dark to light or from light to dark but never in another order) and/or quantitative: allows readers to visually quantify ratio be-tween marks (e.g. three times larger).
In UML, as the means of visual annotations are under modeler’s control, there exist different ways to vary their val-ues into a UML graphic component: graphic node or graphic path.
The combinatorial explosion of the possible implemen-tations is due to four reasons. First, UML graphic nodes mostly include: a border, a text and a background. Second, some UML graphic nodes are composed of multiple shapes (e.g. a lifeline is composed of 3 components: a rectangle, a dashed line and sometimes an execution specification). Then, graphic nodes might be related to other nodes via graphic paths, forming the diagram. Finally, a UML graphic component might contain/be contained in other graphic nodes (e.g. a fragment in a sequence diagram can contain one or more messages).
It may seem obvious that some implementations of varia-tions are more effective in highlighting elements than others.
But what we can gain in effectiveness might be anecdotal. To be sure that there exist (or not) implementations that are more effective, we have to dress an exhaustive list of implementations and test them. This means that we have to rigorously decompose all UML graphic components and see, for each sub-element, if the value of a mean of visual annotation can vary and how. Consequently, the purpose of this research is to study the effective implementations, which allow viewers to fully benefit from the performances of a mean of visual annotation. This is a purpose for which the number of related works is small. As the field of study is wide, we propose to focus here only on the variation of the size mean of visual annotation and on one type of di-agram : UML sequence didi-agram. The size visual variation has been selected in this study because it is the only mean of visual annotation, belonging to the UML secondary no-tation, which has all the perceptual properties. In addition, we propose to target, especially, the UML sequence diagram because it belongs to the three first mostly used UML dia-grams in practice.
For each type of graphic component, being composed of multiple shapes or a component itself, container of other graphic nodes or contained in other graphic nodes, this re-search aims at finding patterns of effective implementations of the size visual variation. In this study, we assume that the latter patterns depend on the information to be high-lighted. It can concern only one graphic component (e.g. a lifeline) or more than one (e.g. two or more than two life-lines). For the first assumption, the size variation will surely highlight the concerned graphic component [5]. But, we aim at finding the effective implementations, which allow viewers to relatively rapidly perceive all significant details about the concerned graphic component. For the second assumption, the size visual mean is selective, ordered and quantitative [5]. In this case, we want to find the effective implementations which maintains valid the selective, ordered and quantitative perceptive attitudes of its variation.
To that end, we want to study the impact of the possible implementations on the perceptual properties of the size vi-sual mean. The latter impact will be controlled by the size of the UML diagram containing the implementation. It can be small, medium or large. The studied impact will also be controlled by the layout of the diagram. We will especially focus on the horizontal and vertical distance between the related graphic components.
This paper presents a proposal of a quantitative method-ology using an experiment as strategy of inquiry. The par-ticipants will be the ˜ 20 attendees of the HuFaMo work-shop. They must be experts on modeling and they know UML. The treatment is the reading and the visual extrac-tion of informaextrac-tion from a set of provided UML sequence diagrams, via a web application. The outcome variables we study are responses and response times of participants, that will be validated based on the SoG principles.
2.
EXPERIMENT DEFINITION
This section reports on the delimitation of the study, the research questions that it attempts to answer and its hy-pothesis.
2.1
Delimitation of the study
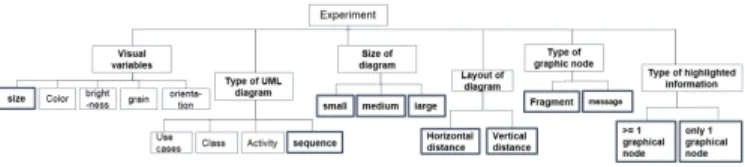
Figure 1 resumes the delimitation of the experiment. Fol-lowing are justifications for each choice.
Figure 1: Delimitation of the study.
Size, brightness, grain, color and orientation represent powerful means to highlight information, to make it rela-tively rapidly perceived in a third dimension [5]. Each mean of visual annotation is characterized by its perceptual prop-erties. The SoG distinguishes three perceptive attitudes that viewers can take in front of a mean of visual annotation. Selectivity: the reader can perceive groupings (e.g. all red colors, all marks having the same size).
Order: The human eye can perceive order (e.g. from dark to light, from the smallest mark to the biggest).
Quantity: The viewer can perceive ratio between marks (e.g. this mark is 5 times bigger than another).
The size is the only mean of visual annotation allowing the three perceptive attitudes. To benefit from its interesting performances, we made the choice to begin by studying its effective implementation in UML. We chose to be limited to three categories of size. This number can be extended to more than three categories in a future empirical study. We argue that exceeding three categories of size in UML diagrams will overload the diagram, especially if it contains a lot of graphic components (i.e. large diagram). In addition, we note that sizes of graphic nodes depend on the contained text (eg. the width of a UML class varies depending on the length of its name, its attributes or its methods). Therefore, we will assume that all graphic nodes, in a diagram, have the same initial size (i.e. the size of the biggest node, containing the largest text).
According to [9][8], sequence diagram is ranked among the three first frequently used UML diagrams in practice. It is mostly used for clarifying understanding among technical members of the project team [8]. In such informal meet-ings, highlighting information might be promising to ease the communication [10]. In addition, contrarily to class di-agrams, we note a lack of works in the literature, studying the effective visualization of sequence diagrams. Those are the main reasons behind the specific choice to begin by the UML sequence diagram.
In practice, the graphic nodes will be connected to each others, forming the diagram. The resulting diagram can be small, medium or large. We chose to cover all the 3 alternatives in the present study.
The graphic notation of the sequence diagram is described by 11 graphic nodes and 4 graphic paths [1](p. 594-596). As we chose to exhaustively study the UML sequence diagram., we will take into account all of them in the present experi-ment.
We observe that information to highlight might concern only one graphic component (e.g. one message, one lifeline, one coregion). It can also concern more than one graphic component (e.g. multiple lifelines, multiple coregions, mul-tiple execution specifications). The present study will cover both alternatives.
components can vary in two directions, horizontally and ver-tically for instance. We will experiment with both possibil-ities.
2.2
Research questions
After delimiting the study, we will define the research questions for the resulting scope. In fact, we observe that, for a single graphic component of the sequence diagram, there are different possible implementations of the size mean of visual annotation. This is due to the following facts.
UML graphic nodes are mostly made of a border, a back-ground and a text. Changing only its area can be seen as ob-vious, but we want to explore the effectiveness of varying the size of its border and text also. Moreover, some graphic com-ponents include multiple shapes. Lifelines include a rectan-gle and a dashed line. LostMessages and FoundsMessages include an edge and a black point at the extremity. Varying the size of such graphic components might consist of chang-ing the size of all its elementary shapes or some of them. We wonder about the most effective implementation.
In addition, some graphic nodes can be embedded in other graphic nodes. An execution specification, a coregion, Dura-tionConstraint, a DurationObservation and a StateInvariant are always embedded to a lifeline. Continuations might be embedded to more than one lifeline. Changing their size can affect the size of graphic nodes to which they are embedded. We want to infer the most effective implementation.
Furthermore, graphic components are semantically linked to each others. Lifelines are linked via graphic paths, graphic paths having source and destination graphic nodes. High-lighting them with the size variation might mean highlight-ing its semantically related graphic components also.
Finally, some graphic nodes may contain other graphic components. A Frame, an InteractionUse, a CombinedFrag-ment and a coregion can contain executionSpecifications, messages. They may also contain each others. Applying the the size to such graphic nodes might concern the contained other graphic nodes and vice versa.
As a result, the following research questions arise. RQ1: What are the effective implementations of the size visual variation to all types of graphic components of the UML sequence diagram (i.e. container, contained, embed-ded to a graphic node, complex graphic node (composed of multiple shapes))?
Where effectiveness can be measured by the capability of each implementation to preserve all the perceptual proper-ties of the size, allowing viewers to relatively rapidly detect the accurate information that they are searching for. RQ2: How the effectiveness of each implementation can be controlled by the type of information to highlight (i.e. concerns only one graphic component, more than one com-ponent).
RQ3: How the effectiveness of each implementation can be controlled by the size of the diagram containing the imple-mentation and its layout.
2.3
Hypothesis formulation
2.3.1
Variables
The experiment has 4 independent variables and two de-pendent variables.
Independent variables
Implementation I (alternatives: Effective Implementation I, Other Implementation I’).
Size of the sequence diagram S (alternatives: small, medium, large).
Its layout L (alternatives: Horizontal distance HD, Verti-cal distance VD).
Type of information to highlight TI (alternatives: con-cerns only one graphic component TI1, more than one graphic component TIn).
Dependent variables
Responses of participants R (alternatives: true, false, com-plete, incomplete).
Response time of participants T.
2.3.2
Hypothesis
Table 1: Hypothesis Dependent
variables
Null hypothesis Alternative hypothe-sis Response time T ∀ (S, TI, L); H0: T(I) > T(I’) ∀(S, TI, L) H1: T(I) < T(I’)
Response R ∀ (S, TI, L); H0: T(I) > T(I’)
∀ (S, TI, L) H1: T(I) < T(I’)
The hypothesis for assessing the effectiveness of the I size variations with the independent variables are given in table 1. The alternative hypothesis H states that the proposed effective implementations take less time to let participants give the right and complete answer to a given question. The experimented effective implementation I is proposed for each possible combination of (S, TI, L). Figures in appendices il-lustrate the different implementations that we deem effective and the experiment aims at validating. They also illustrate an example of a question that concern one graphic path (a message) with different implementations.
3.
EXPERIMENT DESIGN
3.1
Population, sample, and participants
The sampling method used in this study is the conve-nience sampling [6]. In fact, the target population of this study is the community of UML users: practitioners, re-searchers, students. The HuFaMo attendees are a naturally formed and might be a representative sample of the target population. They include students, researchers, UML prac-titioners and maybe some tool vendors. They are a part of the MoDELS community, interested in modeling and/or contributors on MDE. We assume that we will have ˜ 20 participants, considered as experts on UML.
3.2
Data collection and materials
A web application will be used in the present experiment. This is to be aware of the complexity of modeling tools (i.e. not all participants are familiar with the same mod-eling tool). Moreover, installing the same modmod-eling tool to all participants will be time consuming, especially in the workshop (same timeslot as a presentation). If accepted, the web application will be developed between the accep-tance notification and the workshop date. It will be coded by the first author and tested before its use in the experi-ment. The web application will first ask participants about
their gender, level of experience and if they have visual defi-ciency(ies). Then, it will display a question on a white page. After its reading and comprehension, the participant is able to click a button to switch to the next page. A sequence diagram, visually annotated with an implementation of the size will appear, along with its corresponding question on the bottom. Parallelly, the application will trigger a time counter. When the response to the question is found by the participant, he can click a button to navigate to another white page (without the sequence diagram), where he will be able to enter his response. At the same time, the appli-cation will stop the chronometer and save the time spent to answer. It will also save the corresponding response entered by the participant. Sequence diagrams that will be used in the experiment will be extracted from a models repository [12] [2]. Visual annotations using implementations of the size variations and questions will be manually proposed.
3.2.1
Method
One day before the experiment, the HuFaMo participants will receive an e-mail requesting them to bring their laptops. The first author will ensure the availability of an internet connection during the experiment day. The experiment will begin by an introduction phase and a training session re-lated to the experimental task. The first author will present the web application that will be used in the experiment, for which details are mentioned in the previous subsection. Then, the link of the web application will be sent to the Hu-FaMo attendees via the workshop mailing list. The second step consists of the experiment’s task. This latter will indi-vidually be performed by each participant. The main treat-ment will consist on the reading and the visual extraction of information from a visually annotated sequence diagram. The estimated time for the whole experiment is 30 minutes.
3.3
Data analysis procedures
In the analysis procedure, we will report on the number of the HuFaMo attendees who didn’t participate to the study. We also plan to give a descriptive analysis of data for all independent and dependent variables of the study. At the end of the experiment, we want to analyse the relationship between the independent and dependent variables. This is to find patterns of effective implementations, depending on a combination of (S, TI, L). For each combination of the three independent variables, we will determine the ef-fective implementation I, which has a minimum T and a complete and true values of R. Therefore, we select the cor-relation/regression statistic tests.
4.
ANTICIPATED ETHICAL ISSUES IN THE
STUDY
This section will report the internal and external threats to validity.
4.1
Internal validity
The first internal threat to validity is the possible gain of maturity by the participants during the study. That may happen because of the unicity of the studied type of UML diagram: sequence diagrams. As well as the uniqueness of the studied visual variation. Therefore, we will ensure that diagrams will be randomly proposed so that questions con-cerning the same graphic component will not be successive.
In addition, as mentioned before, participants might have some visual deficiencies. This additional input will be men-tioned before beginning the task, so that we can take into account its influence on the results. We also note that each participant will have a different screen with different char-acteristics. We will ensure that at least the same value of luminosity is set up and that the same web navigator is used to open the web application. Finally, one of the outcomes of the study is the response time of participants. It is au-tomatically saved when the participant finds the response by clicking a button. Late clicking the button will bias the results. We will stress on the importance of this step to par-ticipants in the introduction phase. We will also try to add a voice recorder, so that participants can speak out loud when finding the response. Then, we will have to find mechanisms to manage the simultaneous voices of participants, placed in the same setting.
4.2
External validity
The HuFaMo participants are not only experts on model-ing but also interested in Human Factors in Modelmodel-ing. So, they may know about the scope of this research, especially the perceptual properties of the means of visual annotations, which can bias the study. To limit the latter threat to valid-ity, we will not inform them about the research questions of the study nor its hypotheses. Moreover, the participants are not in a natural setting, using their own modeling tool and moving naturally to their UML sequence diagrams. As a re-sult, we will perform further additional empirical study (e.g a case study in a natural setting) in order to be sure that the obtained result can be generalized to the whole population.
5.
LITERATURE REVIEW
The free use of additional means of visual annotations in software engineering has been recognized as theoretically advantageous. This is via the secondary notation by the cognitive dimensions framework [11]. A few empirical stud-ies aiming at assessing its benefits in UML visual notation have been conducted. However, if they considered the need of empirical validations, they focus only on two axis: lay-outs and colors. The other means of visual annotations (i.e. size, brightness, grain and orientation) have not been yet discussed, despite of their great performances on highlight-ing information, known in cartography [5] and psychology [13] [18].
Concerning layouts, there exist several empirical studies aim-ing at findaim-ing effective layouts in UML diagrams. [19] [16] [15] use experiments to assess effective layouts for diagram comprehensions, user preferences, program understanding, etc. [20] uses eye tracking in an experiment involving 12 par-ticipants to identify the impact of layout, color and stereo-types on comprehension of UML diagram. Most of the men-tioned researches [16] [15] [20] focus on UML class diagram. [17] focusses further on UML activity diagram and use case diagram. While the sequence diagram belongs to the three most used UML artefacts in practice, we note few works on it [7] [3].
6.
REFERENCES
[1] Object management group. http://www.omg.org/. [2] UML repository. www.models-db.com.
[3] S. Abrahao, C. Gravino, E. Insfran, G. Scanniello, and G. Tortora. Assessing the effectiveness of sequence diagrams in the comprehension of functional requirements: Results from a family of five experiments. IEEE Transactions on Software Engineering, 39(3):327–342, 2013.
[4] S. Baltes and S. Diehl. Sketches and diagrams in practice. In Proceedings of the 22Nd ACM SIGSOFT International Symposium on Foundations of Software Engineering, FSE 2014, pages 530–541, New York, NY, USA, 2014. ACM.
[5] J. Bertin. Semiology of graphics: diagrams, networks, maps. 1983.
[6] J. W. Creswell. Research design: Qualitative, quantitative, and mixed methods approaches. Sage publications, 2013.
[7] J. A. Cruz-Lemus, M. Genero, D. Caivano,
S. Abrah˜ao, E. Insfr´an, and J. A. Cars´ı. Assessing the influence of stereotypes on the comprehension of UML sequence diagrams: A family of experiments.
Information and Software Technology, 53(12):1391–1403, 2011.
[8] B. Dobing and J. Parsons. How UML is used. Commun. ACM, 49(5):109–113, May 2006. [9] W. J. Dzidek, E. Arisholm, and L. C. Briand. A
realistic empirical evaluation of the costs and benefits of UML in software maintenance. Software
Engineering, IEEE Transactions on, 34(3):407–432, 2008.
[10] Y. El Ahmar, S. G´erard, C. Dumoulin, and
X. Le Pallec. Enhancing the communication value of UML models with graphical layers. In Model Driven Engineering Languages and Systems (MODELS), 2015 ACM/IEEE 18th International Conference on, pages 64–69. IEEE, 2015.
[11] T. R. G. Green and M. Petre. Usability analysis of visual programming environments: a cognitive dimensions framework. Journal of Visual Languages & Computing, 7(2):131–174, 1996.
[12] B. Karasneh and M. R. Chaudron. Online img2UML repository: An online repository for UML models. In EESSMOD@ MoDELS, pages 61–66, 2013.
[13] K. Koffka. Principles of Gestalt psychology, volume 44. Routledge, 2013.
[14] M. Petre. UML in practice. In Proceedings of the 2013 International Conference on Software Engineering, ICSE ’13, pages 722–731, Piscataway, NJ, USA, 2013. IEEE Press.
[15] H. C. Purchase, L. Colpoys, D. Carrington, and M. McGill. UML class diagrams: an empirical study of comprehension. In Software Visualization, pages 149–178. Springer, 2003.
[16] B. Sharif and J. I. Maletic. An empirical study on the comprehension of stereotyped UML class diagram layouts. In Program Comprehension, 2009. ICPC’09. IEEE 17th International Conference on, pages 268–272. IEEE, 2009.
[17] H. St¨orrle, N. Baltsen, H. Christoffersen, and A. Maier. On the impact of diagram layout: How are models actually read? In International Conference on Model Driven Engineering Languages and Systems (MoDELS) 2014, pages 31–35, 2014.
[18] A. Treisman. Preattentive processing in vision. Computer vision, graphics, and image processing, 31(2):156–177, 1985.
[19] K. Wong and D. Sun. On evaluating the layout of UML diagrams for program comprehension. Software Quality Journal, 14(3):233–259, 2006.
[20] S. Yusuf, H. Kagdi, and J. I. Maletic. Assessing the comprehension of UML class diagrams via eye tracking. In 15th IEEE International Conference on Program Comprehension (ICPC’07), pages 113–122. IEEE, 2007.
APPENDIX
Considering all independent variables, 12 sequence diagrams are required for each implementation of the size variation. We argue that at least two diagrams are needed for each implementation. Therefore, for all 14 graphic components of the UML sequence diagram, at least 336 diagrams are required for this study.
A.
EFFECTIVE IMPLEMENTATIONS AND
AN EXAMPLE OF A QUESTION WITH
DIFFERENT IMPLEMENTATIONS
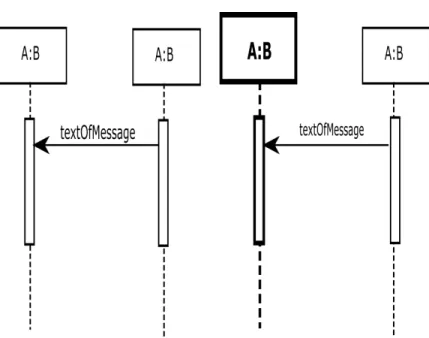
Figure 2: Effective implementation of a ”lifeline” I, (TI=TI1, T=S)
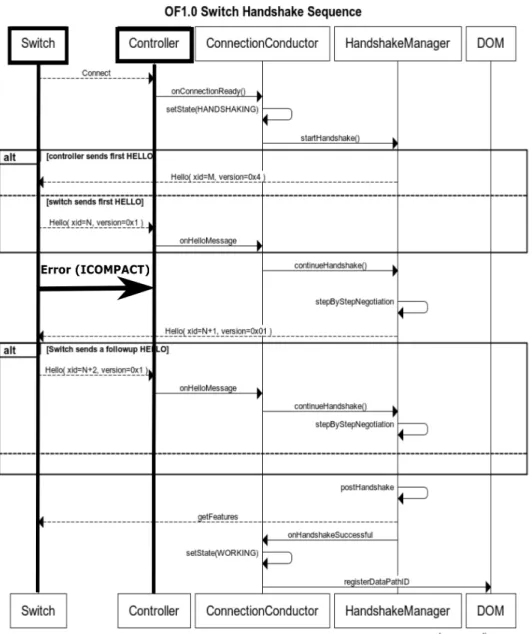
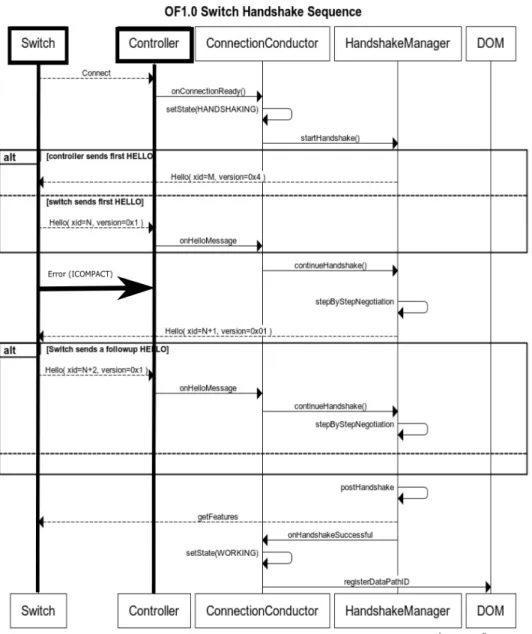
Figure 5: Response to the question: What happens if the controller sends first hello? with the implementation I
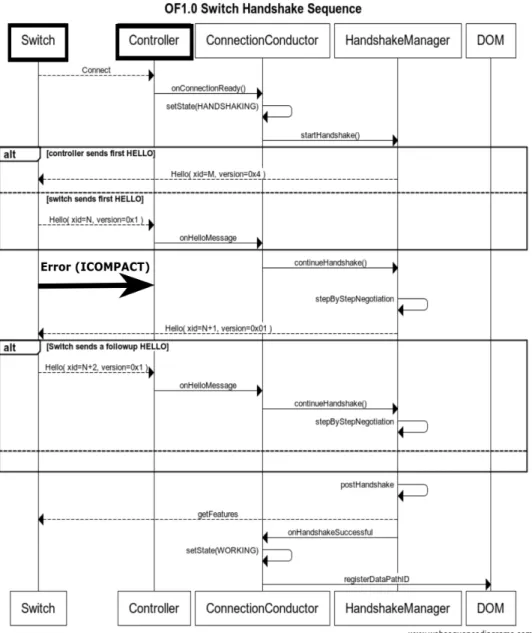
Figure 6: Response to the question: What happens if the controller sends first hello? with an implementation I’
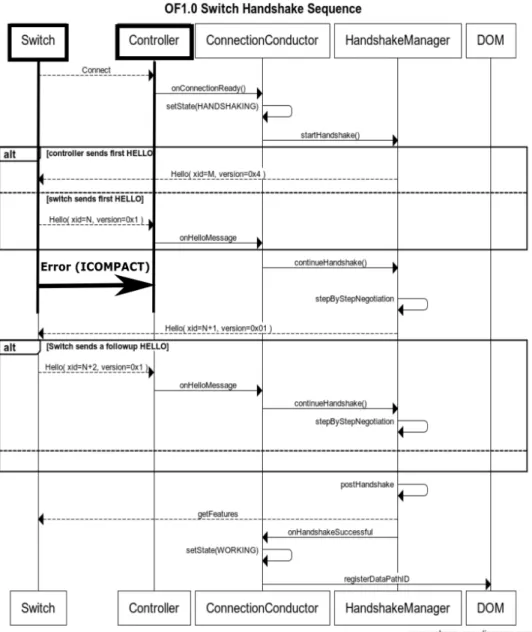
Figure 7: Response to the question: What happens if the controller sends first hello? with an implementation I’
Figure 8: Response to the question: What happens if the controller sends first hello? with an implementation I’