U
SE OF
K
YOTO CREDITS BY
E
UROPEAN INDUSTRIAL INSTALLATIONS
:
FROM AN
EFFICIENT MARKET TO A BURST BUBBLE
Nicolas Stephan
1, Valentin Bellassen
2and Emilie Alberola
3European industrial installations surrendered over 1 billion Kyoto credits (675 million CERs and 383 million ERUs) in Phase II (2008-2012) of the European Union Emission Trading Scheme (EU ETS). Kyoto credits have always been less expensive than EUAs, initially as a result of asymmetric information, and then due to the fact that credit surrender was capped at around 1,650 MtCO2e at the European level. Lower credit prices enabled installations to reduce their compliance costs. The savings achieved by installations subject to the EU ETS are estimated between €4 billion and €20 billion over the period between 2008 and 2012.
The use of CERs and ERUs within the EU ETS grew exponentially. It was also effective from an economic standpoint in several ways:
1. a vast majority of the installations – 70%, which represent 90% of the emissions covered – made use of the option to return credits;
2. the use of credits was primarily limited by the supply: once delivered, credits made their way from the producer's account to the end-customer's account very quickly, on average in seven months;
3. the use of the credits did not depend on whether the installation had an allowance deficit or surplus: even installations that had a surplus, which did not “need” credits for compliance, surrendered them to minimise their compliance costs;
4. the development of market infrastructure played an important role in matching credit buyers and sellers by ensuring that a price emerged, and improving the transparency of information.
Demand from the EU ETS dried up as companies had already contracted all the credits allowed by their maximum surrender limit since mid-2012. This limit was set in 2004 and was only marginally increased in 2009 via the review of the EU ETS Directive for Phase III: the limit rose from around 1,400 MtCO2e over the period 2008 - 2012 to an authorised amount of 1,650 MtCO2e for the period 2008 to 2020, i.e. an additional amount of only 250 million over the eight years between 2013 and 2020.
The bubble burst in the second half of 2012 after the market became convinced that European demand had dried up; this conviction was reinforced by the flooding of Russian and Ukrainian ERUs as both States boosted issuance of ERUs before the end of the first commitment period of the Kyoto Protocol. The thousands of industrial companies buying CERs and ERUs were therefore replaced by just a few States, which made the international credit market much less liquid.
In fact, the qualitative restrictions introduced in phase 3 of the EU ETS, which were supposed to rebalance the market, became obsolete before they even entered into effect on the 1st of May 2013. On this point, we note that the European Union is currently the only region in the world that does not obligate its operators to use a minimum amount of domestic offsets.
1
Nicolas Stephan is a research associate in the “Carbon & Energy markets” Unit.
nicolas.stephan@cdcclimat.com /+33 1 58 50 77 72.
2
Valentin Bellassen is Head of the “Carbon offsets, Agriculture and Forestry” Unit.
3
A
CKNOWLEDGEMENTS
The authors would like to thank all those who helped them draft this report, and especially
Boubekeur Ouaglal, Erik Haites (Margaree Consultants Inc), Raphael Trotignon (Climate
Economics Chair), Christine Faure-Fédigan (GDF Suez), Vincent Mage (Lafarge), Sanjay
Patnaik (George Washington University), Rob Elsworth (Sandbag), for their careful review
and constructive comments.
The authors are also grateful to the whole CDC Climat Research team for the stimulating
work environment and the useful review that it provided.
Publication director: Benoît Leguet - ISSN 2101-4663
To receive regular updates on our publications, send your contact information to research@cdcclimat.com Press contact: Maria Scolan - + 33 1 58 50 32 48 - maria.scolan@cdcclimat.com
This publication is fully-funded by Caisse des Dépôts, a public institution. CDC Climat does not contribute to the financing of this research.
Caisse des Dépôts is not liable under any circumstances for the content of this publication. This publication is not a financial analysis as defined by current regulations.
The dissemination of this document does not amount to (i) the provision of investment or financial advice of any kind, (ii) or of an investment or financial service, (iii) or to an investment or financial proposal of any kind.
There are specific risks linked to the markets and assets treated in this document. Persons to whom this document is directed are advised to request appropriate advice (including financial, legal, and/or tax advice) before making any decision to invest in said markets.
The research presented in this publication was carried out by CDC Climat Research on an independent basis. Organisational measures implemented at CDC Climat have strengthened the operational and financial independence of the research department. The opinions expressed in this publication are therefore those of the employees of CDC Climat Research alone, and are independent of CDC Climat’s other departments, and its subsidiaries.
The findings of this research are in no way binding upon, nor do they reflect, the decisions taken by CDC Climat’s operational teams, or by its subsidiaries. CDC Climat is not a provider of investment or financial services.
TABLE OF CONTENTS
I
NTRODUCTION4
I.
T
HEEU
ETS
AND DEMAND FOR CARBON CREDITS:
A COMBUSTION ENGINE5
A. The rules for using Kyoto credits in Phases II and III: chronicle of a speculative bubble 5 B. The credit supply momentum: a bubble inflated by the market's short-sightedness 8
C. The credit demand momentum: the burst of the bubble 9
II.
A
N EFFICIENT SURRENDER PROCESS THAT WAS WIDE-
RANGING AND QUICK,
BUT DOMINATED BY LARGE INSTALLATIONS12
A. Thanks to exchanges and brokers acting as intermediaries, the surrender process waslimited only by the amount of credits issued, i.e. by the available supply 12 B. Multiple compliance strategies in the context of an economic downturn 16 C. The 1 billion Kyoto credits surrendered enabled European industrial installations
to save between €4 billion and €20 billion in Phase 2 18
D. Industrial companies are directly subsidising their competitors 20
C
ONCLUSION21
A
PPENDICES AND METHODOLOGIES22
B
IBLIOGRAPHY22
INTRODUCTION
The principle of the European Union Emission Trading Scheme (EU ETS) is to limit the emissions of the industrial companies it governs. This limit is embodied by the amount of allowances distributed by the European Commission. The 11,000 installations covered by the EU ETS, which account for around 50% of the European Union (EU)'s CO2 emissions and 40 % of its total greenhouse gas (GHG) emissions, must surrender every year, a total allowances equivalent to their GHG emissions. Industrial companies that have emitted an amount of GHG that exceeds the allowances allocated to them must therefore buy allowances from other companies subject to the EU ETS and which have succeeded in bringing their emissions below their allocation. Although allowances are by far the main carbon asset traded on the market, the consolidated version of the 2009 Directive also allows the use of a second kind of asset, namely carbon credits (European Commission, 2009) (Figure 1).
Figure 1 – Compliance options for an EU ETS installation
Carbon credits are emission reductions achieved outside the scope subject to the EU ETS. To ensure that these reductions are genuine, therefore embodied in quality credits, the Directive only authorises credits certified by the United Nations, i.e. Certified Emission Reductions (CERs) generated by the Clean Development Mechanism (CDM) and Emission Reduction Units (ERUs) generated by the Joint Implementation (JI) mechanism.
The offsetting principle of both project mechanisms is similar. The main difference is the fact that JI operates under an emissions cap set by the Kyoto Protocol, i.e. no change in the overall cap, whereas the CDM creates new credits, i.e. increase of the overall cap (Figure 1). JI may involve emission reductions outside the EU, e.g. in Russia and Ukraine or European emission reductions that are not governed by the EU ETS, like those from the transport and agricultural sectors. Meanwhile, carbon offset projects located in developing countries are certified under the CDM. Major emerging countries like China, India, South Korea and Brazil are the main host countries to these projects.
Several research reports have examined the operators’ behaviour on their surrendering of international credits. Based on the very early data provided on the surrendering of credits, Fages et al. (2009) show that installations with an allowance surplus were the most active, even though we might have expected that they would not make use of credits. They also observe that the surrendering of Kyoto credits differs significantly between countries and that it is dominated by the combustion sector. The main reason for these differences are the different weights of sectors and countries in the allowance allocation process. However, the dominant position of the power generators is also explained by the very significant amounts that they invested in the primary CER market; these amounts were invested directly into projects before credits were delivered.
Sandbag, the environmental NGO, provides a ranking of the companies that have benefited most from an allowance surplus and reviews the surrendering of international credits by operators covered by the EU ETS over the period between 2008 and 2011. The NGO observed a net predominance of surrendered credits came from industrial projects showing that European steel production installations are subsidising their international competitors via the carbon income linked to purchasing CERs generated by CDM project developments (Elsworth et al., 2012). Moreover, Sandbag observed that some sectors and/or installations that benefit from a large amount of surplus allowances, still legally use international credits to reduce their compliance costs, thereby creating a lack of incentive to achieve emission reductions within the scope of the EU ETS. The NGO recommends increasing the ambition of the EU ETS in order to ensure offsets are supplemental to domestic actions. Sandbag also recommends prohibiting the use of credits generated by the controversial HFC-23 elimination projects, and encouraging investment in projects hosted by least developed countries (Elsworth and Worthington, 2010).
Meanwhile, Trotignon’s (2011) assessment of the credit surrendering process between 2008 and 2009 is broadly positive; he underlines that it enabled the incentives to reduce emissions provided by the EU ETS to be extended beyond Europe's borders, while reducing participants' compliance costs, and disseminating low-carbon technologies in the host countries for these projects. Trotignon identified five possible limiting factors to using offsets in the EU ETS: (1) the rules governing each EU Member States makes the demand at the country level concentrated and the timing potential offset use very unpredictable. (2) Transaction costs: smaller installers tend to surrender offsets less frequently but more intensively than larger installations; (3) Awareness and openness to market-based instruments: some operators' lack of knowledge of the actual existence of Kyoto credits, or their unwillingness to use them (4) Uncertainty about CER supply and demand in other markets and (5) uncertainty about ERU supply. The aim of this Climate Study is to assess the credit surrendering process throughout Phase II (2008-2012), primarily through confirming or invalidating the aforementioned results, which were obtained during the early years of the mechanism's operation. The first section of this report is dedicated to the rules that govern the credit surrendering process in the EU ETS, and to the resulting trends in credit supply and demand. The second section assesses the behaviour of industrial installations covered by the EU ETS in surrendering credits, which emerges from the surrendering data, and on the basis of a few case studies.
I. THE EU ETS AND DEMAND FOR CARBON CREDITS: A COMBUSTION ENGINE
A.
The rules for using Kyoto credits in Phases II and III: chronicle of a speculative bubble
a) The 2004 rules set the maximum demand for Kyoto credits at around 1,400 MtCO2eq between 2008 and 2012
The number of credits that could be returned by an installation governed by the EU ETS was limited to a percentage of the amount of that installation's free allocation. This percentage varied between countries, ranging from a minimum of 0% (Estonia4) to a maximum of 20% (Germany, Spain, Norway, and Latvia) with an average of 13.6% of Phase II allocations. In total, this corresponded to a maximum import of international credits of 1,400 MtCO2eq between 2008 and 2012 (Appendix 1).
This limit was set for the five years of Phase II; however, Member States could define annual import limits in their National Allocation Plans (NAPs). This was the case in Hungary, Latvia and Lithuania, where installations could therefore neither bank nor borrow their annual entitlement to surrender credits to the following year. These slight national differences in the rules governing the surrendering of credits slightly disrupted our research; however they remain anecdotal enough to be ignored in the remainder of this Climate Report.
4
Up to the year 2010, no offsets were permitted in Estonia. For 2011 and 2012, 10 % are allowed (based on NAP notified by Estonia on 5 September 2011)
The aviation sector, which has been subject to the EU ETS since 2012, could also surrender international credits up to a limit of 15% of its verified emissions in 2012, i.e. via the use of a maximum of 12.5 million tonnes in 2012 (European Commission, 2009).
The EU ETS' overall maximum demand for Kyoto credits therefore amounted to 1,412.5 MtCO2eq between 2008 and 2012.
b) The 2009 rules reduced the maximum credit use authorised between 2013 and 2020 by a factor of 9
The Climate & Energy Package adopted by the European Union in late 2009 reviewed the directives relating to the EU ETS, and established the framework for using Kyoto credits in Phase III (2013-2020). The general supplementary principle, which was introduced by the Marrakesh Accords in 2001, i.e. using credits only “to supplement” domestic emission reduction efforts, was set out in detail: “These measures guarantee that general use of the allocated credits will not exceed 50% of the reductions achieved by existing sectors at the European Community level compared with the 2005 levels within the framework of the community scheme for the period between 2008 and 2020, and 50% of the reductions at the Community level compared with the 2005 level for new sectors and the aviation sector from the date when they were included in the Community scheme up until 2020” (European Commission, 2009).
This same directive sets out the minimum amounts of these import limits, depending on the installation: In the case of operators who were already subject to the EU ETS between 2008 and 2012:
- the unused balance of the entitlement to surrender credits compared with the limits set for the period between 2008 and 2012 may be used over the period between 2013 and 2020;
- in the event that the national limit was lower than 11% of the Phase II allocation, it will be increased to reach 11% compared to the 2008-2012 allocation to guarantee a fair balance between installations in the various Member States;
In the case of installations subject to the EU ETS for the first time in 2013, the authorisation to surrender international credits was set at 4.5% of their verified emissions over the period between 2013 and 2020;
In the case of airlines, the authorisation to surrender international credits was set at 1.5 % of their verified emissions over the period between 2013 and 2020.
These rules ultimately resulted in a slight increase in the limit on imports of international carbon credits, which is estimated at around 250 MtCO2eq (Delbosc et al., 2011). When measured against the duration of Phase III, the authorisation to return additional credits works out at around 25 MtCO2e per year, i.e. 9 times less than what had been decided for Phase II in 2004.
These 2009 Directive minimum limits on surrendering credits set are currently turned into maximum limits via the so-called RICE or Regulation on International Credit Entitlements draft regulations (European Commission, 2013)5, which was presented by the European Commission on 5th of June 2013. Approved by Member States on July, 10th, 2013 and submitted to the European Parliament and Council during a 3-month scrutiny period. The European Commission adopted the Regulation on November 8th and Member States now have one month to notify the Commission of the international credit entitlement for each of their operator, in accordance with the limits set in the Regulation.
This Regulation set out the method that will enable each operator to calculate the total amount of international credits that it may use for compliance purposes, and therefore amend Article 11a (8) of Directive 2003/87/EC. It also sets out the rules for using credits for the installations that are extending their capacity and entitles them to additional free allowances. These installations will be able to use the most favourable of the following three options: (1) the limit authorised in the Phase II NAP, or (2) 11% of the free Phase II allocations, or (3) 4.5% of the verified Phase III emissions.
5
The surrendering of Kyoto credits amounting to 4.5% of the verified emissions over the period between 2013 and 2020 raises the issue of surrendering credits in practice, since the final limit will only be known once all the Phase III emissions are known, i.e. in early 2021. This uncertainty will lead the incumbent companies to spread their credit consumption over the full length of the phase to some extent.
The abrupt reduction in the maximum limit for surrendering credits resulted in the emergence of a speculative bubble, as the level of credit supply was dimensioned based on the annual demand that could be anticipated from the 2004 decision.
The consequences of the 2009 decision and of the failure of the Copenhagen COP to achieve a new international climate agreement in the same year were not immediately taken on board by project developers, who would find it hard to pull out once they have embarked on a CDM certification process in any event. As a result, the end of the 2000s saw the build-up of a credit supply that was excessive in relation to the demand, which had been drastically downgraded by the 2009 Directive (see Sub-Section C).
c) The impact of qualitative restrictions: redirecting the demand for credits towards some sectors and countries
The European Commission wants to reform project mechanisms to improve their environmental integrity and their effectiveness, via the increased use of standardised baselines, for instance, and by developing new approaches to assess projects' additionality. The Commission wants to rebalance the number of CDM projects between the major emerging countries and the least-developed countries (DG Climate Action, 2013).
Article 11 bis (9) of the consolidated EU ETS Directive specifies that “as from 1 January 2013, the use of specific credits resulting from certain kinds of projects may be subject to restrictive measures”. The representatives of the Member States part of the EU Climate Change Committee approved the draft regulations presented by the European Commission prohibiting the use of credits generated by projects relating to the elimination of two industrial gases, trifluoromethane (HFC-23) and nitrous oxide (N2O) from the production of adipic acid from 1 May 2013. There were four reasons for prohibiting these types of credits: concerns regarding environmental integrity (potential perverse incentives and windfall profits due to very high profitability), barriers to the development of sector-based mechanisms, obstacles to the implementation of the Montréal Protocol, and unequal geographical distribution (DG Climate Action, 2010).
To counter the flooding of Russian and Ukrainian ERUs in late 2012 (see Section B), the Climate Change Committee also prohibited the use of ERUs from third-party (non-EU) countries that were delivered later than 2012, except for the countries that would subscribe to a new emission reduction target (QELRO – Quantified Emission Limitation and Reduction Objective) for the second Period of the Kyoto Protocol (2013-2020). In any event, new ERUs may only be delivered when Assigned Amount Units (AAUs) – national allowances representing these QELROs – are established, i.e. as from mid-2016 at the earliest. This restriction is currently facing a technical obstacle, as the date when some ERUs were delivered is not automatically traceable. The Commission has indicated that these ERUs are likely to be classified as “pending admission” (DG Climate Action, 2013b). This status will be amended when the Commission receives the data from International Transaction Log (ITL), which enables the date at which these ERUs were delivered to be identified.
These are not the first qualitative restrictions in effect in the EU ETS: credits generated by projects relating to nuclear facilities, and those generated by forestry projects and projects to capture carbon in agricultural land (LULUCF) were prohibited by the 2004 Linking Directive. Moreover, credits generated by hydro-electric projects with an installed capacity of over 20 MW can only be accepted under certain conditions (Article 11b (6) of Directive 2004/101/EC).
As no international agreement was reached at the end of 2009, nor any European agreement with third parties, paragraphs 4 and 5 of Article 11(a) have also resulted in a ban on using CER and ERU credits generated by projects registered after 2012, unless they originate from either one of the 48 least-developed countries (LDCs) or a country with which the EU has signed a bilateral agreement. This means
that one of the determining factors for taking the eligibility of a credit into account in Phase III is the date when the project was registered. Once an international agreement has been signed, only the CERs and ERUs of countries that have ratified the agreement will be authorised.
This means that the following credits can be used by EU ETS installations in Phase III:
1. CERs from projects registered before 31 December 2012 and which are not associated with the elimination of HFC-23 or of N2O emitted during the production of adipic acid. The corresponding emission reductions can take place during the first or second Kyoto protocol commitment periods. In practice, the credits must be converted into Phase III allowances, by submitting a request to the appropriate authority. This conversion request will only be possible until 31 March 2015 for credits that correspond to emission reductions that took place before 31 December 2012;
2. CERs from LDCs – provided that they are not associated with the elimination of HFC-23 or of N2O emitted during the production of adipic acid – regardless of the date when the corresponding project was registered;
3. CERs and ERUs from third-party countries that have signed bilateral agreements with the European Union. These agreements could include a guarantee that carbon credits are delivered on the basis of baseline assumptions at least as demanding as the benchmarks selected for free allocations in the EU ETS (Zapfel, 2012). The Annex B countries are likely to be subject to the criterion on ERUs (see above), namely ratification by the country of an emission reduction commitment for the second period of the Kyoto Protocol (2013-2020).
4. Domestic credits, provided that Article 24a of the 2009 Directive is translated into an operational regulation which was not yet the case as of November 2013.
The registration date considered for Programmes of Activities (PoAs) is the date of the programme. Therefore, if new programme activities are added after 2012 to a PoA registered before 2012, the corresponding CERs or ERUs can be used. The European Commission is nonetheless indicating that it may suggest amending this interpretation if it leads to LDCs being significantly disadvantaged.
B.
The credit supply momentum: a bubble inflated by the market's short-sightedness
The CDM has experienced rapid growth over the past 10 years, and has rapidly become the largest carbon offset mechanism in the world (Shishlov and Bellassen, 2012). The CER supply has followed the economic theory that leads operators to make reductions where it is least expensive. Initially, investments primarily focused on reducing industrial gases like HFCs and N2O, which are highly profitable (Figure. 2). In fact, as the warming potential of HFC-23 is 12,000 times higher than that of CO2 (IPCC, 2001), its elimination costs only €0.15 per tCO2eq in developing countries (DuPont estimate, 2011
6
). As most of the plants that emit these gases were covered within a short timeframe, project backers subsequently turned to renewable energy, and more recently to energy efficiency (Shishlov and Bellassen, 2012).
Like all investors, investors in CER credits were concentrated in countries that offered an attractive investment environment – governance, political stability etc. –– and high emissions, which meant a high potential for emission reductions. In fact, around 90% of the supply was concentrated in four countries, namely China (61.7%), India (13.5%), South Korea (8.3%) and Brazil (6.4%). Sub-Saharan Africa accounted for less than 1% of the supply. A total of 6,755 of the 8,798 CDM projects (registered and at validation) have been registered, while 2,294 have delivered CERs. The aggregate volume of CERs issued amounted to 1.3 billion tCO2eq as of 1 May 2013.
JI took longer to develop because ERUs could not be issued until the start of the Kyoto Protocol commitment period in 2008. Another factor was Russia's scepticism regarding the mechanism (Shishlov, 2011). Given the excess AAUs awarded to certain Eastern European countries, the supply of JI credits
6
Presentation by Pascal Faidy, a DuPont representative, during the stakeholder consultation process at the European Parliament on 13 January 2011 entitled “Shortcomings undermining the integrity of the CDM”.
naturally concentrated in Ukraine and Russia, which jointly amount for 90% of the ERU supply. The breakdown of credits between sectors reflects both countries' industrial structure: industrial gases accounted for only 6.4% of issued ERU credits from both states. A total of 597 projects have been registered out of the 782 JI projects in existence. The aggregate volume of issued ERUs amounted to 674 million tCO2eq as of 1 May 2013.
Source: UNEP Risoe, CDM & JI pipeline (May 2013)
At the CDM and JI level, 34% of the overall supply of Kyoto credits was provided by industrial gases (HFC-23 and N2O) elimination projects, followed by hydropower projects (19%), and fossil fuel switch (12%) and fugitive gas (9%) projects. The credits generated by wind power projects accounted for only 3% of the total supply over the period between 2008 and 2012 (Figure 2). At the host country level, Russia and Ukraine therefore became the 2nd and 3rd largest suppliers of international credits behind China (Figure 3).
C.
The credit demand momentum: the burst of the bubble
a) European operators account for most of the global demand for Kyoto credits
In theory, demand for Kyoto credits stems from a wide variety of sources, including States that have made commitments under the Kyoto Protocol, regional or national carbon pricing schemes that authorise the surrender of Kyoto credits, and voluntary offsetting by companies not subject to the EU ETS. In practice, however, the demand between 2008 and 2012 was primarily driven by European operators (EU ETS & Member States). The National Inventory Submissions in Standard Electronic Format (SEF) disclosed on the UNFCCC website7 show that European operators, companies and States, including Switzerland, held around 80% of the international credits that were the subject of a transfer as at 1 January 2013, i.e. 1.3 GtCO2e.
We have adjusted the inventory file data to refine the supply and demand balance so that it corresponds with the month of May: point at which EU ETS installations became compliant. According to the data disclosed by the European Commission, the EU ETS installations surrendered 1,059 MtCO2eq of CERs and ERUs over the period between 2008 and 2012, i.e. 53% of the total primary credit supply. According to our latest estimates, the amount of credits that was not captured by global demand based on these new assumptions amounted to around 560 MtCO2e as at 1 May 2013 (Figure 4; see the methodology in Appendix 1).
7
http://unfccc.int/national_reports/annex_i_ghg_inventories/national_inventories_submissions/items/7383.php
Figure 2 – Breakdown of CER and ERU supply over the period 2008 to 2012 (as a percentage of the total of ≈≈≈≈ 2 GtCO2eq)
Figure 3 – Geographical breakdown of CER and ERU supply over the period 2008 to 2012 (as a percentage of the total of ≈≈≈≈ 2 GtCO2eq)
On the 1st of May 2013, around 360 million tonnes of CER and ERU credits were held by other sources of demand, represented by the countries included in Annex B of the Kyoto Protocol, to comply with their Kyoto commitment, as well as by installations in Japan (11%), and Australia and New Zealand (2%), which are subject to their respective carbon pricing schemes. According to our calculations, the 360 MtCO2eq estimate breaks down as follows: 23% of the credits relate to demand from governments, and 77% to demand from private entities.
We obtain results that are similar to the estimates of the World Bank, which works from by governments statements and estimates that these other sources of credit demand amounted to a total of 327 MtCO2e over the period between 2008 and 2012 (World Bank, 2012).
Figure 4 – Breakdown of the demand for Kyoto credits between private entities, and EU and non-EU States as at 1 May
Source: CDC Climat Research, based on National Inventory data files (UNFCCC)
b) Decoupling of EUA and CER prices once supply exceeded demand
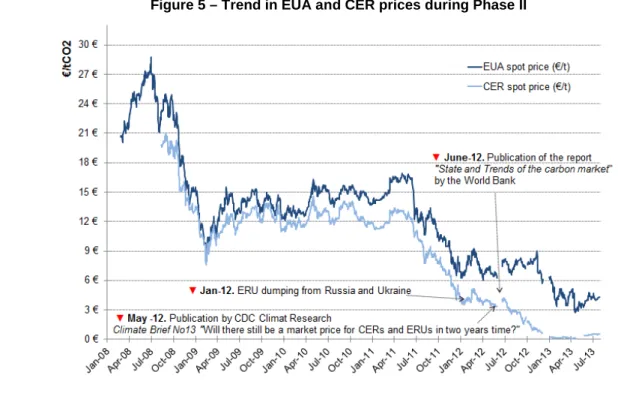
There was a strong correlation between the price of European allowances and international credits (CERs and ERUs) between 2008 and 2012, due to the fact that they were fungible where the compliance of operators governed by the European carbon market was concerned (Figure 5). We note that it is the EUA that determines the price of the credits, and not the reverse: price fluctuations are explained by institutional and economic factors that affected the European allowance market (Mansanet-Bataller et al., 2010) and not by factors that potentially affected the supply of credits, like the decisions of the CDM Executive Board8.
The price differential between both assets has historically varied between €0.15 and €4, with a CER price that was lower than the EUA price, which encouraged installations to buy credits rather than EUAs, to save on the price difference between both carbon assets. The only rational explanation for this discount is the “limited” fungibility of the credits, as a result of the maximum surrender threshold. In practice, the discount was mainly due to imperfect and asymmetrical information: European installations were not always informed about the option to surrender credits.
Demand from the EU ETS dried up, as installations had already contracted for the purchase of credits equivalent to their maximum surrender level as from mid-2012. Indeed, although the 1.6 billion tCO2eq limit has yet to be surrendered, most companies already have enough credits in their accounts or as
8
A notable exception was the €8 per tCO2eq floor for the price of credits observed during the 2009 financial downturn, which
reflected the market’s confidence in the floor price imposed by China on CERs generated in that country at the time. This confidence had disappeared when the price of credits finally collapsed in 2012.
advanced purchases. As we had anticipated in our Climate Brief entitled “Will there be a market price for CERs and ERUs in two years' time?” (Bellassen and al. 2012) the imbalance between international credit supply and demand resulted in a decoupling of the price of EUAs and international credits in the second half of 2012, which marked the bursting of the bubble.
The bubble visibly burst as from the point where this assessment, which was conveyed in the World Bank's annual report (World Bank, 2012), convinced the market that the European demand had dried up. This conviction was probably strengthened by the dumping of the Russian and Ukrainian ERUs, which reflected the similar stance adopted by both these states: between March 2012 and March 2013, both countries delivered just over 500 million ERUs, i.e. around four times the amount of ERUs delivered between March 2009 and March 2012.
As buyers of credits, the thousands of industrial companies that used CERs were therefore replaced by a few States, which made the international credit market much less liquid. Only significant new sources of demand resulting from an increase in the commitments of developed countries, or the appearance of demand from emerging countries, could enable the price of these assets to recover, which is not foreseeable in the medium term.
Figure 5 – Trend in EUA and CER prices during Phase II
Source: CDC Climat Research, and ICE Futures Europe
c) After the crisis, the rules became obsolete
The rules for using international credits underwent significant changes on 1 May 2013 (see Section A). The primary aim of these changes was to redirect the benefits of carbon offsetting to sectors – via the ban on using credits generated by HFC-23 and N2O projects – and to the countries – preferably LDCs and countries that have signed bilateral agreements – that needed them most. As the EU ETS' demand for international credits had been saturated even before these changes entered into effect, we can already state that the underlying political goal will not be achieved. Qualitative restrictions became ineffective before they even entered into effect. Likewise, we may wonder about one of the options for reforming the structure of the EU ETS suggested by the European Commission in order to balance supply and demand for both allowances and credits (European Commission, 2012). In fact, option “E”, which effectively consisted in “[further] limits on access to international credits” will have no effect. It is now too late: the market is flooded and demand is saturated.
II. AN EFFICIENT SURRENDER PROCESS THAT WAS WIDE-RANGING AND QUICK, BUT DOMINATED BY LARGE INSTALLATIONS
A.
Thanks to exchanges and brokers acting as intermediaries, the surrender process was limited
only by the amount of credits issued, i.e. by the available supply
a) A fast transfer of credits between producers and consumers
The use of CERs and ERUs within the EU ETS grew exponentially (Figure 7). In fact, it closely followed the trend in supply: the only limit on surrendering credits between 2008 and 2012 was the amount of credits delivered. The rapid transfer of credits from the time they were delivered to their use by companies governed by the EU ETS reflects the efficiency of the process. In fact, we estimate that it took seven months9 on average for a credit to reach the account of its end-user (see Appendix 2). The transfer times shortened over the course of Phase II, falling from nine months in 2009 to five months in 2013 (Figure 6).
Figure 6 – Estimated timeframe for the transfer of a credit between a producer and a consumer
Source: CDC Climat Research based on the SEF files (CCNUCC)
b) Increasing financialisation in an environment where the participants became more concentrated
The credit market featured increasing use of financial instruments, such as options, swaps and forward contracts, based on delivery of credits. The total volume of financial instruments traded between 2008 and 2012 was the equivalent of 6.3 GtCO2e, four times the number of Kyoto credits actually issued during the period (1.5 GtCO2e) (Figure 7)
The increasing financialisation of the market since 2008 contributed to improving the efficiency of the credit market in two main areas: (1) it made it easier to match credit producers and consumers, and (2) helped a transparent market price to emerge. Two indicators reflect this financialisation, namely the increasing role of trading platforms and financial intermediaries (brokers) and the development of financial products.
9
Since 2005, several exchanges have specialised in trading carbon assets, including InterContinental Exchange Futures Europe (United Kingdom), European Energy Exchange (Germany), Climex (Netherlands), Nordpool (Scandinavia), Bratislava Commodity Exchange (Slovakia), Athens Stock Exchange (Greece), Green Exchange (United States), Gestore Mercati Energetici-GME (Italy), SendeCO2 (Spain) and BlueNext (France), which shut down its operation in December 2012. Furthermore, financial intermediaries, brokers and clearing houses, including TFS, Spectron, ICAP, Tullet Prebon clustered around traditional trading platforms. All of the above played an active role in trading financial contracts linked to the various carbon assets (EUAs, CERs, ERUs, and EUAAs for aviation), primarily through forward purchase contracts (futures and forward contracts), options, and swaps. We note that the United Kingdom platform accounted for around 90% of the trading volume.
Figure 7 – Annual trend in the surrendering of Kyoto credits by the EU ETS compared with trading volumes for Kyoto credits on the secondary markets (MtCO2eq)
Source: CDC Climat Research, based on data from CITL, BlueNext, European Energy Exchange, ICE Futures Europe, Climex, Nasdaq OMX, LCH Clearnet, and on “State and trend of the Carbon Market 2009” (World Bank).
The 2008 economic downturn, which was compounded by the sovereign debt crisis in 2012 and by the fall in international asset prices (see p.10) resulted in the increased importance of two major trends (Stephan and Alberola, 2010), namely
1. The restructuring of participants the primary market, which led to a decreasing number of financial investors against the backdrop of concentration. Since 2005, a large number of major banks
and financial intermediaries, especially Goldman Sachs, JP Morgan, and Merrill Lynch had expanded their carbon finance business by acquiring project developers (Box 1). This trend later turned around as banks intensified measures to reduce their portfolios and staffing levels during the course of 2012. In May 2012, Citigroup, Barclays, Bank of America Merrill Lynch, Jefferies Bache, Mercuria, Natixis, Société Générale, Tullet Prebon, Ecosecurities, and Trading Emissions Plc. all announced that they were reducing the size of their carbon trading desks.
The trend towards concentration also involved carbon credit trading platforms, primarily through the takeover of Nordpool, the Scandinavian platform, by NASDAQ OMX, but also through the takeover of the US Green Exchange platform by Nymex, and that of the European Continental Exchange (ECX) platform by ICE Futures Europe.
2. New carbon credit purchasing strategies. Since 2008, some investors have set their priority on the constitution of carbon credit portfolios through purchases of already generated credits, rather than financing new CDM or JI projects, a process that can take three years between the start-up of the project and delivery of the credits. The economic downturn also prompted several companies to sell portfolios of carbon credits that were already registered with the UNFCCC to raise cash quickly.
c) Financialisation resulted in the mixing of credits
Another indicator of the market's financialisation is the mixing of credits. We might have imagined that industrial companies would show a preference for some types of credits. This was absolutely not the case: industrial company's characteristic features (geographical location, business sector, etc.) are rarely influenced the kind of credits that it surrenders. Generally speaking, the type of credits surrendered did not display any major differences compared with that described for delivered credits in Section I.B: major emerging countries, i.e. China, Russia and Ukraine, were the dominant places of geographical origin, while industrial credits were dominant in terms of business sector. The main exception was the surrender of over proportionally large share of HFC and N2O credits over the period between 2008 and 2012 compared to the available supply (Figure 10).
We can illustrate this mixing of credits through two examples:
1- The installation's business sector had no influence on the type of credits surrendered. For instance, power generators did not return more credits generated by renewable energy projects, or fewer grey credits than other companies subject to the EU ETS. Likewise, cement and steel producers did not return more credits generated by their sectors than other companies subject to the EU ETS.
2- The installation's location only had a slight influence on the origin of the surrendered ERUs. For example, 0.76 million French ERUs were surrendered in France. This amount represents 1% of all the credits surrendered by French installations, which is higher than French ERUs' share of the global credit supply, i.e. 0.3%, but nonetheless not very high. In fact, 87% of the 5.9 million French ERUs were returned by installations in 18 other European countries. The same goes for other large European countries that generate ERUs, like Germany, Poland, and Romania. The main exception was Lithuania, as it surrendered a substantial proportion of credits generated by its close neighbours. In fact, ERUs as a percentage of the total amount of credits (CERs and ERUs) surrendered by installations amounted to 24% for the Ukraine, 18% for Poland and 4% for Lithuania, even though the supply of Lithuanian ERUs only accounted for 1% of the global credit supply.
Box 1 – Review of the wave of acquisitions between 2009 and 2012
Takeover of Climate Care by JP Morgan Chase in 2008.
Takeover of Ecosecurities by JP Morgan Chase for £123 million in 2009.
Takeover of Onecarbon by Orbéo, a joint venture between Société Générale and Rhodia Energy, an industrial company.
Takeover of Tricorona by Barclays Capital for £98 million in 2010. Takeover of Carbon Resource Management by Vitol in 2010. Takeover of MGM (Morgan Stanley) by Mercuria in 2010. Takeover of Climate Change Capital by Bunge in 2012.
Rhodia and Solvay merge to become Solvay Energy Services in 2012.
There is not necessarily any link between the credits generated and the credits surrendered even within companies that combine generation activities, i.e. the development or direct financing of projects that generate credits, and activities that are subject to the EU ETS. This demonstrates the total disconnection between both businesses within the company, as was specifically the case for Lafarge (Box 2).
d) A surrendering process that responds to abrupt changes in regulations
Since the 1st of May 2013, industrial companies governed by the EU ETS can no longer surrender credits generated by projects relating to the elimination of two industrial gases, namely trifluoromethane (HFC-23) and nitrous oxide (N2O), for compliance purposes. This restriction was approved at the EU Climate Change Committee on 21 January 2011 after several months of discussions (see p. 7).
This abrupt amendment of the regulations resulted in a change in operators' behaviour, which meant that they returned a relatively greater amount of credits that would be non-eligible in Phase III than that provided by the primary credit supply. In fact, although these industrial credits only accounted for 34% of the aggregate supply of Kyoto credits (CERs and ERUs) over the period between 2008 and 2012, a sector-based breakdown of the credits surrendered by EU ETS operators shows that the industrial credits used accounted for 60% of the overall surrendered credit portfolio over the same period (Figure 8).
Source: CDC Climat Research, based on CITL data
This regulatory change also resulted in acceleration in the use of industrial-type credits (HFC and N2O). The ratio between the percentage of industrial credits in the supply available for surrender (see Appendix
Box 1 – Lafarge
Public data show that 17 of Lafarge's installations surrendered a total of 5.8 million Kyoto credits. The surrendered credits consisted of CERs from 49 different CDM projects and of a few ERUs from a single JI project.
Moreover, Lafarge was involved in the origination of CDM projects in its subsidiaries abroad since 2005 and has generated CERs from 6 ‘cement’ projects. Three of the projects in question had already issued a total of 831,000 CERs as at 1 May 2013 (UNEP-Risoe), of which 509,675 had already been surrendered within the EU ETS. These credits were surrendered by 10 installations, primarily power generators, refineries and cement manufacturers in six European countries. The CITL data show that no CER generated by these projects was returned by any of the 17 Lafarge installations.
Figure 8 – Breakdown of the CERs and ERUs surrendered by the EU ETS between 2008 and 2012 by sector (as a percentage of the total of ≈≈≈≈ 1 GtCO2e)
Figure 9 – Geographical breakdown of the CERs and ERUs surrendered by the EU ETS between 2008 and 2012 (as a percentage of the total of ≈≈≈≈ 1 GtCO2e)
1 for the estimation method) and the percentage of industrial credits actually surrendered increased constantly, rising from 50% in 2008 to 93% in 2013. To calculate this ratio, we estimated the supply that was available to the EU ETS after the purchases of CERs and ERUs by (EU and non-EU) governments and Japanese industrial companies, and compared it with the amount surrendered by the EU ETS for each type of project. Prior to doing so, we assumed that governments' CER and ERU purchasing behaviour was similar to that of EU ETS operators (Figure 10).
Figure 10 – Comparison between the volume of credits surrendered by the EU ETS and the available supply after purchases by other sources of demand
Source: CDC Climat Research, based on CITL data
B.
Multiple compliance strategies in the context of an economic downturn
a) A variety of strategies: from direct investment in a project to buying on the secondary market
Industrial companies have several options to get Kyoto credits: (1) purchasing credits on the secondary market (trading platform or broker) or over-the-counter; (2) setting up or directly financing a CDM or JI project; or (3) contributing to an investment vehicle (a carbon fund, for instance) and investing jointly in a portfolio of CDM or JI projects with other industrial companies. The secondary market purchasing solution was by far the most popular (see Section II.A). However, some large industrial groups adopted several approaches at the same time. This was specifically the case of the ArcelorMittal Group (Box 3).
Box 2 – ArcelorMittal
The ArcelorMittal Group developed or provided direct financing for a registered JI project which delivered 355,000 ERUs, and for seven CDM projects, none of which had issued any credits as of 1 May 2013 (UNEP Risoe).
41 Group installations surrendered a total of 37 million credits over Phase II, primarily in 2011 and 2012 (26 million CERs and 11 million ERUs from projects in 18 countries). Unlike in the case of the Lafarge Group, it is interesting to observe that 92% of the credits generated by the JI project set up in Ukraine
b) The surrender process was dominated by large installations, despite wide participation
The participation of industrial companies subject to the EU ETS in the international credit surrendering process increased during Phase II of the EU ETS. On a coherent perimeter at European level, installations' participation rate in the credit surrendering process rose from 15% in 2008 to 54% in 2012. Around 7 out of 10 installations surrendered at least one Kyoto credit between 2008 and 2012.
However, the participation rate among small installations – i.e. installations that emit less than 50,000 tCO2e – was markedly lower than for other installations (see Appendix 9): 61% of these installations surrendered at least one credit between 2008 and 2012, compared with 95% of installations emitting over 500,000 tCO2e (Figure 11). This figure is likely much lower for small installations which do not belong to a large company – such as hospitals, and which do not benefit from transaction costs mutualisation at company level.
The small installations focused on two points to limit transaction costs:
1. they primarily surrendered international credits in one or two instalments, while very large installations tended to surrender credits every year;
2. they maximised their import limit. On average, these installations surrendered 95% of their authorised limit compared with 86% for very large installations (with emissions above 500,000 tCO2e per year).
Figure 11 – Participation rate for installations that surrendered Kyoto credits according to size
Source: CDC Climat Research, based on CITL data
10
http://www.cleantechinvestor.com/portal/fundnews/1313-arcelormittal-clean-technology-venture-capital-and-carbon-fund.html
were surrendered to make five Polish installations and one French installation belonging to ArcelorMittal compliant.
Moreover, in 2008, the Group set up an investment vehicle known as the "Clean Technology Venture Capital Fund and Carbon Fund10" with €100 million in capital, in partnership with Bessemer Venture Partners, Khosla Ventures and Kleiner Perkins Caufield & Byers. The aim of this fund was to invest in offset projects to make the Group's installations compliant in a streamlined way. This fund was suspended due to the economic recession.
c) Arbitrages were performed regardless of the compliance position
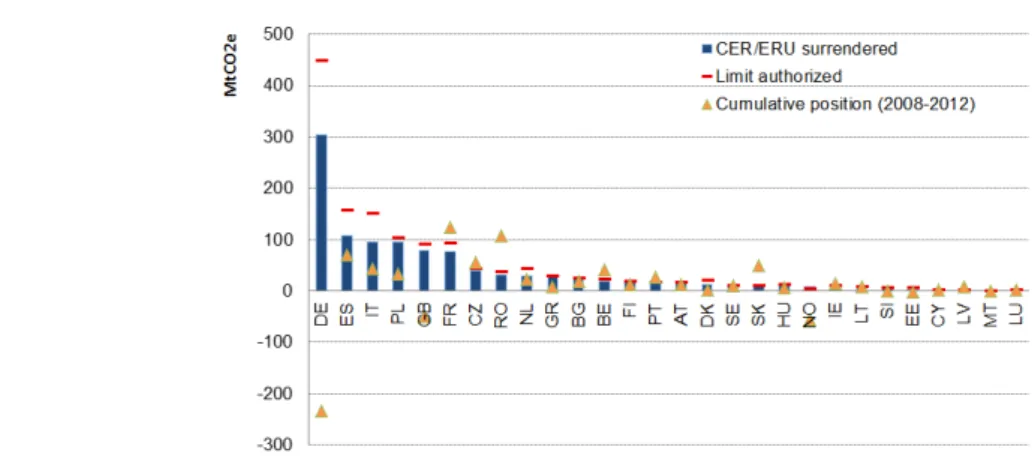
Installations' behaviour was not correlated to whether they had a surplus or shortfall of allowances. They all surrendered credits to achieve the aforementioned arbitrage gains, even if they had a surplus of allowances and therefore did not “need” to surrender credits. Over Phase II as a whole, the position of the 8,000 installations that surrendered at least one credit explains less than 1% of variations in the surrender of credits (see Appendix 9). In the same way, the likelihood of an installation surrendering at least one credit was not affected by its position (logistic regression). This observation was reflected on an aggregate basis for countries: a country's net position determined neither the amount of credits surrendered, nor the percentage of the maximum number of surrendered credits that was used (Figure 12).
The authorised import limit was the variable that had the greatest effect on the amount of credits surrendered, both at the installation and country levels (see Appendix 9). Furthermore, we note that the percentage of the maximum amount of surrendered credits that was used was relatively similar between countries (ranging between 60% for Denmark and 96% for Greece and Slovenia8), which confirms that the main limit was exogenous, i.e. the amount of credits available at a given date.
Figure 12 – Surrender of Kyoto credits in Europe according to the authorised import limit and by registry (MtCO2eq)
Note: cumulative position is the difference between EUA allocation and verified emissions over an entire country. Negative positions (DE, GB, NO) means that in these countries, EU ETS installations emitted more overall than their allocation for 2008-2012.
Source CDC Climat Research and CITL
C.
The 1 billion Kyoto credits surrendered enabled European industrial installations to save between
€4 billion and €20 billion in Phase 2
Kyoto credits have always been less expensive than EUAs, initially as a result of asymmetric information, and then because of the maximum credit surrender threshold (around 1.6 MtCO2e at the European level). Surrendering credits therefore enabled installations to reduce their costs. Two estimates are presented here for the savings achieved by EU ETS operators that surrendered international credits: with and without accounting for the elasticity of demand, i.e. the fact that EUAs would have been more expensive in the absence of CERs, as over 1 billion additional emissions reductions would have taken place in installations subject to the EU ETS at a marginal reduction cost.
a) €4 billon saving without demand elasticity
The difference between the price of the EUAs and the CERs on the secondary market (Table 1) is the basis for the more conservative estimate which does not account for demand elasticity. Moreover, it does
11
not factor in the additional benefits that an industrial company may have received by also being the project originator, and thereby obtaining credits at a lower price in the primary market. The lower prices on the primary credit market assign a value to – and therefore reflect – counterparty risk.
The savings achieved thanks to the surrender of international credits are therefore estimated at €4 billion, including €2.3 billion for the surrender of CERs, and €1.6 billion for the surrender of ERUs.
Table 1 – Estimated savings achieved thanks to the surrender of Kyoto credits
Source: CDC Climat Research, CITL* spread weighted according to the volume of CERs (Dec contract).
Note: to estimate the minimum savings generated by the CDM, we assumed that the ERU price was equal to the CER price.
Unsurprisingly, a sector-based assessment shows that the most important sectors for the allocation of allowances over the period between 2008 and 2012 were those that benefited from the greatest savings (Figure 13). In fact, the combustion sector saved at least €2.6 billion, followed by the steel sector (€455 million) and the cement sector (€430 million). Meanwhile, the oil refining sector, and the paper and cardboard manufacturing sector saved at least €253 million and €70 million respectively.
Figure 13 – Estimated minimum savings achieved for each sector that surrendered international credits between 2008 and 2012 (€4 billion in total)
Source: CDC Climat Research and CITL
b) €20 billon savings with demand elasticity
The Zephyr-Flex model (Trotignon, 2013, Appendix 10) simulates, among others, the EUA price which would have materialized if European installations had not been allowed to surrendered Kyoto credits. This is the basis for a second estimate which takes into account the elasticity of demand, that is the fact that the EUA price would have been higher in the absence of CER and ERU.
Net savings for EU ETS industries are then estimated at €20.8 billion. This estimate is likely more accurate than the first one as the model aggregates the abatement cost curves of all sectors of the EU
Year EUA-CER* spread CERs surrendered (Mt) Minimum CDM savings (€m) ERUs surrendered (Mt) Minimum JI savings (€m) 2008 4.05 83.5 338.2 0 0.0 2009 1.54 77.4 119.6 3.2 4.9 2010 2.06 117.1 240.7 20.1 41.3 2011 3.34 177.8 593.6 75.8 253.1 2012 4.87 219.5 1,068.7 284.1 1,383.2 Total 675.3 2,360.8 383.2 1,682.5
ETS and simulates the choices and expectations of agents in terms of banking/borrowing, purchases and sales and the evolution of deficits and surpluses.
Nevertheless, this second estimate contains more sources of uncertainty than the one which does not account for demand elasticity:
• it relies on marginal abatement cost curves which have not been validated for the high price range over which they must be used to simulate an EU ETS without credits;
• the simple adjustment used to extrapolate Trotignon’s inital estimate for 2012 likely overestimates abatement costs and hence savings from the use of credits;
• assimilating credits to auctioned EUAs in the model likely overestimates the value of credits and hence underestimates the savings from their use;
• the model does not simulate the commonly acknowledged anticipation that around 600 million more credits will soon be surrendered and hence underestimates the savings from the use of credits.
D.
Industrial companies are directly subsidising their competitors
Short-term savings (Section II.C) can hide perverse losses of competitiveness over the long term. In fact, some carbon offset projects were implemented by companies that compete with companies subject to the EU ETS. However, the value of the carbon credit, like that of any asset, does not just compensate its producer, but generates a profit for the seller, and likewise for the buyer (see Section II.C).
We will illustrate this point on the example of three projects from sectors that are subject to a significant carbon leakage risk, namely the cement, iron and steel, and paper sectors (European Commission, 2010).
The paper sector. Aside from the fact that the paper sector is included in the list of sectors subject to
significant carbon leakage risks, we observe that countries in the euro zone export a substantial portion of their paper production to Asia, and particularly to China and India (Eurostat 2013). We can therefore legitimately take the view that there is a global market – and therefore global competition – in the paper sector. According to the information contained in the PDD for CDM 679 “Optimisation of steam consumption at the evaporator”, the counterparty buying the credits is the ABN AMRO bank. The project had generated 175,000 CERs as at 1 May 2013 (Fenhann, 2013). Of those, 20,000 CERs were surrendered by a Finnish paper manufacturer that therefore indirectly financed a competitor in India.
The iron and steel sector. According to the information contained in the PDD for JI 1000370
“Reconstruction of the metallurgical plant at the Chelyabinsk Metallurgical Plant ОАО, Chelyabinsk, Russia”, the counterparty buying the credits is the Vitol trading company, which is based in Switzerland. The project had generated 4.3 million ERUs as at 1 May 2013 (Fenhann, 2013). Of those, around 2 million ERUs were surrendered by five steel installations (four in Germany and one in Poland), which therefore indirectly financed their Russian competitor.
The cement sector. We will use the example of JI project 1000333 “Energy efficiency interventions at
OJSC Mordovcement Komsomolskiy town, Republic of Mordovia”. According to the information contained in the PDD, the aim of this project is to improve the energy efficiency of a cement manufacturing installation, while the counterparty buying the credits is Global Carbon, a Dutch company. The project had generated 400,000 ERUs as at 1 May 2013 (Fenhann, 2013). It is interesting to note that around 50% of the ERUs generated by the project (i.e. 242,000 ERUs) were returned by four Spanish cement installations that had no ties to the project. This means that the Spanish cement installations provided indirect financing to their Ukrainian competitor, even though the distance in this case undoubtedly makes that Ukrainian competitor less threatening than those located in North Africa.
These examples show that the short-term arbitrage gain based on surrendering CERs rather than EUAs is potentially achieved at the expense of long-term competitiveness, since companies are indirectly financing their competitors. However, given the amounts at stake, the impact on the competitiveness of European countries is immaterial when compared with the many other factors that need to be taken into account (cost of labour, productivity, cost of transport, cost of capital, etc.). Moreover, these examples are only an anecdotal manner of illustrating this effect: even if industries had boycotted the credits generated by their
direct competitors, other installations – such as power producers – would have purchased these credits anyway.
CONCLUSION
Institutional framework led to the formation of a speculative bubble which was then inflated by the market’s short-sightedness. The 2004 rules set the maximum demand for Kyoto credits at around 1,400
MtCO2eq between 2008 and 2012. The Climate & Energy Package adopted by the European Union in late 2009 reviewed the directives relating to the EU ETS, and established the framework for using Kyoto credits in Phase III (2013-2020). These rules ultimately resulted in a slight increase in the limit on imports of international carbon credits. The abrupt reduction in the maximum limit for surrendering credits resulted in the emergence of a speculative bubble, as the level of credit supply was dimensioned based on the annual demand that could be anticipated from the 2004 decision.
Due to the imbalance between international credit supply and demand, CERs and ERUs prices collapsed to near zero. The restriction on authorised imports also represented a visible limit, especially
in 2012 when the aggregate number of surrendered credits began reaching with the overall limit set for the period between 2008 and 2020. Demand from the EU ETS dried up, as installations had already contracted for the purchase of credits equivalent to their maximum surrender level as from mid-2012. The imbalance between international credit supply and demand resulted in a decoupling of the price of EUAs and international credits in the second half of 2012, which marked the bursting of the bubble which was costly to investors.
As the demand was already saturated, reforms on project mechanisms did not have any effect on market equilibrium. The European Commission wants to reform project mechanisms to improve their
environmental integrity and their effectiveness, redirecting the demand for credits towards some sectors and countries. These qualitative restrictions introduced in phase 3 which were supposed to rebalance the market, became obsolete before they even entered into effect on the 1st of May 2013. On this point, we would note that the European Union is currently the only region in the world that does not obligate its operators to use a minimum amount of domestic offsets.
The use of CERs and ERUs grew exponentially and efficiently, in the sense that it was fast and substantial, and involved around 7 in every 10 installations subject to the EU ETS. A total of over 1
billion Kyoto credits were surrendered by European installations over Phase II of the EU ETS. Surrenders were primarily limited by the amount of credits available, which is symptomatic of an efficient trading system. To a lesser extent, the size of installations played a role in the use of credits, thus slightly limiting the overall efficiency of the market. Once delivered, credits made their way from the producer's account to the end-customer's account very quickly, on average in seven months
Financialisation resulted in the mixing of credits: we might have imagined that industrial companies
would show a preference for some types of credits. This was absolutely not the case: industrial company's features (geographical location, business sector, etc.) are rarely influenced the kind of credits that it surrenders.
Lower credit prices enabled installations to reduce their compliance costs. Kyoto credits have
always been less expensive than EUAs, initially as a result of asymmetric information, and then of the fact that credit surrender was capped at around 1,650 MtCO2e at the European level. The savings achieved by installations subject to the EU ETS are estimated between €4 billion and €20 billion over 2008-2012.
This decline in the price of international assets to prices close to zero does not mean that the public CDM and JI policies failed: the CDM attracted over €300 billion in private investments (UNEP
Risoe, 2013) to avoid (together with JI) the emission of over 2 billion tonnes of CO2e, and logically ran out of steam when the demand determined by government authorities dried up.
APPENDICES AND METHODOLOGIES
The document which presents all appendices and methodologies used by the authors can be downloaded at the following link:
http://www.cdcclimat.com/Climate-Report-no43-Use-of-Kyoto.html
BIBLIOGRAPHY
• Bellassen, V., Stephan, N., Leguet, B. (2012). ‘Will There Still Be a Market Price for CERs and ERUs in Two Years Time?’ Climate Brief n°13. CDC Climat Research.
• Bellassen, V. (2011). ‘What will the market be for Kyoto Credits in 2014 and 2015?’ Tendances Carbone n°64, CDC Climat Research
• Cormier, A., Bellassen, V. (2011). ‘The risks of CDM projects: how did only 30% of expected credits come through?’, Working paper, CDC Climat Research
• Delbosc, A., Stephan N., Bellassen, V., Cormier A., Leguet, B. (2011). ‘Assessment of supply-demand balance for Kyoto offsets’, Working paper, CDC Climat Research
• European Commission (2009) ‘Directive 2009/29/CE’
• European Parliament and European Council (2009) ‘Decision No 406/2009/CE’
• European Commission (2009) ‘FAQ on decision No 406/2009/CE from The European Parliament and the European Council, April 23rd 2009 ‘
• European Commission (2003), ‘Extended Impact Assessment of the Directive of the European Parliament and of the Council amending Directive 2003/87/EC establishing a scheme for greenhouse gas emission allowance trading within the Community, in respect of the Kyoto Protocol’s project mechanisms’, COM(2003)403-final.
• European Commission (2004), ‘Directive 2004/101/EC of the European Parliament and of the Council amending Directive 2003/87/EC establishing a scheme for greenhouse gas emission allowance trading within the Community, in respect of the Kyoto Protocol’s project mechanisms’
• European Commission (2009a), ‘Decision No 406/2009/EC of the European Parliament and of the Council of 23 April 2009 on the effort of Member States to reduce their greenhouse gas emissions to meet the Community’s greenhouse gas emission reduction commitments up to 2020’
• European Commission, International Community Transaction Log (CITL)
• European Commission, National Allocation Plans : Second phase (2008-2012)
• European Commission. (2012). ‘Report from the Commission to the European Parliament and the Council, the State of the European Carbon Market in 2012’
• Elsworth, R., Worthington, B. (2010), ‘International Offsets and the EU 2009, an update on the usage of compliance offsets in the EU Emissions Trading Scheme’, Sandbag, London
• Elsworth, R., Worthington, B., Morris D. (2012), ‘Help or Hindrance? offsetting in the EU ETS’, Sandbag, London
• Fages, E., Tatrallyay, N., Sadaka, M. (2009), ‘2008 compliance data: what can we learn from it?’, Orbeo - Société Générale Commodities Research
• Lewis, M., Curien, I. (2009), ‘A Summary of the EU-ETS Rules on Banking and Swapping’, Deutsche Bank Global Market Research