HAL Id: tel-02128435
https://tel.archives-ouvertes.fr/tel-02128435
Submitted on 14 May 2019HAL is a multi-disciplinary open access archive for the deposit and dissemination of sci-entific research documents, whether they are pub-lished or not. The documents may come from teaching and research institutions in France or abroad, or from public or private research centers.
L’archive ouverte pluridisciplinaire HAL, est destinée au dépôt et à la diffusion de documents scientifiques de niveau recherche, publiés ou non, émanant des établissements d’enseignement et de recherche français ou étrangers, des laboratoires publics ou privés.
Laserplasma acceleration at ultra high intensity
-numerical modeling
Emilian-Dragos Tatomirescu
To cite this version:
Emilian-Dragos Tatomirescu. Laser-plasma acceleration at ultra high intensity - numerical modeling. Astrophysics [astro-ph]. Université de Bordeaux; Universitatea de Vest (Timişoara, Roumanie), 2019. English. �NNT : 2019BORD0013�. �tel-02128435�
WEST UNIVERSITY OF
TIMISOARA
UNIVERSITÉ DE
BORDEAUX
FACULTY OF PHYSICS
CELIA
LASER-PLASMA ACCELERATION AT ULTRA
HIGH INTENSITY - NUMERICAL MODELING
-PhD Thesis-
Scientific advisors:
Ph.D. Student:
Prof. Dr. Daniel VIZMAN
Emilian-Dragoș TATOMIRESCU
Prof. Dr. Emmanuel d’HUMIÈRES
Timișoara 2018
1
Contents
Abstract ...
5
1. Laser plasma acceleration mechanisms ...
9
1.1. Target normal sheath acceleration ... 10
1.1.1. Electron component ... 11
1.1.2. TNSA main mechanism ... 16
1.1.3. Ion beam characteristics ... 20
1.1.3.1. Particle count ... 20
1.1.3.2. Energy range ... 20
1.1.3.3. Opening angle ... 21
1.2. Laser radiation pressure regime ... 23
1.3. Other related acceleration schemes ... 24
2. Basic introduction to the Particle-In-Cell method for
laser-plasma interaction numerical modeling ...
26
D. Tatomirescu, Laser-Plasma Acceleration at Ultra High Intensity - Numerical Modeling
2
2.1. Interacting systems classification ... 27
2.2. Interacting systems description ... 29
2.3. Particle-particle approach ... 31
2.4. Finite-size particles ... 32
2.5. Particle-in-cell method ... 34
2.5.1. Iteration cycle ... 36
2.5.2. Motion equations integration ... 38
2.5.3. Field equations integration ... 39
2.5.4. Weighting of particles and forces ... 41
2.6. Practical considerations when using the PIC method .. 43
2.6.1. Stability ... 43
2.6.2. Energy conservation ... 44
2.6.3. Diagnostics ... 44
2.6.4. Normalization and non-dimensional units ... 45
Contents
3
3. Laser ion acceleration from micro-structured solid targets ....
47
3.1. Simulation parameters ... 48
3.2. Results and discussion ... 49
3.2.1. Flat target with microdot ... 50
3.2.2. Curved target with microdot ... 51
3.2.3. Curved target with microdot and a pulse
focusing cone-like structure ... 53
3.2.4. Improving the beam characteristics obtained
from laser ion acceleration interaction with
micro-structured solid targets ... 55
3.3. Conclusions on structured targets ... 57
4. Target curvature influence on particle beam characteristics
resulting from laser ion acceleration with microstructured
enhanced targets at ultra-high intensity ... 60
4.1. Simulation parameters ... 61
4.2. Results and discussions ... 62
D. Tatomirescu, Laser-Plasma Acceleration at Ultra High Intensity - Numerical Modeling
4
5. Laser ion acceleration and high energy radiation generation
from near-critical gas jets ... 70
5.1. Simulation parameters ... 71
5.2. Results and discussions ... 73
5.3. Conclusions on near-critical gas targets ... 83
6. Final conclusions ... 84
References ... 87
Acknowledgments ... 99
Annexes ... 101
5
Abstract
Due to the present enhancements in maximum attainable laser intensity through high power short pulses (femtosecond range) an increased focus has grown in developing potential laser plasma sources with applications in proton radiography [1], fast ignition [2], hadrontherapy [3], [4], radioisotope production [5] and laboratory astrophysics [6]. Because of these advances in technology, numerous new laser facilities have been created, allowing the popularization of particle acceleration from laser-plasma interaction as a research field. In recent years, the progress achieved in the field was very rapid, showing that the understanding of the physics that stands behind the interaction of a high intensity laser pulse with plasma has been greatly improved.
The problems that are sought to be solved within this research field require the use of plasmas. At sufficiently high pressures and densities (such as the pressure of the laser light at target surface), molecules can dissociate and atoms can ionize, turning the targets (solid, liquid or gaseous) into a plasma. In this kind of environment, one can state that the dominant processes are of a kinetic and collective nature, with an abundance of non-linear phenomena. This makes the use of analytical or fluid models very difficult, therefore, Particle-In-Cell codes have been crucial in the modelling of such parameters and also in experimental work optimization.
The typical Particle-In-Cell codes in use for laser-plasma interaction numerical modelling solve the electromagnetic fields using Maxwell's equations coupled with the Vlasov equations. The method uses macroparticles (a group of real particles that can be depicted as a reduced portion of the phase space) to solve Vlasov equations by the method of characteristics for each species of particle present in the case under study, conserving the charge and the mass of the species that is under study.
The key factor in the development of all the laser-based applications previously mentioned is the need for collimated ion beams that exhibit an adjustable energy bandwidth. The high repetition requirement can be overcome with the new laser facilities
D. Tatomirescu, Laser-Plasma Acceleration at Ultra High Intensity - Numerical Modeling
6
either available such as the BELLA laser [7], or under construction, such as the ELI-NP facility [8].
The work performed within this thesis sets out to prepare for the first experiments that will be performed at the newly constructed ELI-NP facility. In this regard, several target models are numerically modeled to obtain a roadmap to the first experimental results. The thesis contains a short introduction followed by 6 chapters described in the following:
Chapter 1, named "Laser plasma acceleration mechanisms", is dedicated to the
description of the physical processes that occur during the interaction of a strong electromagnetic field with a charged plasma. We talk about the main acceleration mechanisms as reported in the specialty literature. Their occurrence depends on the parameters of both the target and the laser pulse (i.e. density, intensity, shape). This chapter is structured in three sections. In the first two we deal with the most common acceleration schemes, while in the third one we discuss the mechanisms that are less common or require special parameters. In the first section we describe the Target Normal Sheath Acceleration and its electron and ion components. The second section deals with characteristics of the Radiation Pressure Acceleration. The last sub-chapter presents short descriptions for the related acceleration schemes and the mechanisms that are particular cases of the ones discussed in the first two sections.
Chapter 2, named "Basic introduction to the Particle-In-Cell method for
laser-plasma interaction numerical modeling", is envisioned to present the basis on how the
Particle-In-Cell method is being utilized in the numerical modeling of laser plasma interaction. The first part starts with two sub-chapters that differentiate and describe the classes of plasma interacting systems. The chapter then continues with a description of the Particle-Particle approach, and reasons on why it is not suited for the kind of phenomena studied in this work. In the third sub-chapter, we begin by describing the Particle-In-Cell method, its basic iteration cycle, how the integration of the equations involved in this method can be performed and the interpolations required by this approach. The chapter ends with a few practical considerations that are being handled when running Particle-In-Cell simulations.
Abstract
7
Chapter 3, named "Laser ion acceleration from micro-structured solid targets", is
structured into three sub-chapters and deals with the first of the studies performed during the last three years. We start with a description of the simulation parameters. The study has been focused on the particularities of several types of density profiles with a proton-rich microdot: flat, curved and cone target with a concave tip. We study the advantages and disadvantages of each of these target modifications (curvature, microdot and cone structure), and determine if a composite target featuring all three attributes has the potential to produce higher quality proton and ion beams. By comparing the cases of flat versus curved targets, we intend to determine what effect has the addition of a slight curvature to the target, in particular how it affects beam collimation. In this chapter we also want to determine the effects of a pulse focusing structure on the laser pulse electric field. For this purpose, we added into our simulation a conical structure before the main target to investigate its effects. The second section deals with the results of our simulations and their interpretation, while in the last part we draw the conclusions regarding this study.
Chapter 4, named "Target curvature influence on particle beam characteristics
resulted from laser ion acceleration with microstructured enhanced targets at ultra-high intensity", continues the studies performed in Chapter 3 on structured targets. The first
subchapter presents the simulation parameters, which are intended to determine how effective the manipulation of target curvature is in determining the beam collimation and maximum ion energies. The chapter continues with the presentation of the obtained results and their interpretation, culminating with the conclusions drawn from this study.
The work done in Chapter 5, named "Laser ion acceleration and high energy
radiation generation from near-critical gas jets", focuses on the effects resulted from the
manipulation of the density of a gaseous Xe target in interaction with a high intensity ultra-short laser pulse in order to prepare first ultra-high intensity experiments on facilities like BELLA, CETAL, APOLLON and the ELI high power lasers. Similar to the structure of the last chapter, it starts with presenting the study parameters. We want to ascertain if the spectrum features can be controlled by changing the peak density of the gas jet when using ultra high intensity laser pulses, in correlation with the results for lower intensity pulses in the literature. In this study we have the pulse interacting, at normal incidence, with the target composed of Xenon ions and electrons with an increasingly higher maximum
D. Tatomirescu, Laser-Plasma Acceleration at Ultra High Intensity - Numerical Modeling
8
density. The gas target has a cos2 density profile with a 50 microns FWHM in the x direction and uniform in the y direction. The last two sub-chapters are dedicated to interpreting the results obtained through numerical modeling and the drawing of conclusions on the study.
The last chapter of this work, Chapter 6, contains the final conclusions that were drawn from the studies presented within the thesis.
The thesis concludes with three sections: References, Acknowledgements and Annexes. The References section contains the relevant papers, books and various sources that made it possible to complete the studies performed throughout this work. The funding that permitted me to accomplish my studies is presented in the Acknowledgements section. The last section, Annexes, lists some of the contributions that have been added to the PICLS code.
9
Chapter 1
Laser plasma acceleration mechanisms
Ions are accelerated by different physical processes in the laser-target interaction, processes that depend on their position in the target. The shared common feature of these mechanisms is that the ions are accelerated by intense electric fields, occurring because of the strong charge separation induced by the interaction of the laser pulse with the target, directly or indirectly.
We can identify two distinct main sources for charge displacement. One is the charge gradient caused by the direct action of the laser ponderomotive force on the electrons in the front surface of the target, which is the premise for the Radiation Pressure Acceleration (RPA) process [9-11].
The second source can be pinpointed as coming from the laser radiation being converted into kinetic energy of a relativistically hot (~few MeV) electron population. The hot electrons move and recirculate through the target, forming a cloud of relativistic electrons around the target, in the vacuum. The cloud extends for several Debye lengths, creating an extremely intense longitudinal electric field, mostly directed along the surface normal, which, consequently, is the cause of the efficient ion acceleration [12], [13] that leads to the Target Normal Sheath Acceleration (TNSA) process [14].
D. Tatomirescu, Laser-Plasma Acceleration at Ultra High Intensity - Numerical Modeling
10
1.1. Target Normal Sheath Acceleration
A distinctive feature of the TNSA process is that ions are accelerated in directions perpendicular to the target surface, with a very good beam collimation. Usually, the most efficient acceleration mechanisms occur on the rear side of the target, producing ions accelerated to energies greater than the laser ponderomotive force 𝐹𝑝 (for a laser intensity of 𝐼 = 1020 𝑊
𝑐𝑚2 the ponderomotive potential is 𝐹𝑝 = 3.9 𝑀𝑒𝑉).
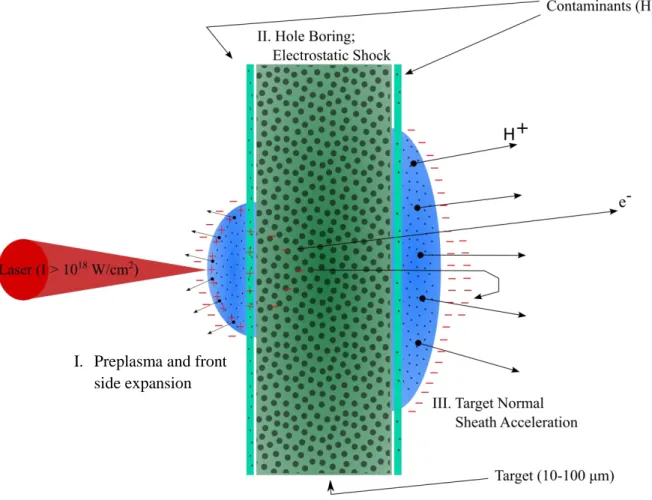
Figure 1. Target Normal Sheath Acceleration schematic overview. Zone I: The preplasma generated by the laser prepulse on the target front side; The main pulse interacts with this plasma and accelerates electrons mainly in the forward direction. Zone II: Electrons recirculate through the target, and due to the collisions with the target material their divergence increases. Zone III: Electrons leave the target, creating a dense sheath. The electric field generated by the charge separation then accelerates the heavier ions.
I. Preplasma and front side expansion
Chapter 1. Laser plasma acceleration mechanisms
11
The rear surface electric field will depend on the electron distribution parameters, such as the divergence, temperature, number, as well as on the parameters of the surface itself (target density profile). The possibility of reaching TNSA also on the front surface of the target has been demonstrated by Ceccotti et al. [15] in an experiment by using laser pulses with ultra-high contrast which leave the surface almost unperturbed. The laser-plasma interaction process for a solid target is illustrated in Figure 1. The particular segments of the laser-plasma acceleration can be pinpointed with respect to their localization. The main pulse touches the plasma and electrons will be accelerated in Zone 1, from the preplasma generated by the laser prepulse on the target front side to the critical density surface, for the most part, in a forward direction. Within the target the electrons will collide with the target material and therefore their divergence will increase (Zone II). Electrons leave the target, creating a dense sheath (Zone III). The electric field generated by the charge separation then accelerates the heavier ions.
1.1.1. Electron component
Depending on the laser intensity, the laser contrast, the laser incidence angle and the target density, collisionless heating of electrons by laser radiation takes place via several heating mechanisms such as Brunel absorption (vacuum heating) [110], resonance heating [111], [112], anomalous skin effect [113], [114], sheath inverse bremsstrahlung absorption [115], relativistic j × B heating [16], [119] and stochastic heating by counter propagating electromagnetic waves [116-118]. For laser intensities higher than 1018 𝑊
𝑐𝑚2 and solid targets, the dominant absorption mechanism is the j × B mechanism [16]. Existing laser ion acceleration mechanisms are based on the electrons excited by the laser pulse and their resulting electric field determined by the charge separation. Calculations done with Particle-In-Cell simulation codes [16-18] have shown that the hot electron component has a logarithmic slope that estimates the ponderomotive potential of the laser beam. In the relativistic regime, the kinetic energy of an electron oscillating in the electromagnetic field of the laser, averaged over the laser cycles represents this estimation [19]:
D. Tatomirescu, Laser-Plasma Acceleration at Ultra High Intensity - Numerical Modeling 12 𝑇ℎ𝑜𝑡 ≈ 𝑈𝑝𝑜𝑛𝑑𝑒𝑟𝑜𝑚𝑜𝑡𝑖𝑣𝑒 ≈ 1[𝑀𝑒𝑉] × ( 𝐼𝜆2 1019) 1 2 [𝑊 ∙ 𝜇𝑚 2 𝑐𝑚2 ] (1)
where is laser wavelength.
Due to the fact that the relativistic electrons are mainly directed inward [20], the one-dimensional Maxwell-Jüttner distribution can be used to simplify the distribution function of the particles. This simplification will lead to a profile close to a normal Boltzmann distribution.
The process of converting the laser energy into hot electrons is a mechanism whose effectiveness is far from perfect. Therefore, only part, η, of the energy will be converted into energetic electrons. The total number of hot electrons is given by:
𝑛0 = 𝜂𝐸𝐿
𝑐𝜏𝐿𝜋𝑟02𝑘𝐵𝑇ℎ𝑜𝑡 (2)
where:
𝐸𝐿 is the laser energy; 𝑐 is the speed of light; 𝜏𝐿 is the pulse duration; 𝑟0 is the laser spot radius.
The conversion efficiency is highly dependent on the preplasma conditions. It can reach values as high as 50% and has a scaling with intensity as follows [21]:
𝜂 = 1.2 × 10⁻¹⁵𝐼0.74[ 𝑊
𝑐𝑚2] (3)
At ultra-high intensities, the conversion efficiency can be as high as 60% when the laser pulse is perpendicular to the target and up to 90% when angles smaller than 45° are used for irradiation [22].
When considering the intensities of state-of-the-art short-pulse lasers, a considerable number of hot electrons are produced and pushed through the target. One can estimate that at least a part of the electrons created (𝑁 = 𝜂𝐸𝐿
Chapter 1. Laser plasma acceleration mechanisms
13
Such electron energies can be reached as their mean free path exceeds the experimental target thicknesses.
The current created by their propagation through the target exceeds the Alfvén limit (𝑗𝐴 = 𝑚𝑒𝑐3𝛽𝛾 𝑒 = 17𝛽𝛾[𝑘𝐴]⁄ ) by several orders of magnitude. For a conductor material, the diffusion of electrons travelling in the target will be limited by the self-generated magnetic field that will send them back to the source [23].
In order not to exceed the Alfvén limit, the net current has to be compensated by return currents, thus, the resulting magnetic field is minimized. The source of these return currents is the charge separation occurring due to the high current of hot electrons propagating inside the target plasma and they have a strong dependence on the target electrical conductivity (these return currents correspond to high densities and lower velocities). In the absence of the return currents, the resulting electric field would stop the electrons in a distance smaller than 1 nm [24]. On the opposite end, if the electric field driving the return currents is strong enough it can stop the fast electrons. This phenomenon is known as transport inhibition and is mainly present in insulators and is insignificant in conductors [25].
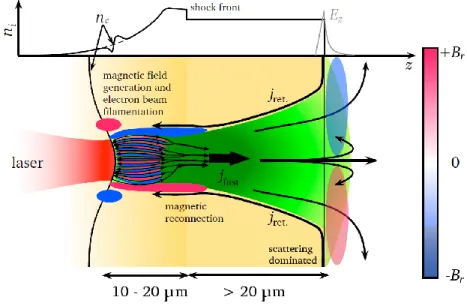
Figure 2. Schematic of laser generated fast-electron transport. The laser (shown in red) impinges on a preplasma with exponential density profile from the left side. The light pressure leads to profile steepening, depicted in the graph at the top of the figure.
D. Tatomirescu, Laser-Plasma Acceleration at Ultra High Intensity - Numerical Modeling
14
An ablation plasma creates an inward-travelling shockwave that heats, ionizes, and compresses the target. Fast electrons are created by the laser, propagating into the dense plasma towards the target’s rear side. The high electron current jfast can lead to
filamentation and magnetic field generation (shown by the light red- and blue-colored areas), as well as driving a return current jret. The global magnetic field tends to pinch
the fast-electron current. Electrons propagating in the dense solid matter interact with the background material by binary collisions. This leads to a spatial broadening of the electron distribution, which becomes the major effect for longer distances. At the rear side, the electrons form a sheath and build up an electrostatic field Ez (grey line in
graph). This can lead to refluxing (recirculation) of the electrons, heating the target even further. (Figure taken from [26])
Further studies are required to determine the process by which the electrons pass through a target. As we can gather from Figure 2, the front surface (of nc critical density, where nc = ε0meω02/e2 is the critical density of the laser at the specified wavelength) is pushed by the laser, resulting in a sharp density profile for the electrons. This plasma motion sends a shockwave into the target, ionizing it, thus changing the target electrical conductivity. After penetrating the cold solid target, we can no longer neglect the binary collisions, which have a spatial broadening effect on the electron distribution, counterbalancing the magnetic field effect [27]. For thick targets (greater than 15 𝜇𝑚) binary collisions are the main spatial broadening mechanism [28].
For a target thickness above 15 𝜇𝑚, one can estimate the electron beam divergence by assuming that the hot electrons are created in an area proportional to the size of the laser focus. Afterwards, the electrons are transported to the back side of the target purely collisionaly (this presumption is in agreement with most of the published information). An analytical description of the broadening distribution generated by multiple Coulomb collisions is given by Bethe, using Molière’s theory [29], namely, the angular distribution, 𝑓(𝜃), follows a Gaussian profile:
𝑓(𝜃) = 2𝑒 −𝜗2 𝜒𝑐2𝐵
√ 𝜃
Chapter 1. Laser plasma acceleration mechanisms
15
with the second term of the right-hand side being a large angle correction [29]. The 𝜗 angle depends on 𝜃 with 𝜗 = 𝜃
𝜒𝑐𝐵1 2⁄
⁄ . B can be determined from:
𝐵 − 𝑙𝑛𝐵 = 𝑙𝑛 (𝜒𝑐 2 𝜒𝑎2′
) (5)
with:
𝜒𝑎2′ being the screening angle, deduced as 𝜒𝑎2′ = 1.167(1.13 + 3.76𝛼2) 𝜆
2 𝑎2 ⁄ ; 𝜆 = ℏ 𝑝⁄ (the de Broglie wavelength of an electron);
𝑎 = 0.885𝑎𝐵𝑍−1⁄3 (𝑎𝐵 is the Bohr radius and Z is the nuclear charge); 𝛼 is given by 𝛼 = 𝑍𝑒2 (4𝜋𝜀
0ℏ𝛽𝑐)
⁄ and 𝛽 = 𝜈 𝑐⁄ ; e being the electron charge;
𝜀0, ℏ,and c denote the absolute dielectric permittivity, the Planck constant and the speed of light, respectively.
The 𝜒𝑐 variable is equal to:
𝜒𝑐2 = 𝑒 4 4𝜋𝜀02𝑐2 𝑍(𝑍 + 1)𝑁𝑑 𝛽2𝑝2 (6) with: electron momentum p; material thickness d;
number of scattering atoms 𝑁 = 𝑁𝐴𝜌⁄ ; 𝐴 material density 𝜌;
mass number 𝐴;
Avogadro's number 𝑁𝐴.
From this, we can gather that 𝜒𝑐 is proportional to the target thickness and density as 𝜒𝑐 ∝ √ρd, which means that the angular distribution of the electrons that are transported through the target is proportional to both the target density and its thickness. Using these
D. Tatomirescu, Laser-Plasma Acceleration at Ultra High Intensity - Numerical Modeling
16
analytical formulae, one can make an estimation of the angular dispersion of laser-accelerated electrons (hot electrons) that are transported though cold solid materials.
The small-angle scattering electron distribution broadening can also be used to analyze proton beam profiles. Although this model appears to give a good estimation of the angular distribution of forward-propagating fast-electrons generated by laser-plasma interaction, it may not always give an accurate assessment of the electrons that reach the back part of the target. Davies [30] showed that, beside the production of the electromagnetic field, the electron recirculation must be taken into account, which turns calculations and estimations into very difficult tasks. This has been demonstrated to be true for targets below 20𝜇𝑚 in thickness [31], but for thicker targets the number of electrons is overestimated when assuming there is a strong recirculation. To sum it up, it is still not clear if electromagnetic fields and recirculation are necessary for the determination of the hot electron transport through cold solid targets, but using a simple collision model gives a rather good estimation.
1.1.2. TNSA main mechanism
The majority of the electrons created by the laser pulse are transported through the target to the back side. The scattering resulted from simple collisions leads to a transversal extension, which can be approximated by:
𝑟𝑠ℎ𝑒𝑎𝑡ℎ= 𝑟0+ 𝑑 tan (𝜃
2) (7)
where:
𝑟0 is the transversal size of the electromagnetic pulse in focus; d is the target thickness;
𝜃 is the broadening angle of the electron distribution estimated in the previous section (Equation (4)).
The energy distribution of the electrons has an exponential profile as follows: 𝑛ℎ𝑜𝑡(𝐸) = 𝑛0𝑒𝑥𝑝 (−
𝐸
𝑘𝐵𝑇ℎ𝑜𝑡) (8)
with 𝑘𝐵𝑇 being the temperature, and 𝑛0 the overall density. Thus, we can estimate (not taking into account recirculation) the electron density on the rear region as:
Chapter 1. Laser plasma acceleration mechanisms 17 𝑛𝑒,0 = 𝜂𝐸𝐿 𝑐𝜏𝐿𝜋(𝑟0+ 𝑑 tan 𝜃)2𝑘 𝐵𝑇ℎ𝑜𝑡 (9) By inserting 𝐸0 = √2𝐼0 𝜀0𝑐 ⁄ ≈ 2.7 × 10¹²𝑉 𝑚
⁄ and by using equations (2) and (3), coupled with a ponderomotive scaling electron temperature notation like:
𝑘𝐵𝑇ℎ𝑜𝑡 = 𝑚0𝑐2(√1 + 𝐼0[ 𝑊
𝑐𝑚2] 𝜆𝐿 2[𝜇𝑚2]
1.37 × 10¹⁸ − 1) (10)
we can obtain an approximation for equation (9) as follows:
𝑛𝑒,0 ≈ 1.5 × 10¹⁹ 𝑟0 2 (𝑟0 + 𝑑 tan𝜃 2) 2 ( 𝐼 1018 𝑊 𝑐𝑚2 ) 7 4 ⁄ √1 + 0.7311018 𝑊𝐼 𝑐𝑚2 𝜆𝜇𝑚2 − 1 [𝑐𝑚−3] (11)
From this approximation, we can extrapolate that the density of the electrons that exit the target in the forward direction is proportional to the laser intensity, I, and with 1
𝑑2. By applying these equations to a laser pulse intensity of 𝐼 = 1019𝑊
𝑐𝑚2
⁄ , with a focal spot of 𝑟0 = 10 𝜇𝑚 and a target thickness of 20 𝜇𝑚, we obtain, according to equation (4), an angular expansion of 𝜃 = 42° for the electrons that have the mean energy of 𝑘𝐵𝑇. Using the approximation (11), we obtain an electron density at the rear region of 𝑛𝑒,0 = 1.4 × 10²⁰𝑐𝑚−3, which supports the assumption of shielded transport through the cold solid target, being several orders of magnitude below the density of a solid.
After exiting the target, the electrons travel through a vacuum region. According to Poisson's equation, this charge separation gives rise to an electric potential Φ in the vacuum region. This can be written in one dimension as:
𝜀0𝜕 2Φ
𝜕𝑧2 = 𝑒𝑛𝑒 (12)
To solve this, a few assumptions have to be made: the solid matter in half the space, wherez is 0 or below, compensates perfectly for the electric potential, while for 𝑧 → ∞, the potential also goes to infinity. For the vacuum region, the field can be calculated analytically [32]. The electron cloud density is as follows:
𝑛𝑒 = 𝑛𝑒,0𝑒𝑥𝑝 ( 𝑒Φ 𝑘𝐵𝑇ℎ𝑜𝑡
D. Tatomirescu, Laser-Plasma Acceleration at Ultra High Intensity - Numerical Modeling
18
with the initial density for the electrons approximated with equation (11). The solution is achieved by using the assumption that 𝑒Φ
𝑘𝐵𝑇ℎ𝑜𝑡= −2𝑙𝑛(𝜆𝑧 + 1) . The potential then becomes: Φ(𝑧) = −2𝑘𝐵𝑇ℎ𝑜𝑡 𝑒 𝑙𝑛 (1 + 𝑧 √2𝜆𝐷 ) (14)
which in turn yields the corresponding electric field: E(𝑧) =2𝑘𝐵𝑇ℎ𝑜𝑡
𝑒
1 𝑧 + √2𝜆𝐷
(15) where 𝜆𝐷 is the electron Debye length:
𝜆𝐷 = (𝜀0𝑘𝐵𝑇ℎ𝑜𝑡 𝑒2𝑛 𝑒,0 ) 1 2 ⁄ (16) and represents the area where most of the charge separation takes place [33]. By substituting equations (10) and (11), we obtain:
𝜆𝐷 ≈ 1.37𝜇𝑚𝑟0+ 𝑑 tan 𝜃 2 𝑟0 √1 + 0.73𝜆21018𝑊𝐼 𝑐𝑚2 ⁄ − 1 ( 𝐼 1018𝑊 𝑐𝑚2 ⁄ ) 7 8 ⁄ (17)
The Debye length (longitudinal sheath extension) scales with the square of the target width (𝑑 tan𝜃
2 ∝ 𝑑
2) and is in inverse proportion to the intensity of the laser pulse. This means that having a higher laser intensity will produce a shorter sheath extension at the rear side and, in turn, a stronger electric field. For the pulse and target parameters used previously we obtain a Debye length of 𝜆𝐷 = 0.6𝜇𝑚.
The electric field is at its maximum when 𝑧 = 0: 𝐸𝑚𝑎𝑥(𝑧 = 0) =√2𝑘𝐵𝑇ℎ𝑜𝑡 𝑒𝜆𝐷 (18) 𝐸𝑚𝑎𝑥(𝑧 = 0) ≈ 5.2 × 10¹¹𝑉⁄𝑚 𝑟0 𝑟0+ 𝑑 tan𝜃 2 ( 𝐼 1018 𝑊 𝑐𝑚2 ) 7 8 ⁄ (19) 𝐸𝑚𝑎𝑥(𝑧 = 0) ≈ 9 × 10¹⁰𝑉 𝑚 ⁄ 𝑟0 𝑟0+ 𝑑 tan 𝜃 2 𝐸12𝐸123⁄4 (20)
Chapter 1. Laser plasma acceleration mechanisms
19
From this, we can see that initially, at z = 0, E ∝I and E ∝𝐸127⁄4 (the electric field strength, 𝐸12, from equation (20) is in units of 1012𝑉 𝑚⁄ ). For times greater than the initial moment, the strength of the field is governed by the ionizations and ion accelerations that occur on the posterior side of the target.
Since this electric field is a few orders of magnitude above the atom ionization threshold, it leads to instant ionizations in the target rear region [34]. The laser external electric field overlaps the atoms Coulomb potential and after the field exceeds the binding energy of the electron the ionization of the atoms occurs due to the freeing of the electron. The dependence of the threshold electric field strength, 𝐸𝑖𝑜𝑛, to the binding energy, 𝑈𝑏𝑖𝑛𝑑, is:
𝐸𝑖𝑜𝑛 = 𝜋𝜀0𝑈𝑏𝑖𝑛𝑑 2
𝑒3𝑍 (21)
As the rear side electron sheath is relatively dense, one could make the argument that the atoms can be ionized through collision. Despite this, Hegelich [35], showed that the collisional cross-section in the collisional area is far smaller than the field ionization cross-section at the surface of the target. Thus, the majority of atoms present at the posterior side of the target are instantly ionized, and then, due to the electric field, are accelerated. In experiments, an estimation for the maximum charge state is performed using the maximum field strength that appears in the setup. The sheath peak electric value [35] and the transverse field extension [36], [37] have been previously estimated in this manner.
Not all the electrons are trapped by this electric field. Lower energy electrons are also stopped and re-accelerated into the target. The time scale on which these phenomena occur is of just a couple of femtoseconds, due to the electron velocity being comparable to the speed of light and the distances discussed being of the micrometer order. By factoring this in, we can conclude that electrons will always be found at the posterior side of the target. The created electric field is quasi-static, in the order of the ion acceleration time. This field is directed normal to the target posterior surface, giving the accelerated ions a normal direction with respect to the target rear surface, hence the name of the mechanism, Target Normal Sheath Acceleration.
D. Tatomirescu, Laser-Plasma Acceleration at Ultra High Intensity - Numerical Modeling
20
1.1.3. Characteristics of the ion beam
The reasons of the comprehensive research in laser-accelerated ions are the remarkable properties arisen from using these kinds of laser intensities, namely high brightness, high directionality and laminarity and short pulse duration. Having these particularities in mind, the produced ion beams can be used in various applications in science, technology and medicine. In the following, the main parameters of the ion beams will be discussed.
1.1.3.1. Particle count
A most useful feature of the TNSA ion beams is the high number of particles that are accelerated in the forward direction. Presently, the particle counts for protons with energies above 4 MeV, detected in experiments, have been up to 6 × 10¹⁶, which means that the general conversion efficiency from laser to ion beam energy is about 9%. This can become an issue when considering that the target is of finite size, having a limited number of protons in the contamination layer, thus it can deplete. Allen et al. [38] determined that on the back surface of an Au foil, in a 1.2 × 10⁻⁴μm thick layer, there are 2.24 × 10²³atoms
cm3
⁄ . It has been shown experimentally [39] that using a coating for the back surface of a metal can supply enough protons, up to a thickness of ≈ 100nm, after which, due to limited electrical conductivity, it may cause instabilities in the electron propagation.
1.1.3.2. Energy range
The usual distribution of the ion beam energy, based on the mechanism previously described, has an exponential profile, with a cut-off depending on the hot electron temperature. The acceleration process occurs in the order of charge to mass ratio, particles with a high ratio being the first to be accelerated, unless some special target manipulation is performed. The presence of these protons is owed to the limited vacuum achievable, thus water vapors and hydrocarbon contaminants are still present on the target surface, and are exposed to the strongest electromagnetic field gradients. The contamination layer thickness has a high impact on the screening of the electric field for protons and ions situated further in the depth of the target, thus creating a broader energy distribution with the increase in
Chapter 1. Laser plasma acceleration mechanisms
21
thickness. Also, the presence of an inhomogeneous electron distribution drives an inhomogeneous acceleration field in the transverse directions. The primary drawback of laser ion acceleration is comprised of this inhomogeneous ion energy range.
To date, only three groups [40-42] have obtained a quasi-monoenergetic beam with an energy spread ≤ 20%, using mainly the TNSA mechanism. Hegelich et al. [40] experimented with heated palladium foils, 20 𝜇𝑚 thick. The target heating (𝑇~600 𝐾) meant that the surfaces were completely dehydrogenised, leaving only carbon atoms on the target surfaces. Further increasing the temperature (𝑇 > 1100 𝐾), the remaining carbon had a phase transition, forming a monolayer of graphite on the palladium surface. From this layer, 𝐶5+ ions were accelerated to 3 𝑀𝑒𝑉 𝑢⁄ with an energy dispersion of 17%. This procedure offers both advantages and drawbacks. Even if the resistive heating removes all the hydrogen component, it requires extremely precise temperature measurements and the graphene formation cannot be controlled.
Schwoerer et al. [41] used titanium foils of 5 𝜇𝑚 in width, which were coated with hydrogen-rich polymethylmethacrylate microdots of 20 𝜇𝑚 × 20 𝜇𝑚 on the posterior surface of the foil. In this case, the accelerated protons had a quasi-monoenergetic spectrum with a peak at 1.2 MeV.
Ter-Avetisyan et al. [42] used the interaction of a high-intensity, high-contrast laser pulse and a water droplet of limited mass to produce quasi-monoenergetic deuteron blasts. They reported an energy dispersion of 20% for a peak position of 2 𝑀𝑒𝑉 in the spectrum. The major drawback of this experiment was low probability of laser-droplet interaction.
1.1.3.3.
Opening angle
The most energetic protons are emitted under opening angles, ≤5° half angle, then, with the drop in energy, the angle increases. This happens for the cases that are below 30% maximum energy, at which point the angle remains constant, even for lower energies. The angle increases mainly parabolically with the decrease in energy, even though this pattern may sometimes be linear (Figure 3).
D. Tatomirescu, Laser-Plasma Acceleration at Ultra High Intensity - Numerical Modeling
22
The opening angle slope profile is a result of the hot electron initial distribution at the target surface [43]. According to Carroll et al. [43], a transverse dependent Gaussian sheath will result in a greatly curved opening angle profile, while a hot electron sheath with a parabolic profile will give a linear dependency. On the other hand, the precise modeling of the acceleration process is not described fully in [43]. The experimental results are better explained by the more detailed model presented in [44]. Another important aspect to note is that opening angle is not the same as beam divergence. The opening angle is measured from the point where the source emits its maximum output (the center) to the point where the source emits 50% of its output whereas the beam divergence is a measure of how fast the laser beam expands far from its focus. The proton beam divergence slightly increases along with the increase in energy, while the source size decreases with proton energy [45], [46].
Figure 3. Half opening angle effect on the particle energy. Trident data (blue circles), LULI-100 TW (green circles), and Z-Petawatt (red circles). The plots are normalized to the beam maximum energy of each respective facility. Once the energy increases, the opening angle decreases. Data from the LULI and Z-Petawatt experiments show a
Chapter 1. Laser plasma acceleration mechanisms
23
parabolic dependency while the Trident experimental results display a linear slope. (figure taken from [24])
1.2. Laser Radiation Pressure Acceleration
The Radiation Pressure Acceleration regime (RPA) was introduced though theoretical and numerical studies by Wilks et al. [47] and Denavit et al. [48], being first referred to as the hole-boring (HB) scheme (this acceleration scheme can also be referred to as the laser piston regime). This process occurs in thick targets inside which it can produce strong electrostatic shocks [49] as it accelerates directly the ions found at the critical density interface where the laser pulse is stopped [50]. The laser ponderomotive force pushes the electrons at the front side of the target, leading to a high amplitude electrostatic field that is created due to the charge separation. As such, during the duration of the laser pulse, ions located on the front surface of the target are accelerated to high energies.
An analytical approximation of the maximum energy for ions accelerated in the forward direction can be performed. This ion maximum velocity, for the particles inside the target, can be calculated as two times the surface velocity of the receding plasma [48],[51]. In the case where we have a maximum efficiency of the regime, which means the laser is totally reflected at the critical interface, the velocity of the receding plasma is given by [47],[17]: 𝑢𝑠 𝑐 = √ 1 2 𝑛𝑐 𝑛𝑒 𝑍𝑚𝑒 𝑀𝑖 𝑎02 (22) where:
𝑛𝑐 is the critical density at the laser reflection (at normal incidence 𝑛𝑒 = 𝛾𝑛𝑐 [52]); 𝑀𝑖 is the ion mass;
𝑚𝑒 is the electron mass;
D. Tatomirescu, Laser-Plasma Acceleration at Ultra High Intensity - Numerical Modeling 24 𝑎02 = (𝑝𝑜𝑠𝑐 𝑚𝑐) 2 = 𝐼𝜆2 1.37∙1018; 𝐼is the laser intensity;
𝜆the laser wavelength in microns.
From this we get the maximum energy of the forward accelerated ions:
𝐸𝑓𝑟𝑜𝑛𝑡 = 2 ∙ 𝑀𝑖∙ 𝑢𝑠2 =𝑍𝑚𝑒𝑐 2𝑎
0 2
𝛾 (22)
In the case when a circularly polarized laser pulse is used, electrons are pushed by a strong electrostatic field created at the front of the target. The key difference is that the electrons are not heated. Instead an electron layer is created within the target, that travels along it. This regime was studied in a number of theoretical and numerical studies [10], [53-57] and also in experimental studies [58]. This regime was also observed on higher wavelengths lasers at the interaction with gas jets [59], [60].
1.3. Other related acceleration schemes
When using near-critical density, partially expanded targets [61], [62], one can observe the occurrence of the Magnetic Vortex Acceleration mechanism (MVA). This mechanism relies on the quasistatic magnetic field generated by the fast electron currents in the vicinity of the rear target surface which, in turn, are generated by the propagation of the laser light through the expanded target. It has been proven that this quasistatic magnetic field generates an inductive electric field at the rear side of the target which augments the TNSA ion acceleration [63-66].
The Collisional Shock Acceleration (CSA) is another acceleration scheme first introduced for overdense targets [48], [49]. This mechanism relies upon the generation of a shock wave in the target with the laser pulse as its source, which reflects ions inside the target, thus accelerating them to high energies.
This method was also extended to underdense targets [67]. Compared to solid targets where we have limited laser absorption to the target surface, the laser pulse inside low density targets heats electrons on a large volume which leads to a higher laser
Chapter 1. Laser plasma acceleration mechanisms
25
absorption overall. This acceleration regime is also advantageous for several applications because of the reduced debris produced. Another advantage of such targets is the adaptability to high repetition rate lasers.
A typical problem for thin foils is the laser contrast, but in the case of near-critical targets this becomes less detrimental than in the case of solid targets, as gas jets do not absorb much laser energy for laser intensities below 1013 W/cm2 for a one-micron wavelength laser. Ion acceleration produced from the interaction of a very high intensity laser with underdense targets has been studied with Particle-In-Cell (PIC) simulations [68-70], but the simulated targets did not reproduce the gas targets available for experiments.
The first experiments of ion acceleration via laser interaction with underdense targets showed radial acceleration [71]. Recent experiments proved that using high intensity lasers one can obtain strong longitudinal proton acceleration [72-73]. In this case the energy of the longitudinally accelerated protons is greater than the one of the transversally accelerated protons.
The accelerating mechanism that causes the energetic accelerated ions seen in [72-73] has not yet been described in detail and therefore is the center of an ongoing debate [63], [65]. In the case of near-critical gas targets, a steep density gradient is not easy to achieve experimentally (however, such experimental endeavors have been achieved in the past [74]), thus, the dependence of the particle acceleration on the specific plasma density is important in order to optimize such experimental efforts.
The studies explored for this work require the modeling of the regimes presented within this chapter using numerical simulations. The most widely used numerical tool that models these acceleration regimes is introduced in the following chapter.
26
Chapter 2
Basic introduction to the Particle-In-Cell
method for laser-plasma interaction
numerical modeling
When we talk about the classical or relativistic description of natural phenomena, we inherently think about the interaction between base elements through force fields. The same can be attributed to the definition of plasma, as an ensemble of charged particles that interact through electric and magnetic fields. In this case, we will have a combination of the electric (E) and magnetic (B) Lorentz force acting as the force (Fp) affecting the
particles. So if we consider a particle p with its charge qp, on the position xp having a
velocity vp we have the following equation:
𝐹𝑝
⃗⃗⃗ = 𝑞𝑝𝐸⃗ (𝑥𝑝) + 𝑣⃗⃗⃗⃗ × 𝐵𝑝 ⃗⃗⃗⃗ (𝑥𝑝 𝑝) (23) From a computational standpoint we can say that the force that is acting on our particle is computed from the electric and magnetic field calculated at the position of the particle. These electric and magnetic fields are generated by the particles present in the
Chapter 2. Basic introduction in the Particle-In-Cell method for laser-plasma interaction numerical modeling
27
plasma system and also by external sources (external magnetic fields or electrodes). The computation of the electric and magnetic field is done by solving Maxwell’s equations:
𝛻 ⋅ 𝐸⃗ = 𝜌 𝜖0 (24) 𝛻 × 𝐸⃗ = −𝜕𝐵⃗ 𝜕𝑡 𝛻 ⋅ 𝐵⃗ = 0 𝛻 × 𝐵⃗ = 𝜇0𝐽 + 𝜇0𝜖0𝜕𝐸⃗ 𝜕𝑡
where 𝜌 is the charge density, 𝜖0 is the vacuum permittivity, 𝜇0 is the vacuum permeability and J is the total current density.
2.1. Interacting systems classification
A critical step in the successful usage of the particle-in-cell (PIC) method is the correct computation of the sources in Maxwell’s equations. Using a broad approach, we can state that if we have a system comprised from particles of infinitesimal size, the sources of Maxwell’s equations are the sum of individual particle contributions.
If we consider a system comprised of ND charged particles situated in a square box
with the side equal to the Debye length (λD) then the electric field in any point of the box
can be determined by superimposing all the contributions of the individual particles. The Debye length is chosen for exemplification due to the plasma basic property of shielding localized charges over distances greater than the Debye length. This effect is exponential in nature and the canceling effect is not totally achieved over just one Debye length, but sufficient for a basic grasp of the phenomena.
Considering ideal conditions, having the configuration depicted in Figure 4, we have a collection of particles that move constantly, interact with each other and are agitated by their thermal motion. If we place a detector, inside this ideal box, for the local electric field, we would obtain a signal increase as a particle approaches the detector followed by a signal decrease as it moves away.
D. Tatomirescu, Laser-Plasma Acceleration at Ultra High Intensity - Numerical Modeling
28
Figure 4. Strongly coupled system schematic [75]. E is the detector, and in blue we have the signal from the detector.
Statistically speaking, we have a low number of particles near the detector at any given time, but the specific position of these particles is very important in order to determine the value measured by the detector. Also, it is important to note that the effect of any particle on the signal received by the detector is strongly influenced by the distance of the particle to the detector probe, and, only when particles are in close proximity, we see a strong effect. Extrapolating this to the whole system, each of the contained particles detects the same kind of effect. The electric field that any given particle feels is the sum of all other particle contributions, but only when another particle is in close proximity, a significant increase in the electric field occurs. This event is labeled as a collision. As time passes, the particles in the box are affected by a series of such events that modify the particle trajectories. This kind of system is referred to as a strongly coupled system in the kinetic theory. The condition for this kind of system is that the number of particles present in the box is small.
On the other hand, we have the weakly coupled system. Its configuration can be seen in Figure 5. This kind of system is composed from a large number of particles, which, in turn, means that the number of particles that contribute to the electric field at any given time is very high. Another consequence of the high number of particles contributing to the electric field is that the measurements are smoother, and we do not have the same strong
Chapter 2. Basic introduction in the Particle-In-Cell method for laser-plasma interaction numerical modeling
29
jumps as in the case of the strongly coupled system. In the same manner, the particle trajectories are affected by a large number of collision events, and such they are smoother and without high jumps.
Figure 5. Schematic of a weakly coupled system [75]. E is the detector, and in blue we have the signal from the detector.
2.2. Interacting systems description
As previously stated, an important parameter in determining the kind of system we deal with is the number of particles present in the said system. For a conventional system with the size of the sides equal to the Debye length, we would have the number of particles:
𝑁𝐷 = 𝑛𝜆𝐷3 (25)
where n is the plasma density.
The classification of the systems can be done by the particle count, so we have a weakly coupled system when ND is large, and a strongly coupled one when ND is small. We
can further elaborate on this model by taking into account the energies of the particles found in the system.
D. Tatomirescu, Laser-Plasma Acceleration at Ultra High Intensity - Numerical Modeling
30
The particle distribution in the box is a random one, but we can associate an average volume to each particle. This volume would be the volume of the box divided by the number of particles found in the box.
𝑉𝑝 = 𝜆𝐷 3 𝑁𝐷 = 𝑛
−1 (26)
Using this volume, we can find the average inter-particle distance, as a function of the plasma density:
𝑎 = √𝑉3 𝑝 = 𝑛−1 3⁄ (27)
Going further, we can say that the electrostatic potential energy between two particles with charge q situated at a distance a from each other is:
𝐸𝑝𝑜𝑡𝑒𝑛𝑡𝑖𝑎𝑙 = 𝑞2 4𝜋𝜖0𝑎
(28) where 𝜖0 is the vacuum permittivity and the particle kinetic energy (from statistical physics) is:
𝐸𝑡ℎ𝑒𝑟𝑚𝑎𝑙 = 𝑘𝑇 (29)
with k being the Boltzmann constant.
Another useful parameter in the evaluation of the coupling of plasmas is the plasma
coupling parameter:
𝛬 = 𝐸𝑡ℎ𝑒𝑟𝑚𝑎𝑙 𝐸𝑝𝑜𝑡𝑒𝑛𝑡𝑖𝑎𝑙 =
4𝜋𝜖0𝑎𝑘𝑇
𝑞2 (30)
adding the Debye length definition and the value for a previously obtained, we get:
𝜆𝐷 = (𝜖0𝑘𝑇 𝑛𝑒2 ) 1 2⁄ (31) 𝛬 =4𝜋𝜖0𝑘𝑇 𝑞2𝑛1 3⁄ = 4𝜋𝑁𝐷 2 3⁄
Chapter 2. Basic introduction in the Particle-In-Cell method for laser-plasma interaction numerical modeling
31
Having this new parameter, we can expand the previous considerations regarding the number of particles inside a Debye cube to include information regarding the energies. In the case when we have a large number of particles in the system (weakly coupled system), their thermal energy exceeds the potential energy, thus the particle trajectories have a low dependency on the inter-particle interactions. On the other hand, when the plasma coupling parameter is small, it means that the potential energy is greater than the thermal energy and we have a strong dependency of the particle trajectory on the inter-particle interaction (strongly coupled system).
2.3. Particle-Particle approach
In principle, one can run a computer simulation of an interacting particles system by simply tracking each particle present in the system. This particle-particle (PP) approach is done by updating Newton’s equations for each of the N particles in the system, while having the combined effect of the component particles acting as the force influencing each individual particle (Fp).
The discretization of the evolution of the system is done in large numbers of temporal steps Δt, chosen in such a way that the particles only move a small distance between time steps. After each particle movement the force is recalculated and only after that a new move can be done. If we have the particle position xp and the particle velocity vp,
then we can write the equation of motion as: 𝑥𝑝𝑛𝑒𝑤 = 𝑥𝑝𝑜𝑙𝑑+ 𝛥𝑡𝑣𝑜𝑙𝑑
𝑝
(32) 𝑣𝑝𝑛𝑒𝑤 = 𝑣𝑝𝑜𝑙𝑑+𝛥𝑡
𝑚
The major computational cost of this approach is the calculation of the force, which is the sum over all the particles present in the system. Considering Fpp’ the interaction force
between two particles, p and p’, we obtain:
𝐹𝑝 = ∑ 𝐹𝑝𝑝′
𝑝′
(33) In the case of the electrostatic force, Fpp’ can be written as:
D. Tatomirescu, Laser-Plasma Acceleration at Ultra High Intensity - Numerical Modeling 32 𝐹𝑝𝑝′ = 𝑞𝑝𝑞𝑝′ 4𝜋𝜖0|𝑥𝑝− 𝑥𝑝′| 2⋅ 𝑥𝑝− 𝑥𝑝′ |𝑥𝑝− 𝑥𝑝′| (34)
In practice, all forces are computed with the old values for the particle position, and once the force is calculated, then the new velocities can be obtained. After this, the new positions are calculated and this cycle is repeated until the end of the simulation. When looking at the force computations, given a number of N particles, for each particle we obtain N-1 terms and also taking into account that each pair of particles is only computed once, we end up with 𝑁(𝑁−1)
2 force computations.
This method of simulation is suitable for strongly coupled systems where we have a low number of particles per Debye cube. The particle-particle method stands at the basis of the molecular dynamics method which is used in condensed matter and biomolecular studies [76]. This method is also used in the study of gravitational interactions, such as cosmological studies regarding the formation and distribution of galaxies.
When talking about weakly coupled system, where the number of particles is large, this method is not feasible. With the increase in particle number, the computational cost of the method increases quadratically (as N2) making the computational effort to run this method for such systems unfeasible. For the case of weakly coupled systems, the goal is to have a method that reduces the description of each particle to a statistical sample of particles.
2.4. Finite-size particles
The most important aspect to successfully and efficiently simulate a weakly coupled system is that the model used needs to manage collective batches of particles instead of individual particles. One computational particle, referred to as a superparticle (or macroparticle), represents a group of particles and can be depicted as a reduced portion of the phase space. The schematic of this concept is presented in Figure 6.
Chapter 2. Basic introduction in the Particle-In-Cell method for laser-plasma interaction numerical modeling
33
Figure 6. Finite size particle (also known as superparticle or macroparticle) schematic representation [75]; In red we have the full representation of the phase space, with the black dot in the middle as the point particle behaviour; In yellow we have the neutralized overlapped area.
The main advantage when using finite-size particles is that the superparticles interact more weakly than point particles because of their finite size. At the interaction of two point particles, via Coulombian force for this example, the repulsive or attractive force between them grows as the particles get closer together, reaching singularity at zero separation.
When we treat the interaction of finite-size particles, we have the same behavior as point particles until the surfaces of the superparticles begin overlapping. After the overlap happens, the area that is subjected to the overlapping is neutralized (yellow portion of represented in Figure 6), and it does not contribute to the inter-particle force. Once the distance between particles is zero, and the particles fully overlap, then the force becomes zero. This assumes the surface of the particles is identical.
In Figure 7 we can see the force between two charged particles of spherical form as a function of the distance between them. When the separation distance is high, the force is identical to the Coulomb force, but as the distance between them decreases and the particles begin to overlap, the force between them becomes weaker than the corresponding Coulomb force, and at full overlap it becomes zero.
D. Tatomirescu, Laser-Plasma Acceleration at Ultra High Intensity - Numerical Modeling
34
Figure 7. Interaction between two charged finite size particles [75]. Inter-particle force plotted for 3 different particle radii (point particle, 0.5D and D).
By using computational particles of finite size one can reduce the inter-particle interactions. Taking into account the definition of the plasma coupling parameter (equation (31)), using finite-size particles results in having lower potential energy for the same kinetic energy. This has the beneficial consequence that a correct plasma parameter can be achieved using less particles in the plasma system, thus recovering the realistic condition.
2.5. Particle-In-Cell method
In the Particle-In-Cell (PIC) method, we have the system represented by a smaller number of finite-size particles that, when the distance between them is greater than their respective overlap size, interact through the correct potential. At small distances, the reduced interaction potential is introduced, correcting the effect of the low number of particles. The method schematic is presented in Figure 8. This kind of treatment ensures that the electric field fluctuations in the system are smooth (blue graph in Figure 8), and correctly represented for a weakly coupled system. The reason behind this is that the effect
Chapter 2. Basic introduction in the Particle-In-Cell method for laser-plasma interaction numerical modeling
35
of the few particles, that are at distances less than the overlap distance, is weak. In a similar manner, we can extend the same reasoning to the particle trajectory. Hence, we have smooth trajectories, similar to what we would have in a real system, because the interactions between near neighbors are weak, and not because each particle is surrounded by a very large number of near neighbors. Furthermore, we can state that the collective effect is correct as long as the interactions at long range are being reproduced correctly as in the physical system.
Figure 8. System composed from finite-size particles [75]. E is the detector, and in blue we have the signal from the detector. In dotted lines we have the grid discretization.
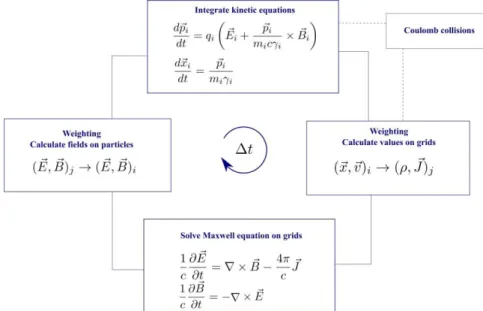
In the following we will consider an approach aimed at offering a clear mathematical link between the plasma mathematical model and its numerical solution. For the sake of clarity and simplicity, we will consider the 1D electrostatic and classical plasma. The extension to a 3D model requires a more complicated notation system, but it is not much more difficult. The motion of superparticles is determined in two steps within the PIC cycle. First step: employing Maxwell’s equations the electromagnetic field can be calculated starting from the initial electrical currents and charge densities. The particles are then moved over a small distance by using this electromagnetic field in Newton’s equation. At the second step the fields are also recalculated using the position and the charge density
D. Tatomirescu, Laser-Plasma Acceleration at Ultra High Intensity - Numerical Modeling
36
determined here. This two-step cycle is being repeated for the whole period of the simulation.
In order to compute the fields a transition is made from the continuous space to a discrete spectrum. Therefore, the computational domain is divided into cells by lines that are parallel to the boundaries. From this grid discretization we can call the line intersections as mesh points or grid points (seen in Figure 8) and this is the origin of the method’s name (Particle-In-Cell). The charge fields are being computed in these points, and the particle movement is being done relative to them.
The space coordinates are continuous for the particles and the particles can occupy any position within the cell. The local charge density is defined as the number of particles found in a cell divided by the volume of the cell in question. There are two main considerations to take into account when setting the resolution of the simulation (the size of the mesh cell). First, the length of the cell has to be less than the Debye length, in order to see the effects of charge density separation in the computation of the fields. On the other hand, we do not want the cell size to be smaller than the superparticle radius, due to the charge calculation [77].
2.5.1. Iteration cycle
As per usual numerical simulation, everything happens in time steps. In each time step there is a cycle of computations that are done in order to advance the system state. First the particle positions and velocities are read from memory, followed by a weighting due to the dependence of charge density calculation on the distance from the particle to the respective grid point. This is followed by an integration of the field equations and a weighting depending on how these fields computed in individual grid points affect each particle.
The basic cycle concludes with the integration of the motion equations in order to accordingly update the particle positions and velocities. For the first time step, before the basic cycle starts, the initial conditions of the system are read from an input file (the initial particle positions and velocities, the system density). The visual representation of a basic computational cycle can be seen in Figure 9.
Chapter 2. Basic introduction in the Particle-In-Cell method for laser-plasma interaction numerical modeling
37
Figure 9. Basic computational cycle of a PIC code. Optional modules with dotted line.
The time advances each step by a value equal to Δt. The size of this parameter is chosen in respect to the physical phenomena that concern us. A shorter time step is needed when dealing with small mass particles, due to the higher plasma frequency, while, when having heavier particles, a longer time step can be used. If the purpose of the simulation is to study low frequency effects, a longer time step can be used, which in turn will also shorten the simulation time.
The number of integrations in such a simulation is also important because we have a large number of such computations in every cycle. For each particle in the system, we have two integrations per grid point, one for the equation of motion and another integration for the field. For example, for a simulation of a system with 10000 particles with 1000 time steps on 1000 grid points we will have 1011 integrations. This fact makes the choice of the numerical method used very important.
Computer memory is something else that has to be taken into account. The minimum information required to perform the integration is the particle coordinates and velocity. For the example given previously, this will amount to 20000 entries. If the method used is a high-order one (e.g., Runge-Kutta), then data from the previous time steps has to be saved, which not only increases the memory requirements, but also increases the number of operations done for each particle. This is the reason why it is crucial to save the

![Figure 4. Strongly coupled system schematic [75]. E is the detector, and in blue we have the signal from the detector](https://thumb-eu.123doks.com/thumbv2/123doknet/12706130.355843/31.918.200.685.104.409/figure-strongly-coupled-schematic-detector-blue-signal-detector.webp)
![Figure 5. Schematic of a weakly coupled system [75]. E is the detector, and in blue we have the signal from the detector](https://thumb-eu.123doks.com/thumbv2/123doknet/12706130.355843/32.918.235.725.213.518/figure-schematic-weakly-coupled-detector-blue-signal-detector.webp)
![Figure 7. Interaction between two charged finite size particles [75]. Inter-particle force plotted for 3 different particle radii (point particle, 0.5 D and D )](https://thumb-eu.123doks.com/thumbv2/123doknet/12706130.355843/37.918.220.654.109.523/figure-interaction-charged-particles-particle-different-particle-particle.webp)
![Figure 8. System composed from finite-size particles [75]. E is the detector, and in blue we have the signal from the detector](https://thumb-eu.123doks.com/thumbv2/123doknet/12706130.355843/38.918.248.706.338.632/figure-composed-finite-size-particles-detector-signal-detector.webp)
![Figure 10. Leap-frog integration schematic (adapted from [77]).](https://thumb-eu.123doks.com/thumbv2/123doknet/12706130.355843/42.918.235.698.104.361/figure-leap-frog-integration-schematic-adapted.webp)
![Figure 11. Zero and first order weighting and the virtual shape of the particles they produce (adapted from [77])](https://thumb-eu.123doks.com/thumbv2/123doknet/12706130.355843/45.918.113.780.255.505/figure-zero-order-weighting-virtual-particles-produce-adapted.webp)
