University of Sherbrooke
Brain energy metabolism in older adults:
Implications for the risk of age-related cognitive decline
By Scott Nugent
Doctorate program in Physiology
Thesis presented to the Faculty of Medicine and Health Sciences in partial fulfillment of the requirements for the philosophiae
doctor (Ph.D.) degree in Physiology
Sherbrooke, Québec, Canada May, 2014
Members of the jury
Pr. Ahmed Chraibi, Department of Physiology and Biophysics Pr. Stephen Cunnane, Department of Physiology and Biophysics
Pr. Maxime Descoteaux, Department of Informatics
Dr. Pedro Rosa-Neto, Departments of Neurology & Neurosurgery and Psychiatry, McGill © Scott Nugent, 2014
Brain energy metabolism in older adults:
Implications for the risk of age-related cognitive decline By
Scott Nugent
Doctorate program in Physiology
Thesis presented to the Faculty of Medicine and Health Sciences in partial fulfillment of the requirements for the philosophiae doctor (Ph.D.) degree in Physiology, Faculty of Medicine and Health Sciences, University of Sherbrooke, Sherbrooke, Quebec, Canada,
J1H 5N4.
Normal aging is accompanied by several metabolic and structural changes in the brain and a heightened risk of cognitive decline. These brain changes may increase the chances of later developing Alzheimer’s disease. The first major objective of the present work was to quantify, through positron emission tomography (PET) and volumetric magnetic resonance (MR) imaging techniques, the effects of normal aging on brain metabolism and structure. Our results indicate that brain glucose hypometabolism can be present in older individuals who remain cognitively normal. Cognitive status was assessed using age-normalised neuropsychological tests. Brain glucose hypometabolism was quite specific and affected primarily the prefrontal cortex and the caudate nucleus. Due to the high variation in plasma ketones, brain ketone hypometabolism per se was not present in older persons (≥65 years old). However, a lower rate constant for brain ketone uptake was fairly widespread in our healthy older group. Lower regional brain volume during normal aging was widespread throughout the cortex and was more apparent than cortical thickness loss. The second major objective was to characterize brain ketone and glucose metabolism in the context of mild Alzheimer’s disease. Glucose hypometabolism in Alzheimer’s disease was present in the temporoparietal cortex when compared with cognitively normal older adults. However, no significant differences in brain ketone metabolism or rate constant were found between the two groups. Alternative energy sources to glucose may therefore be beneficial to the Alzheimer’s disease brain, at least early in the disease process, in order to maintain neuronal capacity and limit synaptic loss and decline in memory and cognition.
Keywords : brain metabolism, glucose, ketones, aging, positron emission tomography, nuclear magnetic resonance spectroscopy
iv
RÉSUMÉ
Métabolisme énergétique du cerveau chez les personnes âgées: implications pour le risque de déclin cognitif lié au vieillissement
Par Scott Nugent
Programme de doctorat en physiologie
Thèse présentée à la Faculté de médecine et des sciences de la santé en vue de l’obtention du diplôme de philosophiae doctor (Ph.D.) en physiologie, Faculté de médecine et des sciences de la santé, Université de Sherbrooke, Sherbrooke, Québec, Canada, J1H 5N4.
Au cours du vieillissement normal, le cerveau va subir plusieurs changements métaboliques et structuraux qui vont accroitre le risque de déclin cognitif et du fait même augmenter le risque de développer la maladie d’Alzheimer. Les objectifs du présent travail étaient de: 1) quantifier l’effet du vieillissement normal sur la structure et le métabolisme du cerveau, grâce aux techniques d’imagerie tomographie par émission de positons et l’imagerie par résonance magnétique ; 2) caractériser le métabolisme cérébral des deux substrats énergétiques du cerveau, le glucose et les cétones, dans un contexte de la maladie d’Alzheimer. Nos résultats indiquent qu’un hypométabolisme du glucose est présent chez des personnes âgées (65 ans et plus) qui démontrent pourtant une cognition normale. Cette diminution du métabolisme cérébral du glucose est observée spécifiquement au niveau des régions du cortex préfrontal et du noyau caudé. Du fait d’une grande variabilité au niveau des concentrations plasmatiques en cétones, aucune diminution du métabolisme des cétones n’a été constatée chez les personnes âgées. En revanche, la constante de transfert des cétones au cerveau était globalement diminuée. En ce qui concerne l’atrophie cérébrale au cours du vieillissement normal, nous avons observé qu’elle était globale, qu’elle concerne l’ensemble du cerveau et qu’elle était plus marquée que la diminution de l’épaisseur corticale. En comparant des personnes âgées en bonne santé à des personnes ayant la maladie d’Alzheimer, nous avons également confirmé que chez ces dernières, le métabolisme du glucose est diminué spécifiquement au niveau du cortex temporopariétal. Cependant, aucune différence entre les deux groupes de personnes n’a été observée en ce qui concerne le métabolisme cérébral des cétones. Ainsi en fournissant des substrats énergétiques autres que le glucose, il serait donc possible de maintenir les capacités neuronales, limiter la perte synaptique et ralentir le déclin cognitif. Ceci pourrait constituer une stratégie prometteuse dans la prévention et le traitement complémentaire au début de la maladie d’Alzheimer.
Mots clés : métabolisme cérébral, glucose, cétones, tomographie par émission de positons, spectroscopie par résonance magnétique nucléaire
RÉSUMÉ ... IV TABLE OF CONTENTS ... V LIST OF FIGURES ... VII LIST OF TABLES ... VIII
LIST OF ABBREVIATIONS ... 1
1. OVERVIEW ... 3
2. BACKGROUND AND LITERATURE REVIEW ... 6
2.1THE HUMAN BRAIN ... 6
2.1.1 The brain’s high use of energy ... 6
2.1.2 Energy required for cellular signaling ... 9
2.1.3 Glucose is the principal source of energy for the brain ... 12
2.1.4 Ketones are an important alternative source of energy for the brain ... 16
2.2NEUROIMAGING ... 25
2.2.1 Magnetic resonance (MR) imaging ... 25
2.2.2 Positron emission tomography (PET) ... 26
2.3AGING RELATED CHANGES IN BRAIN STRUCTURE AND METABOLISM ... 44
2.3.1 Structure ... 44
2.3.2 Brain energy/fuel metabolism ... 47
2.4COGNITIVE TESTING ... 53 3. RATIONALE ... 54 4. HYPOTHESES/OBJECTIVES ... 56 MANUSCRIPT #1 ... 56 Hypothesis ... 56 Objectives ... 56 Rationale ... 56 MANUSCRIPT #2 ... 56 Hypothesis ... 56 Objectives ... 57 Rationale ... 57 MANUSCRIPT #3 ... 57 Hypothesis ... 57
vi Objectives ... 57 Rationale ... 57 5. MANUSCRIPT #1 ... 59 6. MANUSCRIPT #2 ... 90 7. MANUSCRIPT #3 ... 123 8. DISCUSSION ... 153 8.1BRAIN ATROPHY ... 153
8.2BRAIN ENERGY METABOLISM IN AGING ... 156
8.2.1 Brain glucose metabolism ... 156
8.2.2 Brain acetoacetate metabolism ... 162
8.3RELATIONSHIP BETWEEN BRAIN GLUCOSE AND KETONE UPTAKE ... 165
8.3.1 Acetoacetate index (AI) ... 167
8.4THE FATE OF GLUCOSE ... 168
8.4.1 The prefrontal cortex ... 170
8.4.2 Neural and glial density in the prefrontal cortex ... 171
8.4.3 Resistance from oxidative stress ... 173
8.5CORRELATIONS BETWEEN PLASMA PARAMETERS AND BRAIN FUEL METABOLISM ... 174
8.6INFLUENCE OF SYNAPTIC DENSITY LOSS... 174
8.7KETONE SUPPLEMENTATION ... 177
8.8METABOLIC PHENOTYPE OF THE COGNITIVELY HEALTHY ELDERLY ... 180
8.9CONCLUSIONS ... 180
8.10LIMITATIONS ... 181
8.11FUTURE DIRECTIONS ... 181
9. ACKNOWLEDGEMENTS ... 183
Figure 2 : The glutamate-glutamine cycle ... 11
Figure 3 : Energy requirements cortical signalling ... 12
Figure 4 : Ketone levels during extended fasting ... 18
Figure 5 : Linear relationship between plasma ketone levels and brain uptake ... 20
Figure 6 : Ketogenesis ... 22
Figure 7 : Ketone pathways ... 23
Figure 8 : Push and pull strategy ... 25
Figure 9 : Partial volume effects ... 29
Figure 10 : 11C-AcAc preparation ... 32
Figure 11 : CMRg onto CMRO2 ... 39
Figure 12 : Glycolytic index ... 41
Figure 13 : Acetoacetate index ... 44
Figure 14 : Glucose hypometabolism during aging ... 50
Figure 15 : Brain regions ... 154
Figure 16 : Percent difference correlation ... 155
Figure 17 : Patlak plot ... 164
Table 2: Correlations between metabolic parameters ... 40 Table 3: Brain glucose hypometabolism, 18F-FDG PET aging studies ... 157 Table 4: Ratio of regional CMRa over global CMRa ... 166
11C-AcAc 11C-PIB 14C-DG 18F-FDG ADNI AcAc ADAS-Cog ATP A-V β-Hb BA CBF CDR CMRg CMRa CSF DMN FDR FFA FWHM GTM GLUT HC HIF-1 MCT MNI MR NADH 1-[11C]acetoacetate [N-methyl-11C]2-(4'-methylaminophenyl)-6-hydroxybenzothiazole 2-deoxy-D-[14C]glucose 2-deoxy-2-[18F]fluoro-D-glucose
Alzheimer's Disease Neuroimaging Initiative Acetoacetate
Alzheimer’s Disease Assessment Scale-Cognitive Subscale Adenosine triphosphate
Arteriovenous
Beta-hydroxybutyrate Brodmann’s area Cerebral blood flow Clinical Dementia Rating
Cerebral metabolic rate of glucose Cerebral metabolic rate of acetoacetate Cerebrospinal fluid
Default mode network False discovery rate Free fatty acids
Full width at half-maximum Geometric transfer matrix Glucose transporter Healthy controls
Hypoxia-inducible factor 1 Monocarboxylate transporter Montreal Neurological Institute Magnetic resonance
2 NADPH NMR PET PVE PPP SPM ROI ROS
Nicotinamide adenine dinucleotide phosphate Nuclear magnetic resonance
Positron emission tomography Partial volume effect
Pentose phosphate pathway Statistical parametric mapping Region of interest
3
1. OVERVIEW
Aging is accompanied by several metabolic and structural changes in the brain as well as a heightened risk of decline in cognitive function. The structural changes in the brain typically involve decreases in regional volume and cortical thickness which are thought to be the result of neuronal and synaptic loss. The uptake and metabolism of the principal energetic substrate used by the brain, glucose, is also adversely affected. Several studies indicate that these structural and metabolic changes are taking place during what is considered ‘cognitively normal’ aging. These aging-related changes in the brain are generally not debilitating and do not significantly affect an individual’s quality of life. It is important to be able to distinguish between the normal physiological aging process and the pathological aging process; only the latter involves rapidly deteriorating brain function and leads to dementia. Quantification of the degree of hypometabolism will more easily allow the distinction of the normal aging process from the pathogenic aging process which progresses to late onset Alzheimer’s disease.
Alzheimer’s disease has been extensively studied since its discovery by Alois Alzheimer in 1907 (Alzheimer, 1907). The disease is characterized by a progressive decline in episodic memory function which is often followed by a decline in verbal fluency, attention and visuospatial function. Disease progression often leads to the onset of depression, increased anxiety and problems with activities of daily living, which eventually become self-debilitating (Scheff et al., 2014). Aging is the primary risk factor for Alzheimer’s disease, which is the most prevalent form of dementia. With an increasing life expectancy and aging populations worldwide, Alzheimer’s disease is becoming a substantial public health concern. The disease affects approximately 10% of individuals over 65 years of age, with the prevalence doubling every 5 years. Approximately half of individuals over the age of 85% are affected (Kukull et al., 2002). To date, no therapy has been able to reverse symptoms or even halt the underlying disease process. With the failure of the latest therapeutic strategies, many researchers have suggested the need to target, at the earliest stage possible, individuals who are the most at risk of developing Alzheimer’s disease using both chemical and neuroimaging biomarkers. Commonly studied biomarkers include
4 amyloid-β and tau concentrations in cerebral spinal fluid, as well as amyloid-β and glucose accumulation in the brain, and atrophy. Currently, once an individual has received a diagnosis of Alzheimer’s disease the underlying processes are already well underway. Although imaging techniques have shown great promise in the early detection of Alzheimer’s disease, there is still a lack of standardized diagnostic tests (Mosconi, 2013). This greatly inhibits the potential for an accurate and early diagnosis.
Neuroimaging studies have suggested that the metabolism of the brain’s principal energy substrate, glucose, is decreased in specific regions in individuals at genetic or increased lifestyle risk of developing Alzheimer’s disease. Glucose hypometabolism can be present well before any measurable declines in cognition are found (Baker et al., 2011; Cunnane et al., 2011; Mosconi et al., 2006; Reiman et al., 1996; Reiman et al., 1998; Scholl et al., 2011). Although considerable research has focused on brain glucose uptake, very little has studied the main back-up fuel used by the brain, ketones. Ketones are an important source of fuel for the brain when concentrations of glucose decrease in the blood between meals. They are also particularly important for infant development and in adults during periods of fasting and during prolonged exercise.
The principal aim of the present work was to quantify, through neuroimaging techniques, the effects of normal aging on brain metabolism and structure. Secondary aims included the characterization of the brain’s metabolism of ketones and glucose, in the context of mild Alzheimer’s disease. The first two manuscripts, for which I am the first author, study the effects of aging on brain glucose and ketone metabolism. The third manuscript, for which I am the second author, studied brain glucose and ketone metabolism in the context of mild Alzheimer’s disease.
The typical hypometabolic pattern in Alzheimer’s disease involves the temporoparietal and posterior cingulate cortex early in the disease, with later progression to the frontal cortex. The quantification of brain glucose and ketone metabolism during normal aging and at an early stage of Alzheimer’s disease may serve as a basis for differentiating what is normal from what is pathogenic brain aging. It may also provide some insight into therapeutic
5 strategies that could potentially be employed to reduce the risk of cognitive decline with age by correcting, or bypassing brain glucose hypometabolism (Cunnane et al., 2011). This thesis will begin by discussing brain energy requirements in general and then focus on the two sources of brain energy, glucose and ketones. Attention will then shift to the development of neuroimaging techniques and their use in calculating brain glucose and ketone metabolism during normal aging and in Alzheimer’s disease. The functional and anatomical changes in the brain associated with normal aging and Alzheimer’s disease will also be discussed. Next, the three manuscripts will be presented. Finally, conclusions and discussion will be based on results from the three manuscripts.
6
2. BACKGROUND AND LITERATURE REVIEW
2.1 The human brain
Neuronal signalling is necessary to allow proper functioning of the brain as it results in sensory perception, motor movement, conscious thought, reasoning and language (Lui et al., 2011). Though the lobes of the brain are highly interconnected they may still be associated with specific functionality. Common functions of the frontal lobe include attention control, problem solving, working memory and emotion regulation. The temporal lobe deals mainly with auditory and visual memories as well as language. The parietal lobe is involved in somatosensation and spatial cognition. Finally, the occipital lobe deals exclusively with visual information (Ribas, 2010).
2.1.1 The brain’s high use of energy
Though the adult human brain comprises just 2 percent of the body’s weight, it consumes about 23 percent of the body’s overall resting energy requirements, mainly in the form of glucose (Holliday, 1971; Kety, 1957; Sokoloff, 1960b). Considerable energy is required to sustain the cells that make up the human brain. Recent studies estimate there are 86 billion neurons and an equal number of supportive glial cells in the human brain (Herculano-Houzel, 2009; Herculano-(Herculano-Houzel, 2012; Lui et al., 2011). Many papers still cite the traditional 100 billion neurons with a ratio of glial to neuronal cells of 10:1 (Doetsch, 2003; Nishiyama et al., 2005; Noctor et al., 2007; Ullian et al., 2001). In contrast to peripheral tissues the brain lacks the cellular mechanisms necessary to produce glucose or store energy in any significant amount, such as from fat or glycogen. Neurons depend almost entirely on glucose uptake, from blood, for the production of adenosine triphosphate (ATP) (Attwell and Laughlin, 2001). This makes it necessary for energy to be continuously produced peripherally and transported into the brain in order to maintain neuronal activity. Consequently, the brain is extremely sensitive to decreases in energy availability, such as during anoxia or ischemia (Khatri and Man, 2013).
7 Neurons have the ability to communicate with each other. A neuron receives inputs at its postsynaptic dendrites. Electrical action potentials then propagate along the axon and stimulate the liberation of neurotransmitters from presynaptic terminal buttons for chemical communication with the dendrites of an adjoining neuron.
There are several different types of neurons which are commonly differentiated based on their appearance. More common neurons include pyramidal neurons which have a triangular shaped soma and project relatively long distances (Shipp, 2007). They are the most numerous excitatory neuron in the brain and utilize the neurotransmitter glutamate. Pyramidal neurons are believed to play an important role in cognition. Deficits in their function appear to be involved in neurodegenerative diseases (Mosconi, 2013). Next in abundance, interneurons, project more locally than pyramidal neurons, as they do not enter white matter. They are also typically inhibitory and utilize the neurotransmitter, gamma-aminobutyric acid (Shipp, 2007). Other neurons commonly found in the brain include sensory and motor neurons.
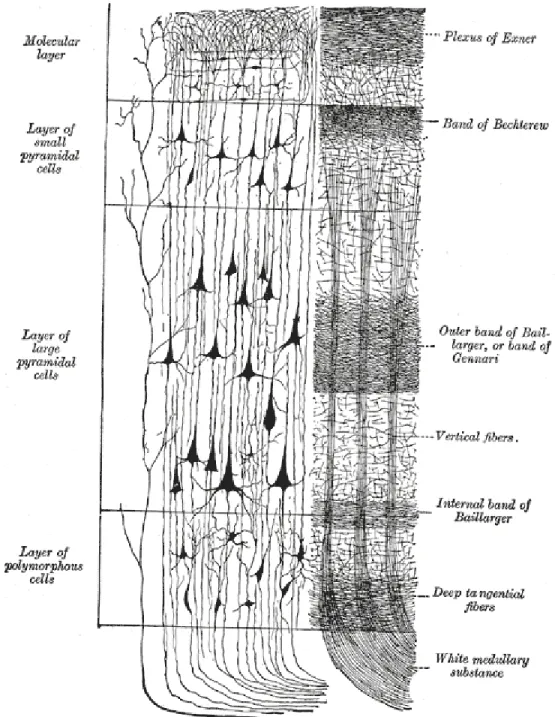
The cerebral cortex is also divided into several layers that are used to differentiate different brain regions based on cytoarchitecture (Figure 1). Information is processed and distributed to other regions as it passes from one layer to the next. Specific types of neurons are more commonly present in each layer (Shipp, 2007).
1. Layer one, the outermost layer, consists mainly of incoming axons from either other regions of the cortex, the thalamus or upper internal layers of the cortex (Shipp, 2007).
2. Layer two, the external granular layer, is comprised of small pyramidal and stellate cells which are star shaped neurons and may be inhibitory or excitatory.
3. Layer three, the external pyramidal layer, contains pyramidal neurons arranged in a horizontal formation that allows communication with the adjacent cortex.
4. Layer four contains many stellate cells and horizontally arranged nerve fibers. 5. Layer five contains less dense pyramidal cells that are larger than those in the
external pyramidal layer. This layer projects to many regions of the brain with efferent neurons.
8 6. Layer six contains irregular fusiform cells. All axons pass through this layer and
enter the white matter to connect with other regions of the brain (Shipp, 2007).
Figure 1 : Layers of the cerebral cortex
Illustration of the layers of the cerebral cortex and the afferent and efferent pathways. The average thickness brain’s cortex is 2.5mm. Reprinted from Henry Gray, Anatomy of the Human Body , 20th U.S. edition (1918), public domain.
9
2.1.2 Energy required for cellular signaling
Neurons are chemically and electrically excitable which requires them to continually maintain voltage gradients across their membranes in order to participate in proper communication. In vitro and in vivo studies have indicated that the majority of glucose consumed by the brain is used to maintain excitatory glutamate neurotransmission. Glutamate is the brain’s most common neurotransmitter. Excitatory neurons outnumber inhibitory neurons by a factor of 9 to 1 (Attwell and Iadecola, 2002; Shulman et al., 2004). Glucose uptake has been shown to be approximately equal to the rate at which glutamate is converted to glutamine in the brain (Sibson et al., 1998). Based on data from rodents, Attwell and Laughlin (2001) estimated the specific energy requirements of each of the distinct processes involved in glutamate neurotransmission. These include energy used for action potential propagation, Ca2+ mediated release of glutamate vesicles from the pre-synapse, the restoration of ionic gradients in postsynaptic neurons following glutamate receptor binding, and the recycling of synaptic glutamate through astrocytes. Rates of ATP use is estimated to vary between 8.2 × 10⁹ and 1.3 × 10⁸ molecules per second for various types of neurons (Howarth et al., 2012).
2.1.2.1 Energy needed for action potentials
Action potentials are the result of ion movements along the length of the axon. This process requires activation of Na+/K+ pumps in order to restore ionic gradients. Recent studies have revealed that the propagation of action potentials is much more efficient than previously thought (Alle et al., 2009; Carter and Bean, 2009; Sengupta et al., 2010). It is estimated that 3.1 × 10⁸ Na+ ions are required for the propagation of a single action potential through a neuron (Howarth et al., 2012). Following the propagation of an action potential, intracellular Na+ is pumped back out of the cell which requires an estimated 3.8 × 10⁸ ATP (Attwell and Laughlin, 2001).
2.1.2.2 Presynaptic Ca2+ vesicle release
The arrival of an action potential at the presynaptic dendrites triggers the opening of voltage gated Ca2+ channels and entry of Ca2+ into the presynaptic cytosol. The influx of
10 calcium launches a biochemical cascade that causes vesicles to fuse with the presynaptic membrane and release glutamate into the synapse. The mechanism responsible for pumping out calcium that entered the cytosol is estimated to consume 12,000 ATP per vesicle released (Attwell and Laughlin, 2001).
2.1.2.3 Postsynaptic actions of glutamate
Energy is required for the restoration of ion gradients invoked by the activation of receptors by glutamate. Glutamatergic receptors include AMPA, N-methyl-d-aspartate (NMDA) and Kainate receptors. The postsynaptic effects on glutamatergic receptors following the release of one vesicle of glutamate requires approximately 140,000 ATP molecules for each vesicle (Attwell and Laughlin, 2001). AMPA and Kainate receptors both function as cation channels permeable to Na+ and mediate fast excitatory synaptic transmission. NMDA receptors are more permeable to Ca2+ and mediate longer lasting excitatory synaptic transmission.
2.1.2.4 Glutamate recycling
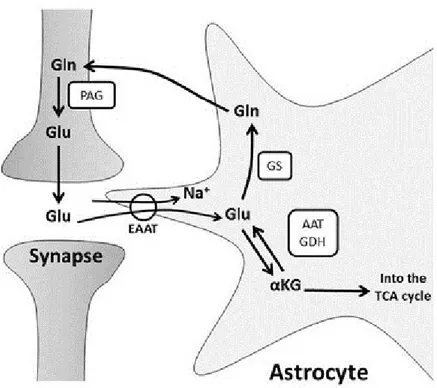
The process of glutamate recycling involves the uptake of glutamate from the synapse by astrocytes (Figure 2). Glutamate is then converted to glutamine which is then transported back into neurons, along with its concomitant transformation into α-ketoglutarate and aspartate. This process is estimated to consume an estimated 11,000 ATPs per glutamate vesicle (Attwell and Laughlin, 2001).
11 Figure 2 : The glutamate-glutamine cycle
Illustration of glutamate recycling of via glutamine by astrocytes and the subsequent reuptake by neurons. Glu (Glutamate), Gln (Glutamine), EAAT (Excitatory amino acid transporter), GS (Glutamine synthase), GDH (Glutamate dehydrogenase), AAT (aspartate aminotransferase), PAG (phosphate-activated glutaminase). “The glutamate-glutamine cycle” by (Stobart and Anderson, 2013) is licensed under CC BY 3.0.
Estimates of energy use in the cerebral cortex have been calculated based on these findings (Figure 3). Synaptic transmission includes the restoration of ion gradients invoked by the activation of postsynaptic receptors by glutamate (50%), Ca2+ mediated presynaptic neurotransmitter release (5%) and glutamate recycling (4%). Action potential propagation consumes an estimated 21% while the maintenance of resting potentials requires 20% (Howarth et al., 2012). Therefore, the majority of energy in the cerebral cortex is used for synaptic transmission, totalling 59%. Another energy demanding process, not directly related to cellular signalling, is brain phospholipid metabolism. This process is thought to consume up to 20% of total ATP consumption by the brain (Purdon et al., 2002).
12 Figure 3 : Energy requirements cortical signalling
Estimated energetic requirements of cortical signalling. Synaptic transmission includes the processes of postsynaptic glutamate receptor activation (50%), presynaptic neurotransmitter release (5%), and glutamate recycling (4%). Action potential propagation (21%), and maintenance of resting potentials (20%) comprise the remaining energy requirements. Adapted by permission from Macmillan Publishers Ltd: Journal of Cerebral Blood Flow & Metabolism (Howarth et al., 2012), Copyright (2012).
Glucose consumption during neuronal activation also involves astrocytes. Astrocytes are localized in close proximity to neurons, often found wrapping around the synaptic cleft (Khatri and Man, 2013). It has been suggested that during synaptic transmission astrocytes sense neuronal activation and stimulate astrocytic glucose uptake (Khatri and Man, 2013). Some researchers have also proposed that glucose is taken up by astrocytes, converted into lactate, and released into the cytosol to be taken by neurons and used for ATP generation (Magistretti and Pellerin, 1999).
2.1.3 Glucose is the principal source of energy for the brain
Glucose (C6H12O6) is the principal energetic substrate used by the brain. Its metabolism
generally involves glycolysis, followed by entry into the Krebs’ cycle and associated oxidative phosphorylation. The result of these enzymatic reactions is the production of 38
13 molecules of ATP from the complete oxidation of one molecule of glucose to carbon dioxide and water, according to the following equation (Shulman et al., 2001).
Formula 1:
2.1.3.1 Transport of glucose
Glucose is a highly hydrophilic molecule that requires specific transporters to cross the blood brain barrier and enter cells. Three transporters are primarily expressed in specific cell types (Maher et al., 1994). Two forms of GLUT1 with molecular weights of 55 and 45 kDa are widely prevalent in the brain. The 55 kDa form is expressed exclusively in endothelial cells and the 45 kDa form is found in astrocytes (Morgello et al., 1995). GLUT3 is responsible for the transport of glucose into neurons (Maher and Simpson, 1994). Apart from these three main transporters in the brain, other glucose transporters have been described. The GLUT5 transporter is localized in microglial cells which are involved in immune and inflammatory responses of the nervous system, though they have a lower affinity for glucose (Maher et al., 1994; Simpson et al., 2007). GLUT2 is selectively localized in astrocytes and participates in the central regulation of feeding behavior and insulin release. The insulin-dependent glucose transporter, GLUT4, is localized in endothelial cells, but in relatively lower concentrations (McCall et al., 1997). All GLUTs involve energy-independent transport which establishes an equilibrium in glucose concentrations across membranes and not an accumulation of glucose inside cells (Simpson et al., 2007). The transporters are also bidirectional, allowing for transport in and back out of cells (Simpson et al., 2007). Higher metabolic activity in neurons has the effect of pulling glucose into the cell due to decreased intracellular glucose concentrations. A buildup of glucose-6-phosphate inside the cell has a negative feedback effect on hexokinase. This inhibits the conversion of glucose into glucose-6-phosphate which stops the entry of additional glucose into the cell.
14 2.1.3.2 Glycogen storage in the brain
Glycogen serves as the main storage form of glucose in the body. In humans, glycogen is made and stored primarily in liver cells and muscles. Glycogen is present in the brain in much lower concentrations (Brown and Ransom, 2007). Muscle glycogen is converted into glucose and metabolized by muscle cells. Liver glycogen gets converted to glucose for use throughout the body, including the brain. The concentration of adult brain glycogen is between 0.5 and 1.5 µmoles per gram of brain tissue and is found predominantly in astrocytes (Saez et al., 2014). This suggests, that in the absence of glucose, brain glycogen would be completely consumed in a few minutes (Brown and Ransom, 2007). Glycogen appears to play an important role in promoting neuronal survival during periods of hypoxia (Saez et al., 2014). Brain glycogen also accumulates during sleep while sleep deprivation causes brain glycogen to decrease (Brown, 2004).
2.1.3.3 Glycolysis
Glycolysis is the process via which glucose gets converted into pyruvate. One molecule of glucose is converted into two molecules of pyruvate and results in the production of two molecules of ATP. After the transport of glucose into the brain, under anaerobic conditions, it is converted to lactate via the enzyme lactate dehydrogenase. Even under aerobic conditions some lactate production is necessary in order to allow the regeneration of nicotinamide adenine dinucleotide (NAD+). NAD+ is essential for the conversion of glyceraldehyde 3-phosphate to 1, 3-bisphosphoglycerate (Magistretti et al., 1999). The final product of glycolysis is lactate instead of pyruvate if the rate of production of pyruvate from glycolysis surpasses the oxidation of pyruvate by the Krebs’ cycle. Glucose is converted to pyruvate according to the following equation:
Formula 2:
[ ] [ ] [ ]
15 During the first step of glycolysis, in the cytosol, glucose is phosphorylated by hexokinase to form glucose-6-phosphate. This reaction is important because it maintains a low concentration of glucose within the cell and promotes the continuous transport of glucose into the cell. It also prevents glucose from leaving the cell due to the absence of glucose-6-phosphate transporters in the brain. Glucose-6-phosphatase is necessary for the conversion of glucose-6-phosphate into glucose. This enzyme is present in the liver and kidneys, but is absent in the brain. The rate-limiting step of glycolysis is the conversion of fructose-6-phosphate to fructose-1,6-bisfructose-6-phosphate which is catalyzed by the enzyme phosphofructokinase. Next, the conversion of 1,3-bisphosphoglycerate to 3-phospho-glycerate is another important regulatory step. If the cell has sufficient ATP and little ADP, this reaction will not take place. After several intermediate steps, phosphoenolpyruvate is phosphorylated by the enzyme pyruvate kinase to produce pyruvate, which can then enter the mitochondria and undergo further enzymatic degradation under oxidative phosphorylation or be converted to lactate (Magistretti and Pellerin, 1999). Glycolysis has been shown to be primarily astrocytic, whereas oxidation is principally neuronal (Hyder et al., 2006; Pellerin and Magistretti, 1994).
2.1.3.4 Krebs’ cycle and oxidative phosphorylation
Under aerobic conditions pyruvate can be decarboxylated by the enzyme pyruvate dehydrogenase (PDH) for entry into the Krebs’ cycle. This reaction produces acetyl coenzyme A (acetyl-CoA) and releases carbon dioxide. Acetyl-CoA condenses with oxaloacetate to produce citrate. An excess of citrate inhibits phosphofructokinase activity resulting in a decrease in glycolysis and the production of pyruvate. During this series of reactions, each acetyl group is oxidized to form two molecules of carbon dioxide. The energy released is transferred to four electron carrier molecules that form the electron transport chain (Sokoloff and Clarke, 1999). Three pairs of electrons are transferred to NAD+ to produce NADH. Another pair of electrons is transferred to the flavin adenine dinucleotide (FAD+) to produce its reduced form FADH2.
Oxidative phosphorylation is the process by which high amounts of ATP are produced by cells. NADH and FADH2 products enter the inner mitochondrial membrane where they are
16 re-oxidized, with NADH being converted to NAD+ and FADH2 to FAD+. The result is the
production of electrons that pass through four complexes embedded in the inner mitochondrial membrane which make up the electron transport chain (Sokoloff and Clarke, 1999). These complexes are NADH dehydrogenase (Complex I), succinate dehydrogenase (Complex II), cytochrome bc1 complex (Complex III), and cytochrome c oxidase (COX, Complex IV). Complexes I, III, and IV are proton pumps that, while transferring electrons down the electron transport chain, move H+ across the mitochondrial inner membrane against the concentration gradient. This produces a proton gradient which is used by F0F1
-ATP-synthase (Complex V) to produce ATP via oxidative phosphorylation of ADP to ATP (Sokoloff and Clarke, 1999). Oxidative phosphorylation is essential to the maintenance of cellular homeostasis and function.
2.1.3.5 Non-oxidative glucose consumption
Aerobic metabolism is much more efficient than anaerobic metabolism. Many studies have observed that glucose metabolism does not pass entirely through oxidative phosphorylation, even under aerobic conditions. This non-oxidative glucose consumption process is often referred to as the “Warburg effect.” It is based on research conducted in oncology which showed the importance of aerobic glycolysis in highly proliferating cells (Warburg et al., 1927). Malignant, rapidly growing tumor cells typically had glycolytic rates up to 200 times higher than normal tissues despite oxygen being plentiful. Cancer cells were predominantly producing energy via glycolysis (2 ATP), followed by lactic acid fermentation in the cytosol, rather than by glycolysis followed by oxidation of pyruvate in mitochondria (36 ATP). More recent studies estimate that 12 to 15% of brain glucose metabolized is non-oxidative (Powers et al., 2007; Raichle et al., 1970). Because of the efficiency of oxidation (at least 15 times more ATP yield than glycolysis), more than 99% of the ATP production in resting tissue is still produced by glucose oxidation (Fox et al., 1988).
2.1.4 Ketones are an important alternative source of energy for the brain
Glucose is the principal fuel used by the brain and the two ketones, acetoacetate (AcAc) and beta-hydroxybutyrate (β-Hb), are the main alternative fuels. Ketones are produced from
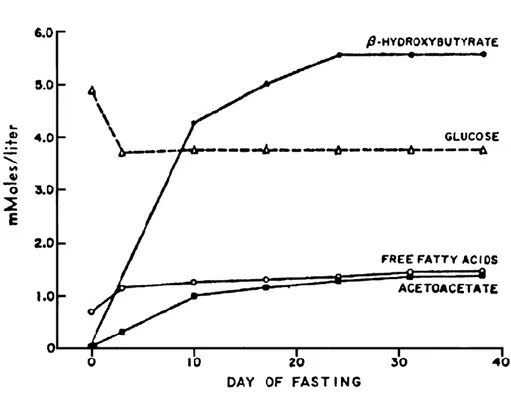
17 free fatty acids (FFA) stored in adipose tissue. In comparison to glucose, ketones have received much less attention. Owen et al. (1967) performed a key study which demonstrated that ketones were an important energy substrate for the brain. Previous studies had only pointed to glucose as being the significant energetic substrate used by the brain. Owen et al. (1967) were perplexed by the ability of humans to be able to fast for extended periods of time. The authors designed a study in which three obese participants underwent an extended period of fasting which averaged forty days. During this time the participants were only permitted to consume one multivitamin capsule and 1500 ml of water each day. The authors used the arteriovenous (A-V) difference technique (Kety and Schmidt, 1948) in order to evaluate the production and use of metabolites by the brain. A catheter was introduced into the brachial artery which was then passed into the aortic root. Another catheter was introduced into the internal jugular bulb and hepatic vein. Blood samples were then drawn simultaneously from venous and arterial catheters and measured for oxygen and carbon dioxide content, as well as metabolic substrate concentrations. A negative A-V difference indicates substrate production while a positive value indicates substrate metabolism by the brain. Brain glucose use in participants at baseline was 0.53 mM (Owen et al., 1967). Glucose use by the brain was significantly lower after forty days, at 0.26 mM. Following fasting, there was a production of both lactate and pyruvate by the brain, corresponding to A-V differences of -0.20 and -0.029 mM respectively. After taking into account the amount of glucose being converted to lactate and pyruvate there remains 0.145 mM , which can be converted to ATP. Glucose forms two molecules of lactate and pyruvate each, for this reason the equation is divided by two.
Formula 3:
If cerebral blood flow (CBF) is known, the cerebral metabolic rate (CMR) can be calculated per unit time and normalized for brain volume according to Formula 4 (Gottstein et al., 1971; Lying-Tunell et al., 1980).
18 Formula 4:
Using this formula, the cerebral metabolic rate of glucose (CMRg) can be calculated as the product of the A-V difference and CBF [64 ml/100 g/min, from Lying-Tunell et al. (1980)] then multiplied by a mean hematocrit of 50%. Using the A-V difference results from Owen et al. (1967), CMRg was estimated to be 4.64 µmol/100 g/min. Ketone metabolism was greatly increased and corresponded to a CMR of 12.8 µmol/100 g/min. At this point ketones substitute 73% of the total energy used by the brain (Figure 4). Under normal conditions, while fasted for 6 hours, the CMRg of the healthy adult human brain is ~31 µmol/100 g/min. During these circumstances ketone metabolism only represents 1-3% of total brain energy metabolism (Cunnane et al., 2011).
Figure 4 : Ketone levels during extended fasting
During normal conditions ketones represent 1-3% of total brain metabolism. After fasting for an average of 40 days ketones represented 73% of total brain metabolism. Reproduced from The New England journal of medicine (Cahill, 1970), Copyright (1970), with permission from Massachusetts Medical Society.
19 The patients included in the study conducted by Owen et al. (1967) did not show any deficits in psychometric testing and electroencephalographic recordings remained normal. In another study, infusion of β-Hb (β-Hb = 1.7 mM) during insulin induced hypoglycemia (glucose = 2.4 mM) was found to protect from cognitive dysfunction (Veneman et al., 1994). These findings suggest that ketones were able to supply the required energy for maintenance of normal brain function during the period of extended fasting.
Gottstein et al. (1970) studied ketone metabolism in the brain under more normal conditions (fasted for twelve hours) in twenty nine individuals. The A-V difference technique was used to simultaneously draw blood from the femoral artery and the superior bulb of the internal jugular vein. There was significant use of ketones by the brain after twelve hours of fasting. There was also a significant positive correlation between arterial plasma ketone concentrations and A-V differences. As ketone concentrations increased in plasma there is an associated linear increase in ketone uptake by the brain. This linear relationship between ketone plasma concentrations and ketone brain uptake has been observed in several subsequent studies and across a broad range of plasma concentrations. The linear relationship between brain ketone uptake and plasma ketone levels is present from β-Hb concentrations of 0.043 mM (Blomqvist et al., 1995), to 6.67 mM (Owen et al., 1967), representing an order of magnitude of 155 (Figure 5).
Hasselbalch et al. (1995) used PET to measure glucose metabolism following a three day fast in nine healthy participants. The Kety-Schmidt technique was used to measure metabolite use by the brain. Following three days of fasting, cerebral blood flow and the cerebral metabolic rate of oxygen remained unchanged. Plasma glucose concentrations decreased by 36% while the extraction fraction of glucose at the blood brain barrier increased by 55%. Blood β-Hb concentrations increased by a factor of thirteen and AcAc by a factor of six with no change in blood brain barrier extraction fraction. After three days of fasting ketones were supplying 25% of total brain metabolism. Following three days of fasting there was up-regulation at the level of glucose transporters but no changes in ketone transporters (Hasselbalch et al., 1995).
20 Figure 5 : Linear relationship between plasma ketone levels and brain uptake (Gottstein et al., 1970) discovered there was a significant positive linear relationship between blood β-Hb concentrations and β-Hb metabolism in the brain (○ symbol). This relationship was also confirmed with the other ketone tracer acetoacetate (11C-AcAc). Blomqvist et al. (1995), later confirmed this relationship using PET studies (□ symbol). This graph also includes data from Owen et al. (1967), illustrating that the linear relationship is present from β-Hb concentrations of 0.043 mM (Blomqvist et al., 1995) to 6.67 mM ( symbol). Blomqvist et al. (2002) data are also shown ( symbol). Differences in the periods of fasting (12 hours - 40 days) and infusions of non-labelled ketones results in the wide range of plasma concentrations between studies. Adapted from Nutrition (Cunnane et al., 2011), Copyright (2011), with permission from Elsevier.
Brain energy metabolism was also measured following an acute intravenous infusion of ketones (Hasselbalch et al., 1996). Infusion of ketones resulted in a mean blood β-Hb concentration of 2.16 mM. Under these experimental conditions the cerebral uptake of ketones increased from 1.11 to 5.6 μmol/100 g/min with an equivalent decrease in glucose metabolism from 25.8 to 17.2 μmol/100 g/min. Global cerebral oxygen metabolism was not significantly different before (144 μmol/100 g/min) and after (135 μmol/100 g/min) ketone infusion. Thus, as ketones are increasingly taken up by the brain, the brain will cope by decreasing glucose uptake. The unchanged oxygen metabolism indicates an equivalent
0.01
0.1
1
10
0.01
0.1
1
10
100
1
10
100
(Blomqvist et al., 1995) (Owen et al., 1967) (Blomqvist et al., 2002) (Gottstein et al., 1970)Plasma
-hydroxybutyrate
(log mmol/L)
C
M
R
-O H B(l
o
g
mo
l/1
00
g
/m
in
)
%
o
f ce
re
b
ral
m
et
ab
o
lism
fr
o
m
-hy
dro
xy
bu
tyr
at
e
21 amount of carbohydrates are passing through oxidative metabolism before and after acute ketone infusion.
2.1.4.1 Ketone production
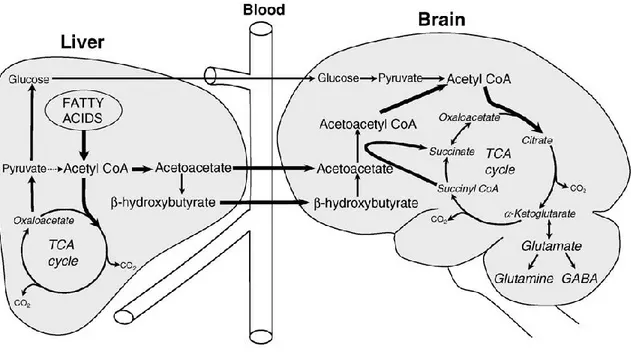
As blood glucose levels decrease the body requires another source of energy. The two ketones, AcAc and β-Hb, will be produced from FFA stores in order to maintain normal body functions. Under normal conditions, insulin inhibits lipolysis, thereby decreasing FFA plasma concentrations. In obesity and insulin resistant states, this important mechanism is disrupted and leads to increases in FFA concentrations (Craft, 2009). Over a period of several hours of fasting, decreased insulin levels allows FFA to be liberated from adipose tissue and enter the circulatory system. FFA are transported to the liver for ketogenesis where they are converted to acetyl-CoA through the process of β-oxidation (Figure 6). Increased FFA oxidation raises the level of acetyl-CoA and NADH in the liver. Very little acetyl-CoA enters the Krebs’ cycle since the intermediates, oxaloacetate and malate, are consumed for glucose production. The high amount of NADH allosterically inhibits the Krebs’ cycle. The accumulating acetyl-CoA will be condensed to ketones through a series of enzyme-catalyzed steps (Melo et al., 2006).
22 Figure 6 : Ketogenesis
The ketogenesis pathway results in the production of ketones from the β-oxidation of free fatty acids in the liver. Ketones are not consumed by the liver but rather enter the blood circulation and are transported predominantly to the brain and heart. Reprinted from Nutrition (Cunnane et al., 2011), Copyright (2011), with permission from Elsevier.
The two ketones, AcAc and β-Hb, then enter blood circulation and are transported to the brain where they are readily taken up and metabolized (Figure 7). The use of ketones in the brain requires that AcAc be reactivated to its CoA derivative, a reaction which takes place in most tissues except the liver. Acetoacetyl-CoA is converted to acetyl-CoA, which in turn enters the Krebs’ cycle for production of energy and metabolic intermediates (Melo et al., 2006).
23 Figure 7 : Ketone pathways
Illustration of ketone production by the liver and subsequent transport to the brain to be used as an energetic substrate. Reprinted from Neurochemistry International (Melo et al., 2006), Copyright (2006), with permission from Elsevier.
Freemantle et al. (2009), performed a study in which they measured ketone levels in three different age groups (23, 50 and 76 years old), following the ingestion of a ketogenic meal. The meal consisted of a ratio of total fat to protein plus carbohydrates of 4.5:1. The ketogenic meal was composed primarily of medium chain triglycerides (8:0 and 10:0 fatty acids) and heavy cream (10:0, 12:0, 14:0, 16:0 and 18:1n-9 fatty acids). There was no differences in fasting baseline concentrations of β-Hb (0.07±0.10, 0.09±0.13, 0.07±0.04 mM) between the young, middle aged, and older groups respectively (Freemantle et al., 2009). Following the ketogenic meal there was no difference between the three groups in their ability to produce and oxidize ketones. Six hours after ingesting the ketogenic drink all three groups had obtained a plasma β-Hb concentration of 1 mM. This suggests older adults have similar fasting plasma ketone concentrations and the same ability to produce and oxidize ketones when compared with younger adults.
2.1.4.2 Transport and metabolism of ketones
Monocarboxylate transporters (MCT) are responsible for the transport of lactate, pyruvate and ketones in the brain. This transport mechanism is completely independent of GLUT
24 mediated glucose transport. There are three main forms of MCTs responsible for ketone transport in the brain. In the adult brain, MCT1 are most abundant in brain microvessels. MCT1 is widespread throughout the newborn brain which is estimated to consume half of its required energy from β-Hb (Cahill, 2006). The high concentrations of MCTs facilitate the transport of ketones during prenatal development and the early days of the suckling period before lactose concentrations increase in colostrum (Cahill, 2006). During the first few days of development, MCTs begin to decrease as lactose concentrations rapidly increase in colostrum. A rapid shift is then made to glucose metabolism during the first few days following birth. MCT2 is expressed almost exclusively in neurons while MCT4 appears to be localized mainly on astrocytes (Simpson et al., 2007).
The transport and metabolism of ketones appears to be driven by a completely separate mechanism than that used by glucose. Glucose uptake by cells is determined by the amount of energy available in the cell. Cells that require more glucose will pull more glucose into the cell to be metabolised. Ketone uptake, on the other hand, appears to be dominated by the concentrations in plasma. If ketones are increased in plasma they will immediately be taken up by the brain and used for energy. If ketones in plasma are sufficiently high and are taken up in great enough concentrations then glucose uptake will decrease in order to accommodate the preferential metabolism of ketones by the brain. This process is illustrated in Figure 8.
25 Figure 8 : Push and pull strategy
Increased glucose demand by the brain has the effect of pulling more glucose into the cells in order to meet energy requirements. Increased concentrations of ketones in the plasma has the effect of pushing more ketones into the brain where there are metabolised in preference to glucose.
2.2 Neuroimaging
Currently, the most common approach for studying the energy metabolism in the brain is with positron emission tomography (PET). The development of the tracer, 2-deoxy-2-[18F]fluoro-D-glucose (18F-FDG), has been a major factor in promoting PET imaging. 18 F-FDG is an analog of glucose which has an attached 18F. Tissues that are especially metabolically active take up large amounts of 18F-FDG which makes them easily visualized on 18F-FDG images.
2.2.1 Magnetic resonance (MR) imaging
The principal of magnetic resonance (MR) imaging relies on the phenomenon of nuclear magnetic resonance (NMR). NMR relies on certain characteristics of hydrogen atoms
26 which are comprised of a single proton. Hydrogen atoms are extremely abundant in the brain as water makes up a large portion of brain volume. Protons are positively charged and give rise to a net magnetic moment along the axis of the spin. When not exposed to a magnetic field the spins of each proton is random and they cancel each other. When placed in an MR scanner, the strong magnetic field has the ability to align the magnetic moments of the protons to that of the scanner. The net magnetization of all protons, within a certain volume, is represented by a vector with a longitudinal component parallel to the magnetic field of the scanner and a transverse component perpendicular to the field. The nuclei also precess at a random phase about the field with an angular frequency that is determined by the Lamor frequency. A radiofrequency pulse is then applied which aligns the phase of precession and pushes the nuclei towards the transverse plane. When the radiofrequency pulse is removed the nuclei will return to equilibrium. At this point the magnetization vector of the nuclei will come back into alignment with the scanner’s magnetic field while releasing absorbed energy from the radiofrequency pulse. Longitudinal relaxation is the restoration of the net magnetization along the longitudinal direction and is described by the time constant T1. Transverse relaxation is the loss of net magnetization in the transverse plane due to the loss of phase coherence and is described by the time constant T2. T1 and T2 time constants vary by tissue type which enables them to identify boundaries between grey matter, white matte and cerebral spinal fluid (Bertholdo et al., 2013).
2.2.2 Positron emission tomography (PET)
The first studies aimed at calculating cerebral metabolism employed the A-V difference technique. Kety and Schmidt determined that CBF in healthy adults was equivalent to 54 ml for 100 g of brain tissue, per minute. With this value, the consumption of oxygen by the brain has been estimated to be 156 µmol/100 g/min (Sokoloff, 1960a).
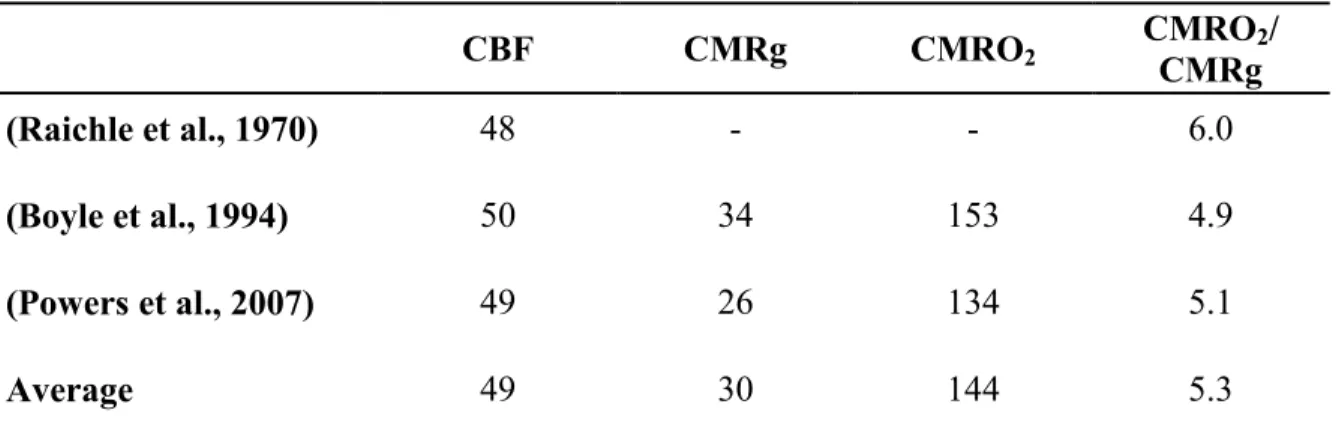
Boyle et al. (1994) measured A-V differences and found that the average brain glucose metabolism in a group of healthy young participants (mean age 25±2 years) was 34 µmol/100 g/min. Oxygen use was 153 µmol/100 g/min while cerebral blood flow was found to be 50 ml/100 g/min. This results in an oxygen to glucose molar ratio of 4.9:1 (Table 1). Interestingly, the authors also found that the ratio of oxygen to glucose
27 metabolism increased during sleeping to 5.3. Incidentally, the A-V technique is quite invasive as it requires the cannulation of the internal jugular and the femoral or brachial artery. The technique also only allows for the calculation of global changes in substrate concentrations across the whole brain.
Table 1: Brain metabolism
CBF CMRg CMRO2 CMROCMRg 2/
(Raichle et al., 1970) 48 - - 6.0
(Boyle et al., 1994) 50 34 153 4.9
(Powers et al., 2007) 49 26 134 5.1
Average 49 30 144 5.3
Powers et al. (2007), Boyle et al. (1994) and Raichle et al. (1970) calculated the cerebral metabolic rate of glucose (μmol/100 g/min) and oxygen (μmol/100 g/min) as well as cerebral blood flow (ml/100 g/min).
With the advancement of the autoradiographic method using 2-deoxy-D-[14C]glucose (14 C-DG), researchers had a new opportunity to study the metabolism in specific brain regions (Sokoloff et al., 1977). Still, autoradiographic studies measuring cerebral glucose metabolism require the animal to be sacrificed for quantification of 14C-DG consumption. With the development of techniques such as positron emission tomography (PET) and single-photon emission computed tomography, it was possible to measure in vivo cerebral glucose metabolism (CMRg), oxygen uptake (CMRO2) and cerebral blood flow (CBF) in
humans (Valk et al., 2003). These imaging methods have been widely used to characterize the pathophysiology of disease and to evaluate the effectiveness of various medical treatments.
Tracer uptake is detected through imaging due to the unique properties of positron decay and annihilation. Radioisotopes have an excess positive charge in their nuclei, the proton will decay into a neutron with the release of a positron. The positron will travel a short
28 distance through the tissue before it annihilates on contact with an electron. This results in the emission of two 511 keV photons at 180° which may be detected by the PET scanner. 2.2.2.1 Partial volume effect
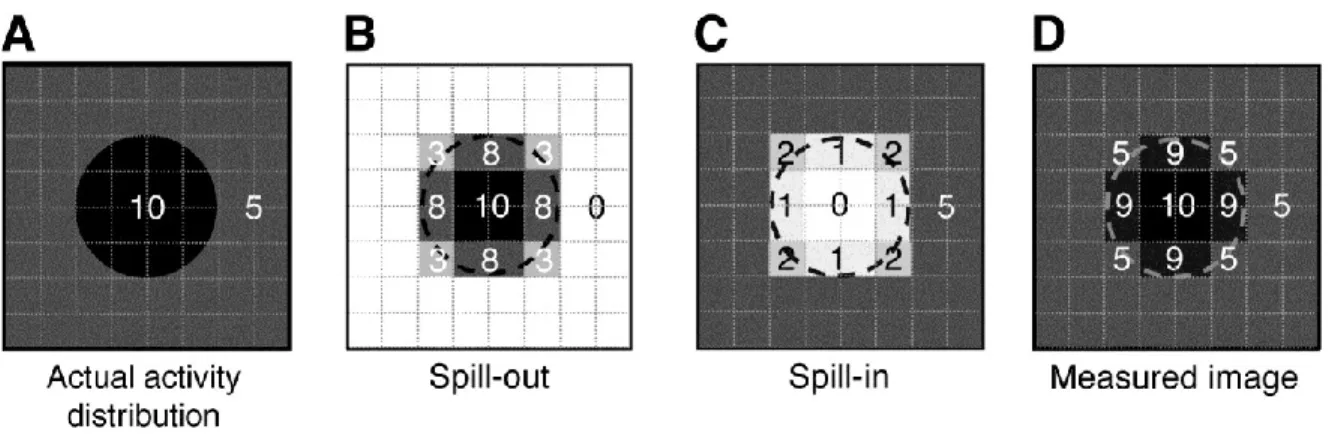
There is continued discussion whether partial volume effect (PVE) software is required to correct PET images. PET images typically have a low resolution, at least in comparison to MR images. PVE occurs due to spill-in or spill-out of the tracer (Figure 9). This contamination between different brain regions can be determined for each scanner by its point spread function, which is the image of a point source and describes the spatial resolution of each scanner. The aim of PVE correction is essentially to reverse the effect of the scanner’s PSF (Erlandsson et al., 2012). PVE is most apparent in small regions of the brain where the true activity will be most underestimated due to the effects of tracer spill-in and spill-out (Mosconi and McHugh, 2011). Several different methods have been suggested to deal with and correct for PVE.
PVE correction methods date back to the late seventies and traditionally rely on anatomical information from either computed tomography or MR images (Hoffman et al., 1979). Hoffman et al. (1979) noted that PET images were affected greatly in regions that were less than two times the full width at half-maximum (FWHM) of the scanner, which is typically five to eight mm. They suggested a recovery coefficient be used to correct for spill-out effects. More recent methods include the Muller-Gartner method which was an extension of the voxel-based method proposed by Videen et al. (1988). The Muller-Gartner method separated white and grey matter in order to not only correct for the effect of cerebrospinal fluid (CSF) on tissue but also the effects of white matter on grey matter (Muller-Gartner et al., 1992). Another more recent method is the geometric transfer matrix (GTM) method which is described by Rousset et al. (1998). However, the disadvantage of this method is that it only provides mean values for predefined regions of interest. Quarantelli et al. (2004) later described the modified Muller-Gartner method. This method was a combination of the Muller-Gartner and GTM methods. The Muller-Gartner methods are currently the most commonly applied PVE correction methods. Atrophy is widespread in normal aging and Alzheimer’s disease. Without this correction, the comparison of PET uptake between
29 healthy younger and older adults becomes difficult. More recent studies suggest that PVE correction is required for the accurate quantification of CMRg in the aging brain (Cunnane et al., 2011; Mosconi et al., 2013; Rousset et al., 2007; Yanase et al., 2005).
Figure 9 : Partial volume effects
Partial volume effects are present when activity within the surrounding tissue influences the activity measured in your region of interest. The true activity (A) of a region of interest is affected by both tracer spill out (B) and spill in (C) and results in the image of measured activity. This research was originally published in JNM. Soret M, Bacharach SL, and Buvat I. Partial-Volume Effect in PET Tumor Imaging. J Nucl Med. 2007;48(6):932-945. Figure 3. © by the Society of Nuclear Medicine and Molecular Imaging, Inc.
2.2.2.2 Measuring brain glucose metabolism with PET
18F-FDG is an analogue of glucose. The only difference being that 18F-FDG is missing a
hydroxide at the second carbon position that has been replaced by an 18F. After injection into the circulation 18F-FDG is transported into brain cells by the same transporters as glucose and is then phosphorylated by the enzyme hexokinase. At this point 18F-FDG becomes trapped in the cell in the form of 18F-FDG-6-phosphate. 18F-FDG-6-phosphate cannot be converted to fructose-6-phosphate by glucose-6-phosphate isomerase because of the missing oxygen (Phelps et al., 1979).
In steady state, the net rate of glucose through any step in the metabolic pathway is equal to the net rate through the overall pathway (Sokoloff, 1977; Sokoloff et al., 1977; Sokoloff, 1984). Therefore, the measurement of the net rate of glucose phosphorylation using in vivo PET yields the net rate of the entire glycolytic pathway. However, the real fate of glucose cannot be known. It could be converted to glycogen or lactate, taken up by the pentose phosphate pathway (PPP) or oxidatively phosphorylated (Sokoloff and Clarke, 1999).
30
18F-FDG measures are dependent on an accumulation of events, including blood flow, the
transport of glucose, and phosphorylation by hexokinase. In order to be in steady state 18 F-FDG PET studies are normally performed after a patient has fasted. This results in a rather stable plasma glucose level of ~5 mM. Under these conditions blood flow and glucose transport are also relatively stable leaving the phosphorylation rate of 18F-FDG being the most important determining factor in the calculation of glucose uptake (Mosconi, 2013). 2.2.2.3 What is the 18F-FDG PET signal measuring?
After the development of 18F-FDG PET, it was questioned what was actually being measured by this method. Shen et al. (1999) studied glutamate to glutamine cycling during resting state using 13C-NMR in humans. This study was based on earlier work performed by Sibson et al. (1998), in the rat brain. The authors found that resting-state glutamate/glutamine cycle is a major metabolic flux that accounted for 80% of glucose oxidation (Shen et al., 1999). These findings are also consistent with earlier work from Pellerin and Magistretti (1994) who showed that glucose consumption is coupled with glutamate neurotransmitter release.
Rocher et al. (2003) used 18F-FDG PET to calculate CMRg in five baboons and established the relationship with synaptophysin levels in seven regions of the brain. Synaptophysin is a presynaptic protein used to assess synaptic density using the Western blot technique. There were significant correlations in all seven brain regions between CMRg and synaptophysin levels. It was concluded that resting state CMRg reflects synaptic activity (Rocher et al., 2003). At this point, it is established that the uptake of 18F-FDG in the brain is closely coupled to excitatory neuronal function due to the extensive energy requirement of glutamate neurotransmission in the brain (Herholz, 2003; Weiner et al., 2013). The assessment of synaptic dysfunction and neuronal degeneration is of particular interest in the context of normal aging and Alzheimer’s disease. Given this, lower cerebral glucose metabolism measured in Alzheimer’s disease presumably represents a reduction in neuronal glucose availability induced by neuronal synaptic dysfunction and loss (Herholz, 2003).
31 2.2.2.4 Measuring brain ketone metabolism with PET
Blomqvist et al. (1995) were the first to measure ketone metabolism using PET. Previously, ketone metabolism in the brain had only been measured using the A-V difference technique. 11C-β-Hb was synthesized from 11C-cyanide and propylene oxide. A bolus injection of 300-400 MBq was administered to five healthy participants after an overnight fast of twelve hours. Scanning ensued for a period of ten minutes. A catheter was placed in the left brachial artery for arterial blood sampling and radioactivity in the arterial blood was sampled in one second intervals by an automatic blood-sampling system. A total of seven manual blood samples were taken during the scan and their activity was measured in a NaI well counter cross calibrated with the scanner. Concentrations of ketones as well as glucose were measured. The ratio between radioactivity in plasma and that in blood was found to be 1.21. Approximately 55% of whole blood radioactivity was present in plasma and 45% was present in red blood cells. This ratio was used to calculate the time course of 11C-β-Hb in plasma from the whole blood measurements obtained by the blood sampler. Glucose averaged across participants was 5.5±0.8 µmol/ml and β-Hb was 0.043±0.029 µmol/ml. Three different kinetic models to calculate the cerebral metabolic rate of 11C-β-Hb were compared. These included, a one-compartment model with CBV and Kket as parameters, a
two compartment model with CBV, K1, k2, and k3 as parameters, and finally the Patlak plot model (Patlak et al., 1983). The authors did not find any significant differences in the results yielded between the three kinetic models.
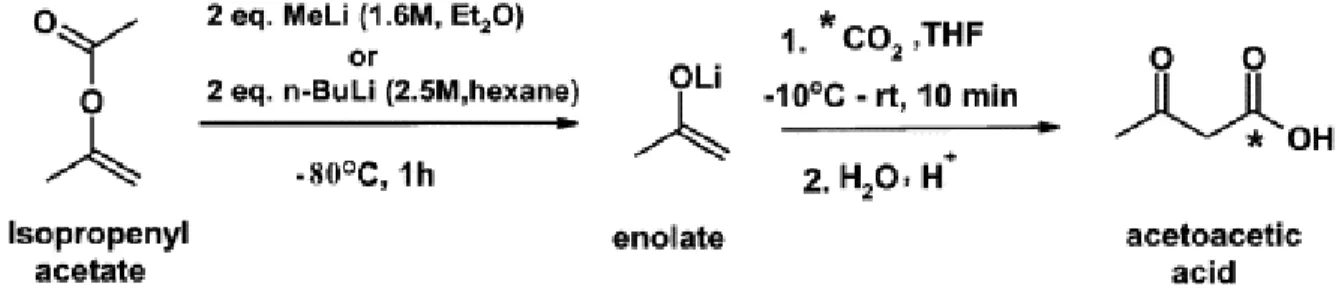
The tracer used for our ketone PET studies was 1-[11C]acetoacetate (11C-AcAc). The synthesis involved the reaction of 11C-CO2 with methyl magnesium chloride in
tetrahydrofuran, followed by hydrolysis and purification by ion-exchange chromatography. Methyl magnesium chloride was replaced by the enolate anion of acetone produced by the reaction of isopropenyl acetate with methyllithium or butyllithium, following the methods of Straatmann et al. (1974) and Prenen et al. (1990). The cryogenic trap for 11C-CO2
capture was replaced by a gas chromatographic trapping method using a molecular sieve to prevent moisture condensation (Figure 10). Quality assurance included testing tracer osmolality, pH (5.5) and assuring no contamination by bacteria. Gas chromatography was used to test for unwanted solvents and assure a purity of at least 95%. The permitted limit
32 for the injection of solvents (ethanol and THF) into humans in Canada is 20 000 ppm (50 mg).
Figure 10 : 11C-AcAc preparation
The synthesis of 11C-AcAc as a ketone tracer for positron emission tomography. The reaction of isopropenyl acetate with methyllithium or butyllithium. Reprinted from Applied Radiation and Isotopes (Tremblay et al., 2007), Copyright (2007), with permission from Elsevier.
2.2.2.5 What is the 11C-AcAc PET signal measuring?
Unlike the tracer 18F-FDG, 11C-AcAc is not metabolically trapped but is catabolized to 11 C-CO2. Once 11C-AcAc gets converted to 11C-acetyl CoA and enters the Krebs’ cycle. Both
carbons will eventually be oxidized to 11C-CO2, but only after acetate has taken its second
turn through the cycle. Studies in rats have shown that less than 5% of an intravenous dose of labelled 14C-β-Hb is expired in the form of 14C-CO2 (Bianchi and Davis, 1996), over a
ten minute period. Blomqvist et al. (1995) found that the loss of 11C-CO2 accounted for an
underestimation of the CMR of β-Hb by 5.9% during the 10 min PET scan.
The degree to which 11C-AcAc uptake in the brain as measured by PET is a reliable indicator of neuronal function is not known. AcAc has a direct connection to the Krebs’ cycle following its entry into a cell. Hawkins et al. (1971) studied the effects of AcAc infusion in rats. AcAc blood concentrations were increased to levels of 2-3 mM in fed and fasted-for-48-hours rats. AcAc infusion caused a decrease in blood glucose concentrations in fed rats but no change in starved rats. Thus, when glucose is readily available and the brain is not lacking energy the administration of ketones results in the negative regulation of plasma glucose concentrations. Ketones are meeting the energetic requirements of the brain and are passing through oxidative phosphorylation like the majority of glucose. Therefore, similarly to glucose, ketone uptake by the brain should be a reliable indicator of
33 synaptic density. There was also an increase in plasma insulin concentrations and a decrease in plasma FFA concentrations following infusion. The effects were always much larger in fed than starved rats (Hawkins et al., 1971). Therefore, there is an important feedback regulation of ketone plasma concentrations that involves increases in insulin in order to decrease FFA concentrations.
2.2.2.6 Quantification of tracer kinetics
Quantitative and semi-quantitative methods are commonly applied to measure tracer kinetics. Currently, brain metabolism using PET is most commonly expressed semi-quantitatively using the Standardized uptake value (SUV). The SUV is easy to calculate, does not require dynamic images and negates the need for any blood sampling. SUV can be calculated on a voxel-wise basis according to the following formula:
Formula 5:
Quantitative analysis using kinetic models can also be used to determine the movement of a marked molecule between "compartments," which are generally separated by membranes or metabolic reactions (Gunn et al., 2002). This requires a dynamic PET acquisition in order to measure changes in tracer tissue concentrations with time, as well as the input function which defines the rate of arrival in blood of the tracer to the brain. Dynamic PET acquisitions allow the quantitative modeling of 18F-FDG in the brain. Modeling techniques commonly used include the region of interest (ROI) method and voxel based methods, including Statistical parametric mapping (SPM) analysis. The two-tissue compartment model (plasma, un-phosphorylated 18F-FDG in brain tissue and phosphorylated 18F-FDG in brain tissue) is widely used to calculate CMRg from 18F-FDG uptake. This calculation requires the use of a correction factor, the "lumped constant," because GLUT transport favors 18F-FDG and hexokinase activity favors glucose (Graham et al., 2002; Huang, 2000; Krohn et al., 2007; Lear and Ackerman, 1992). Measuring CMRg also requires the derivation of an input function (Thie, 2004). The one tissue compartment model explains the passage of a tracer, with time, from the blood into the brain is shown in Formula 6.