HAL Id: inserm-01417465
https://www.hal.inserm.fr/inserm-01417465
Submitted on 15 Dec 2016
HAL is a multi-disciplinary open access
archive for the deposit and dissemination of
sci-entific research documents, whether they are
pub-lished or not. The documents may come from
teaching and research institutions in France or
abroad, or from public or private research centers.
L’archive ouverte pluridisciplinaire HAL, est
destinée au dépôt et à la diffusion de documents
scientifiques de niveau recherche, publiés ou non,
émanant des établissements d’enseignement et de
recherche français ou étrangers, des laboratoires
publics ou privés.
A 3D hierarchical multimodal detection and
segmentation method for multiple sclerosis lesions in
MRI
Hélène Urien, Irène Buvat, Nicolas Rougon, Isabelle Bloch
To cite this version:
Hélène Urien, Irène Buvat, Nicolas Rougon, Isabelle Bloch. A 3D hierarchical multimodal detection
and segmentation method for multiple sclerosis lesions in MRI. Proceedings of the 1st MICCAI
Chal-lenge on Multiple Sclerosis Lesions Segmentation ChalChal-lenge Using a Data Management and Processing
Infrastructure - MICCAI-MSSEG, pp.69-74, 2016. �inserm-01417465�
segmentation method for multiple sclerosis
lesions in MRI
H´el`ene Urien †, Ir`ene Buvat , Nicolas Rougon†, and Isabelle Bloch †
† LTCI, CNRS, T´el´ecom ParisTech, Universit´e Paris-Saclay, 75013, Paris, France
IMIV, Inserm, CEA, Universit´e Paris-Sud, CNRS, Universit´e Paris-Saclay, 91400, Orsay
† MAP5, CNRS, T´el´ecom SudParis, Universit´e Paris-Saclay, 91011, Evry, France
Abstract. In this paper, we propose a novel 3D method for multiple sclerosis segmentation on FLAIR Magnetic Resonance images (MRI), based on a lesion context-based criterion performed on a max-tree repre-sentation. The detection criterion is refined using prior information from other available MRI acquisitions (T2, T1, T1 enhanced with Gadolinium and DP). The method has been tested on fifteen patients su↵ering from multiple sclerosis. The results show the ability of the method to detect almost all lesions. However, the algorithm also provides false detections. Keywords: Max-tree, multiple sclerosis, MRI multimodal segmenta-tion.
1
Introduction
In this paper, we present a new method to detect and segment lesions from MRI images of patients su↵ering from multiple sclerosis. The method is based on a hierarchical approach, where the image is represented by a tree depicting the relationship between all the connected components of all the thresholded ver-sions of the image. The nodes of the tree represent the potential lever-sions, and are selected only if they satisfy a criterion based on the di↵erence between the lesion and the surrounding intensities. Our method was tested on the fifteen training datasets given by the MICCAI MSSEG challenge, providing di↵erent MRI ac-quisitions for each patient (FLAIR, T2, T1, T1 enhanced with Gadolinium and DP). The detection is first performed on FLAIR, and then refined using the other available modalities. Parameter setting is given and results are discussed.
2
A 3D multiple sclerosis lesion detection method using
a hierarchical approach
The lesion detection is based on the hypothesis that the FLAIR intensity of a lesion is higher in a lesion than in the surrounding region. This assumption
70 H´el`ene Urien †, Ir`ene Buvat , Nicolas Rougon†, and Isabelle Bloch †
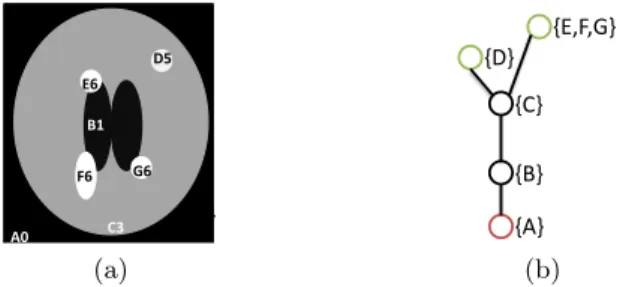
was verified on the lesions extracted from the manual consensus segmentations performed using the LOP STAPLE algorithm [1], considering the average FLAIR intensity in the segmented region and in a neighborhood. The detection relies on a max-tree representation of the image [2], which highlights regions of high intensities. This method, based on the study of inclusion relationships between connected components obtained by thresholding an image at all its intensity values, has several advantages. It allows searching for potential lesions in the whole image, without any prior information about the number or localizations of lesions. Connected components are selected according to a given criterion. An example is depicted in Figure 1, where homogeneous regions, called flat zones, are illustrated by a letter identifiying a specific region, and a number corresponding to the signal intensity in each voxel of the region. The tree is oriented from the root corresponding to the flat zone of lowest intensity, to the leaves, which correspond to the flat zones of highest intensities in the image. A node N is said to be a descendant of a node M if it is higher in the tree. As an example, D is a descendant of C in Figure 1. A0 C3 B1 B1 D5 E6 F6 G6 (a) {E,F,G} {D} {C} {B} {A} (b)
Fig. 1. Example of a synthetic image (a) and its corresponding max-tree (b). The root node is depicted in red, while the leaves are represented in green. Regions are identified by a letter and a number corresponding to the grey level in the region.
The first step is the selection of relevant nodes according to a given criterion, composed of two terms and applied to each current node N :
I(N ) = X1I(N ) X2(N ) (1)
The first term X1I follows our hypothesis of di↵erence in intensities between
the lesion and its surroundings:
X1I(N ) = x N I(x) nN x C N I(x) nC N (2)
where I(x) = IFLAIR(x) is the pre-processed FLAIR intensity in a voxel x, nN
the number of voxels within the region N , representing the current node N and all its descendants, and nCN the number of voxels within a contextual volume
from a voxel of the contextual volume to the nearest voxel to N is set to ↵ voxels. If a node N is representative of a lesion, the criterion value XI(N ) is superior
to 1.
The second term X2 depends on the location of current node N compared to the z axis. If the node is located in slices of the FLAIR image containing ventricles, we assume that the lesion tends to be near the ventricles:
X2(N ) = min x2N,v2V d(x, v) max b2B,v2Vd(b, v) (3)
where x is a voxel from the volume N composed of the current node N and all its descendants, v a voxel from the binary mask of the ventricles V , d the Euclidian distance and b a voxel from the binary mask of the brain provided in the unprocessed dataset B. Otsu’s thresholding [3] is applied on the pre-processed T1 image to segment the ventricles.
If the node is not located in slices containing ventricles, we penalize small nodes:
X2(N ) = 1
nN (4)
where nN is the number of voxels within region N , representing the current node N and all its descendants.
The last step is the reconstruction of the image. Only the nodes with crite-rion value superior to 1 are taken into account. The first node to be selected is the one with the highest criterion value. All its descendants and ancestors with criterion value superior to 1 are removed from the searching list. The remaining node with the highest criterion value superior to 1 is then selected. This pro-cess is repeated until there is no node with criterion value superior to 1 in the searching list. The final image is the union of all the selected nodes filled with their descendants.
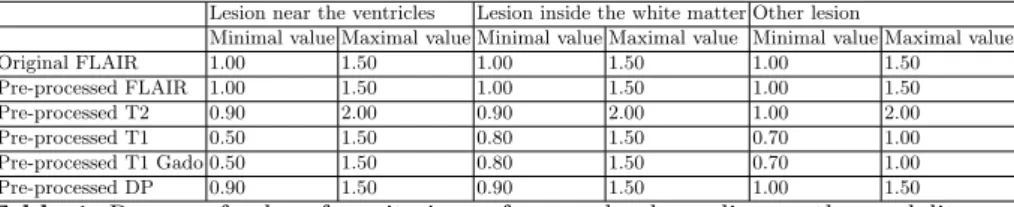
To improve the detection performance, additional constraints are used, de-pending on the location of the lesions with respect to brain structures, and with adaptative ranges of admissible values. These ranges are defined in a super-vised way. The position of a lesion compared to brain structures is assigned to one of three categories: near the ventricles, inside the white matter, and near the cortex. Otsu’s thresholding [3] is applied on the pre-processed FLAIR image to segment the white matter. Using an automatic thresholding is enough to roughly localize the structures of interest. The manually segmented lesions were also as-signed to these three regions, according to their position. For each region, and for each available modality I, the maximal and minimal values of the criterion
I were computed, as illustrated in Table 1. Moreover, the maximal and minimal
values of the volume of each lesion were computed according to their position, as illustrated in Table 2. Finally, a node N is selected only if the value of the criterion I computed for all the modalities I and depending on the position of
72 H´el`ene Urien †, Ir`ene Buvat , Nicolas Rougon†, and Isabelle Bloch †
the node with respect to the brain structures falls within the intervals defined in Tables 1 and 2. If so, the criterion FLAIR is assigned to this node N , which is
taken into account in the image reconstruction step only if its value is superior to 1.
3
Results and discussion
The algorithm uses images from both pre-processed (FLAIR, T1 enhanced with Gadolinium, T2, T1, DP) and unprocessed (FLAIR and brain binary mask) datasets.
3.1 Parameter setting
In order to limit the size of the tree, while preserving contour information, the input image is first quantified on k levels. Here we used k = 20 for FLAIR images. Then the tree is created using Salembier’s algorithm [2] on the quantized FLAIR image.
The maximal Euclidian distance from a voxel of the contextual volume to the nearest voxel to node N filled with all its descendants is set to ↵ = 1 voxel. The connectivity was set to 26 to compute the max-tree. Tables 1 and 2 show the minimal and maximal values of the criterion and of the volumes of manually segmented lesions according to the position of the lesion.
Lesion near the ventricles Lesion inside the white matter Other lesion
Minimal value Maximal value Minimal value Maximal value Minimal value Maximal value
Original FLAIR 1.00 1.50 1.00 1.50 1.00 1.50 Pre-processed FLAIR 1.00 1.50 1.00 1.50 1.00 1.50 Pre-processed T2 0.90 2.00 0.90 2.00 1.00 2.00 Pre-processed T1 0.50 1.50 0.80 1.50 0.70 1.00 Pre-processed T1 Gado 0.50 1.50 0.80 1.50 0.70 1.00 Pre-processed DP 0.90 1.50 0.90 1.50 1.00 1.50
Table 1. Ranges of values for criterion for a node, depending on the modality and the position of the node.
Lesions near the ventricles Lesions inside the white matter Other lesions
Minimal value Maximal value Minimal value Maximal value Minimal value Maximal value Volume (mm3) 3.85 6.44 104 3.02 2.28 103 9.07 807
Table 2. Ranges of values of node volume (mm3) depending on the position of the node.
3.2 Preliminary results
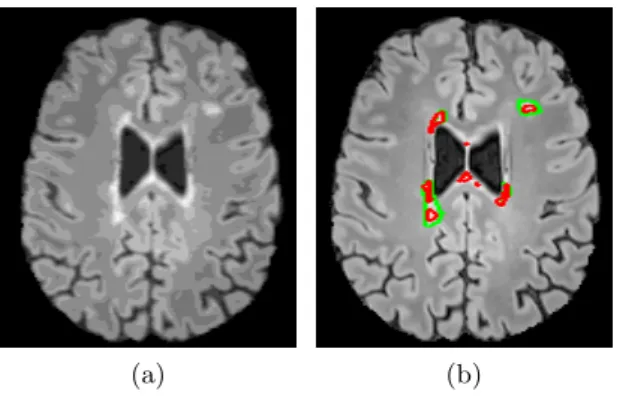
A preliminary result is shown for one of the patients in Figure 2. The algorithm manages to detect almost all lesions, but leads to an over-detection in areas of the brain which do not contain ventricles.
(a) (b)
Fig. 2. Visual results. (a) Pre-processed FLAIR image requantized to 20 grey levels. (b) Contours of manual (in green) and automatic (in red) segmentations.
4
Conclusion
We proposed a 3D method for multiple sclerosis detection embedded in a hierar-chical approach. The results show that the lesions from the manual segmentation are well included in the segmentation, but at the price of a number of false de-tections. The method could be improved using other contextual criteria, such as the one from [4], based on the di↵erence of variance between the object of interest and its surroundings.
References
1. Akhondi-Asl, A., and Hoyte, L., and Lockhart, M. E., and Warfield, S.K. A Logarithmic Opinion Pool Base STAPLE Algorithm for the Fusion of Segmenta-tions With Associated Reliability Weights. IEEE TransacSegmenta-tions on Medical Imaging, 33(10):1997–2009 (2014).
2. Salembier, P., and Oliveras, A., and Garrido, L. Antiextensive connected operators for image and sequence processing. IEEE Transactions on Image Processing. 7, 555– 570 (1998).
3. Otsu, N.: A threshold selection method from gray-level histograms. Automatica, 11, 285–296 (1975).
4. Xu, Y., and G´eraud, T., and Najman, L. Context-based energy estimator: Ap-plication to object segmentation on the tree of shapes. 19th IEEE International Conference on Image Processing (ICIP).1577-1580 (2012).