Publisher’s version / Version de l'éditeur: Molecular Plant, 4, 6, pp. 1074-1091, 2011-06-07
READ THESE TERMS AND CONDITIONS CAREFULLY BEFORE USING THIS WEBSITE.
https://nrc-publications.canada.ca/eng/copyright
Vous avez des questions? Nous pouvons vous aider. Pour communiquer directement avec un auteur, consultez la première page de la revue dans laquelle son article a été publié afin de trouver ses coordonnées. Si vous n’arrivez pas à les repérer, communiquez avec nous à [email protected].
Questions? Contact the NRC Publications Archive team at
[email protected]. If you wish to email the authors directly, please see the first page of the publication for their contact information.
NRC Publications Archive
Archives des publications du CNRC
This publication could be one of several versions: author’s original, accepted manuscript or the publisher’s version. / La version de cette publication peut être l’une des suivantes : la version prépublication de l’auteur, la version acceptée du manuscrit ou la version de l’éditeur.
For the publisher’s version, please access the DOI link below./ Pour consulter la version de l’éditeur, utilisez le lien DOI ci-dessous.
https://doi.org/10.1093/mp/ssr040
Access and use of this website and the material on it are subject to the Terms and Conditions set forth at
Analysis of gene expression patterns during seed coat development in Arabidopsis
Dean, Gillian; Cao, YongGuo; Xiang, DaoQuan; Provart, Nicholas J.;
Ramsay, Larissa; Ahad, Abdul; White, Rick; Selvaraj, Gopalan; Datla, Raju; Haughn, George
https://publications-cnrc.canada.ca/fra/droits
L’accès à ce site Web et l’utilisation de son contenu sont assujettis aux conditions présentées dans le site LISEZ CES CONDITIONS ATTENTIVEMENT AVANT D’UTILISER CE SITE WEB.
NRC Publications Record / Notice d'Archives des publications de CNRC:
https://nrc-publications.canada.ca/eng/view/object/?id=fec99793-e81e-4a91-9502-42b1f5b71a2e https://publications-cnrc.canada.ca/fra/voir/objet/?id=fec99793-e81e-4a91-9502-42b1f5b71a2e
Analysis of gene expression patterns during seed coat development in Arabidopsis
Gillian Dean1, Yongguo Cao2, Daoquan Xiang2, Nicholas J. Provart3, Larissa Ramsay2, Abdul Ahad1, Rick White4, Gopalan Selvaraj2, Raju Datla2, George Haughn1
1. Dept. of Botany, University of British Columbia, 6270 University Blvd., Vancouver, BC, V6T 1Z4, Canada
2. National Research Council of Canada Plant Biotechnology Institute, 110 Gymnasium Place, Saskatoon, SK, S7N 0W9, Canada
3. Dept. of Cell & Systems Biology / Centre for the Analysis of Genome Evolution and Function, University of Toronto, 25 Willcocks St., Toronto, ON, M5S 3B2, Canada
4. Dept. of Statistics, University of British Columbia, 6356 Agricultural Road, Vancouver, BC, V6t 1Z2, Canada
Running title: Arabidopsis seed coat gene expression
Corresponding Author: George Haughn
Department of Botany, University of British Columbia 3529-6270 University Blvd, Vancouver BC V6T1Z4
Phone : +1 604 822-9089 Fax : +1 604 822-6089
ABSTRACT
The seed coat is important for embryo protection, seed hydration and dispersal. Seed coat composition is also of interest to the agricultural sector since it impacts the nutritional value for humans and livestock alike. Although some seed coat genes have been identified, the developmental pathways controlling seed coat development are not completely elucidated, and a global genetic program associated with seed coat development has not been reported. This study uses a combination of genetic and genomic approaches in Arabidopsis thaliana to begin to address these knowledge gaps.
Seed coat development is a complex process whereby the integuments of the ovule differentiate into specialised cell types. In Arabidopsis, the outermost layer of cells secrete mucilage into the apoplast and develop a secondary cell wall known as a columella. The layer beneath the epidermis, the palisade, synthesises a secondary cell wall on its inner tangential side. The innermost layer (the pigmented layer or endothelium) produces proanthocyanidins that condense into tannins and oxidize, giving a brown colour to mature seeds. Genetic separation of these cell layers was
achieved using the ap2-7 and tt16-1 mutants, where the epidermis/palisade and the
endothelium do not develop respectively. This genetic ablation was exploited to examine the developmental programs of these cell types by isolating and collecting seed coats at key transitions during development and performing global gene expression analysis. The data indicate that the developmental programs of the epidermis and the pigmented layer proceed relatively independently, and global expression datasets that can be used for identification of new gene candidates for seed coat development were generated. This data set provides a comprehensive expression profile for developing seed coats in Arabidopsis, and should provide a useful resource and reference for other seed systems.
INTRODUCTION
In angiosperms, the mature seed consists of an embryo, a seed coat, and in many cases, an endosperm. The embryo and the endosperm are products of fertilization by sperm cells of the egg cell and central cells respectively. In addition, these fertilization events induce the integuments of the ovule to differentiate into a seed coat (testa). The
structure of the seed coat varies between species, but fulfills similar roles including protection of the embryo, limitation of desiccation during dormancy and germination, and promotion of seed dispersal.
Differentiation of the Arabidopsis seed coat has been well studied and comprises several layers of specialized cell types. At the time of fertilisation, the embryo sac of the ovule is surrounded by an inner integument with two to three cell layers and an outer integument with two cell layers. These integument cells undergo a period of significant growth comprising both cell expansion and division. Next, each cell layer follows a distinct developmental program (for review see Haughn and Chaudhury, 2005). The innermost layer of the inner integument, the endothelium, synthesises proanthocyanidin (PA) flavonoid compounds that condense to form tannins. The other two inner integument cell layers do not appear to differentiate and apparently undergo programmed cell death (Nakaune et al., 2005). The subepidermal cells of the outer integument form a thickened cell wall on the inner tangential side known as the palisade. The epidermal cells of the outer integument secrete a large amount of pectinaceous mucilage into the apoplast before forming a volcano-shaped cellulosic secondary cell wall known as the columella. By maturity, all seed coat cells have died and all cell layers apart from the epidermal cells, which are preserved by the columella, are crushed together. Therefore, the seed coat provides an interesting developmental system for study, and represents an excellent model system for cellular processes including PA production (Lepiniec et al., 2006), aspects of cell wall synthesis and modification such as pectin biosynthesis and secretion, and secondary cell wall formation (Arsovski et al., 2010). Practically, the seed coat is an appealing model system for genetic analysis of such processes as it is not essential for seed viability in Arabidopsis.
Some of the key genes that are involved in seed coat differentiation have been identified and characterised. The genetic pathway for production of PAs, which give Arabidopsis seeds their brown colour following polymerization into tannins and oxidation, has been relatively well elucidated, at least partly because of the ease of identifying mutants based on altered colouration of the seeds; both PA-producing
enzymes and transcription factors have been identified in this way (for review see Lepiniec et al., 2006). Genes involved in the differentiation of the epidermal cells have also been uncovered using screens for mutants where mucilage production is defective (Western et al., 2001). Further, the TTG1-dependent pathway that controls root hair and
trichome differentiation has also been found to control seed coat differentiation (for review see Arsovski et al., 2010).
Although much is known about seed coat development in Arabidopsis, many gaps remain in our understanding. Most of the genes currently known to be involved in seed coat development have been identified using forward-genetic mutant screens. However, such screens have limitations caused by redundancy and difficulties in identifying subtle phenotypes. Analysis of global gene expression offers an alternate approach to finding additional genes that are expressed and involved in seed coat development.
Gene expression during seed development has been examined in Arabidopsis (Le et al., 2010) and gene expression specifically in seed coats has been investigated in other species (Gallardo et al., 2007; Jiang and Deyholos, 2010; Pang et al., 2004; Pang et al., 2008). Although these experiments have provided some insights into broader aspects of seed coat development, a global picture of gene expression specifically during seed coat development in Arabidopsis, the best studied model system, has not yet been reported, highlighting the need for a comprehensive gene expression analysis of this tissue. In addition, because Arabidopsis thaliana is closely related to Brassica species,
many of which are important crops, Arabidopsis seed coat microarray data will be useful for identifying gene targets for genetic manipulation. For example, in B. napus (Canola),
a major oilseed crop, the seed coat is an important component of the meal used for animal feed. Breeding objectives include reducing a variety of anti-nutritional factors such as fibre (lignin), tannins and mucilage from the seed coat.
This study reports the findings of comprehensive global gene expression analysis in the developing Arabidopsis seed coat, with a view to identify novel genes involved in this process. In order to maximise the number of differentially regulated candidate genes that could be identified, the microarray experiment was designed to allow comparison of gene expression in three key stages of development for both wild type and mutant lines
defective in the differentiation of specific seed coat cell types. We show that our microarray results are consistent with publically available microarray data, as well as with expression data for previously characterized genes that are expressed in the seed coat. This global study identified gene expression programs associated with inner and outer integuments. Additionally, comparative analysis of tt16 and ap2 with wild type
seed coats revealed the expression programs controlled by these regulatory factors. Finally, this study developed new comprehensive global gene expression datasets for Arabidopsis seed coat development.
RESULTS
Mutants and time points used for expression profiling
In order to obtain precise expression information on candidate genes for specific processes during seed coat differentiation, seed coats were separated from developing embryos at three different developmental stages for two wild type and two mutant lines. Three developmental time points, 3, 7 and 11 days post anthesis (DPA), were chosen for the expression profiling as they represent key developmental transitions. At 3 DPA, PA synthesis is underway in the endothelial cells, while the epidermal cells have begun to accumulate starch grains. At 7 DPA, PA synthesis is coming to an end, but the epidermal cells are now producing and secreting a large amount of pectinaceous mucilage into the apoplast. At 11 DPA, mucilage production is complete and the epidermal cells are producing a secondary cell wall (columella). Because the aleurone (endosperm) adheres tightly to the seed coat in later stages examined (7 and 11 DPA) and some contamination with endosperm nuclei at the earliest stage (prior to differentiation of the aleurone) is likely, we assume our samples include some endosperm mRNA. Therefore, these tissue samples contain four cell types; epidermis, palisade, endothelium and endosperm, plus cells of the inner integument which undergo cell death. Examination of the changes in mRNA abundance at these time points should allow identification of genes associated with PA, mucilage and secondary cell wall biosynthesis.
A genetic approach was used to dissect the epidermis, palisade and endothelium by exploiting mutants that specifically disrupt development of these layers. Mutants of transcription factors implicated in seed coat development were selected as it was expected that such mutations would have regulatory roles and therefore the greatest global effect on gene expression in the affected cell layers, thereby increasing the probability of identifying differentially expressed genes associated with those tissues.
AP2 encodes an AP2-domain transcription factor which is required for differentiation of
both layers of the outer integument; strong ap2 mutants lack differentiation of both the
epidermal and palisade layers, suggesting that AP2 is an early regulator of seed coat differentiation in the outer ovule integument (Jofuku et al., 1994; Western et al., 2001).
A strong ap2 allele in the Col background (ap2-7) was isolated from an
EMS-mutagenised population (Kunst et al., 1989). Although the exact molecular lesion in this allele is not known, it displays a phenotype similar to other strong alleles while still being relatively fertile. Mature ap2-7 seeds are brown indicating the presence of PA in the
endothelium (Figure 1B). However, when mature ap2-7 seeds are imbibed with
Ruthenium Red, both with and without shaking during the staining protocol, they do not release mucilage (Figure 1F, J). In addition, mature ap2-7 seeds appear heart-shaped
as the seed coat collapses to the shape of the embryo in the absence of secondary cell walls in the outer two layers (Figure 1B, F, J).
TT16 encodes an ARABIDOPSIS BSISTER (ABS) MADS domain protein that is an
early regulator of endothelium differentiation (Debeaujon et al., 2003; Nesi et al., 2002). Although it would have been preferable to use a tt16 allele in a Col background, no such
allele was available; therefore the tt16-1 mutant, a T-DNA insertion in the Ws-2
background, was selected (Nesi et al., 2002). Mature tt16-1 seeds release mucilage in a
manner similar to wild type when imbibed with Ruthenium Red both with and without shaking during the staining protocol (Figure 1H, L). Although the chalazal/micropylar region does develop normally, tt16-1 seeds produce little PA in the main body of the
seed, giving pale seeds at maturity (Figure 1D).
In order to confirm the developmental programs of the ap2-7 and tt16-1 mutants in
marked using non-toxic paint, then harvested 3, 7 and 11 DPA. The developing seeds were resin embedded, sectioned, stained with Toluidine Blue and examined by light microscopy (Figure 2). The 7 flowers were hand fertilised with Col-2 pollen as ap2-7 produces very little pollen of its own and is semi-sterile. This does not affect the
phenotype of the developing seed coat, which is maternally inherited.
The sectioning showed that the cells of the outer seed coat layers in the ap2-7 mutant
do not differentiate (Figure 2D, E, F), and that tt16-1 does not undergo development of
the endothelium in the main body of the seed (Figure 2J, K, L). Therefore, these data confirm the suitability of these two mutants for use in this study, and also indicate that other aspects of seed development in these mutants are normal.
Tissue preparation for expression profiling
Under our growth conditions, Ws-2 and tt16-1 flower slightly earlier than Col-2 and ap2-7 and are generally ready for marking 5-ap2-7 days before Col-2 and ap2-ap2-7. Therefore,
planting was staggered slightly to allow all tissues to be harvested on the same day. To prepare tissue for the expression profiling, newly opened flowers (0 DPA) from all four genotypes (ap2-7, tt16-1, Col-2 and Ws-2) were marked in the same way as for
resin embedding. Again, ap2-7 flowers were hand pollinated using Col-2 pollen so that
the seed set was higher and the developmental stage could be more accurately determined.
As well as using mutants to genetically separate the inner and outer integuments, seed coat tissues for expression profiling were physically separated from the embryo; this approach further enriched for transcripts that specifically act in seed coat development. Though we carefully separated seed coat tissues from embryo, the single layer of endosperm adhering to the seed coat that is present at late stages (7 and 11 DPA) was likely included in the preparation. The removal of the embryo also allowed the stage of seed coat development to be double checked by comparison to the stage of embryo development. Previous work has indicated that at 3 DPA under our growth conditions, the embryo is late globular, at 7 DPA it is at the bent cotyledon stage and at 11 DPA it is at the upturned U stage (Western et al., 2000). In the case of the tt16-1 mutant, embryo
development appeared to be slightly slower than expected; therefore seed coats corresponding to late globular, bent cotyledon and upturned U embryo stage seeds were isolated. These modifications ensured harvesting of seed coat tissues from comparable developmental stages in different genotypes.
The seed coat was separated from the embryo using forceps and washed with 5% sucrose in 0.1% RNAlater solution. For each genotype at each developmental stage, four biological replicates were harvested and processed separately.
Genome-wide expression profiling
The microarray design was developed to allow a number of direct comparisons between three developmental time points and genotypes (Figure 3A). The design was chosen so that the key comparisons could be made directly, and so that other comparisons could be made with as few degrees of separation as possible. Figure 3A also shows the embryo stages at each developmental time point.
The Qiagen-Operon Arabidopsis Genome Array Ready Oligo Set (AROS) Version 3.0 (http://cals.arizona.edu/microarray; Zhang et al., 2008) was used for expression profiling, and four biological replicates were hybridised as detailed in the methods. A dye swap was performed by labelling two biological replicates with Cy3 and two with Cy5 to normalize for any bias caused by dye labelling.
The microarray data was normalized and effects of time and genotype on gene expression were estimated. These effect estimates were used to examine the relationships over time within each genotype, and also between genotypes at a fixed time point.
Figure 3 shows pair wise comparisons of microarray data sets, and includes all microarray probes with greater than 2 fold changes in gene expression. All comparisons were made experimentally (Figure 3A) or were determined in silico from the array data
(Figure 3B).
In order to identify trends in gene expression patterns during seed coat development, five key comparisons were examined in more detail using the Classification
Superviewer tools (Provart and Zhu, 2003) available at the Bio-Array Resource for Plant Functional Genomics (BAR) website. The two fold changed gene lists were used for this analysis and five key comparisons were examined. To try and gain more insights into the developmental processes of wild type seed coat development, the genes that were more highly expressed at 7 DPA compared to 3 DPA, and more highly expressed at 11 DPA compared to 7 DPA, were examined in the Col-2 background. We focused on the Col-2 background rather than Ws-2 as it is more similar to the published Col-0 genome, and because more work on individual genes has been done in the Col background than in Ws-2. Next, because two major processes in epidermal development are mucilage synthesis and columella development, the differences in gene expression between ap2-7 and Col-2 at ap2-7 DPA (during the peak of mucilage synthesis) and 11 DPA (during the
peak of columella development) were examined. Finally, in order to examine the processes involved in endothelium differentiation, the differences between tt16-1 and
Ws-2 at 3 DPA were examined.
The Classification Superviewer has two different output modes, and will return either the absolute number of genes in each GO functional classification or the number of genes in each GO category normalized to number of genes actually found on the chip. It is preferable to use the normalized data output option as it gives a more accurate representation of the types of genes that are differentially regulated, because bias caused by number of genes in each GO category on the array is removed. Although the database uses the gene identities on the GeneChip arrays (Provart and Zhu, 2003) for these calculations, AROS chips have a comparable number of genes (25,460 genes for GeneChip and 26,173 for AROS). Therefore, trends can be accurately identified using the normalized output despite the use of a different microarray platform.
The normalized data for these 5 key comparisons, for GO classification of cellular components, is shown in Figure 4.
In Col-2, genes with products associated with DNA or RNA metabolism, Protein Metabolism, and Cell Organization and Biogenesis, are underrepresented between 3 and 7 DPA, and 7 and 11 DPA, as are proteins with the molecular function Nucleic Acid
Binding, as might be expected for cell types that are no longer growing and dividing (Figure 4A, B).
The genes encoding proteins associated with the Plastid are overrepresented in Col-2
between 3 and 7 DPA, and at 7 DPA between Col-2 and ap2-7, but are
underrepresented in Col-2 between 7 DPA and 11 DPA, in line with the presence of amyloplasts in the early stages of epidermal cell development and their disappearance in the later stages (Figure 4A, B, C).
The genes encoding proteins associated with the Golgi, Extracellular domain, Cell Wall, Plasma Membrane, and ER are all overrepresented in Col-2 between 3 DPA and 7
DPA, and at 7 DPA between in ap2-7 and Col-7, when the synthesis of pectin, a
secreted carbohydrate, is at a maximum in Col-2 but is absent in ap2-7 (Figure 4A, C).
By 11 DPA in Col-2, the genes that are primarily associated with pectin synthesis (Golgi, Plasma Membrane and ER) are no longer overrepresented as pectin synthesis has finished. However, Cell Wall and Extracellular genes are even more over-represented as columella (secondary cell wall) synthesis is at its peak (Figure 4B). This
overrepresentation is even more pronounced between ap2-7 and Col-2 at 11 DPA as
columella synthesis is absent in the ap2-7 mutant (Figure 4D).
In the case of Ws-2 and tt16-1, there is underrepresentation of genes associated with
the biological processes of DNA or RNA metabolism and Protein Metabolism, again as might be expected for cells that are not growing or dividing (Figure 4E).
Validation of Microarray Results using Publicly Available Expression Data
For initial validation of the microarray data, three genes known to be involved in epidermal development and four genes known to be involved in endothelial development were selected. GL2 (Koornneef et al., 1982), MUM4 (Usadel et al., 2004;
Western et al., 2001; Western et al., 2004) and MUM2 (Dean et al., 2007; Macquet et
al., 2007; Western et al., 2001) are involved in production and modification of seed coat mucilage in the epidermal layer, and BAN (Albert et al., 1997), LDOX/TDS4 (Abrahams
et al., 2003), TT2 (Nesi et al., 2001) and TT3/DFR (Shirley et al., 1995) are involved in
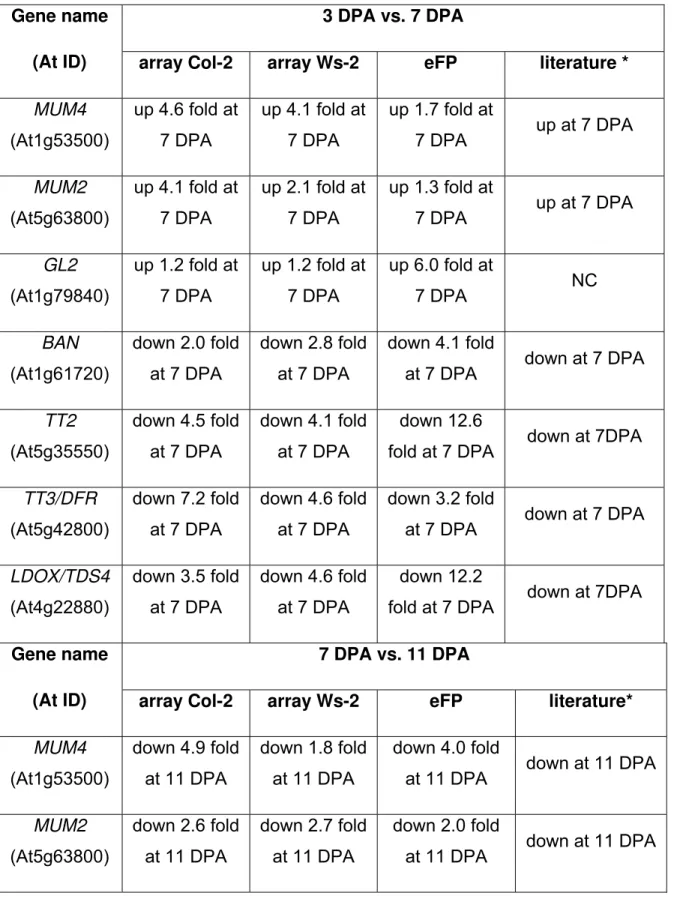
Expression data from the microarray for these genes in both Col-2 and Ws-2 was compared with expression data from Col-0 (Schmid et al., 2005) available via the Arabidopsis eFP browser at BAR (Winter et al., 2007). The eFP browser was set to the Developmental map, with absolute values for gene expression. This allowed fold changes to be calculated for each comparison of interest, and seed stages 3, 7 and 10 were used as equivalent to 3, 7 and 11 DPA respectively. In addition, published expression data from the following studies was used to validate data: MUM4 and GL2
(Western et al., 2004), MUM2 (Dean et al., 2007), BAN and LDOX (Devic et al., 1999), TT2 (Nesi et al., 2001), and TT3/DFR (Nesi et al., 2000). This data analysis is
presented in Table 1.
Generally, the comparisons between Col-2 and Ws-2 from the microarray data are in good agreement, as would be expected from the similar developmental programs of Col-2 and Ws-2 seeds as shown in Figure 2. The data from the available literature are also similar to the microarray data.
Although the data used for the eFP Developmental map is from the Col-0 ecotype, there is still good overall agreement between these data and the trends in expression in Col-2 and Ws-2 (Table 1). However, there are some instances where data from the microarray and the eFP browser do not match perfectly. In contrast to the microarray
data and literature, data from the eFP browser for the epidermal genes MUM2 and
MUM4 do not show a large increase in expression between 3 and 7 DPA, whereas GL2
expression does increase significantly. Between 7 and 11 DPA, MUM2 and MUM4
expression decreases, similar to data from the microarray and the literature. However, there is also a large decrease in expression of GL2 which is not seen in other data sets.
If the expression patterns from the eFP browser are examined, it can be seen that the trends in expression over time are similar, with a peak in expression during seed development, but that the timing is slightly different (Supplementary Figure 1A). For all three of these genes, peak expression appears earlier in development at the late heart/early torpedo stage rather than at the late torpedo/bent cotyledon stage as indicated in the literature. This may be because the tissue used for the eFP browser is different (siliques for the earlier stages, and whole seeds for all stages rather than seed
coat specifically), or perhaps because of differences in growth conditions that affect some aspects of seed development. In addition, the samples collected in previous studies are likely to represent mixed developmental stages because the ovule development in a given silique is not synchronized, whereas in this study each seed coat was isolated and staged separately with reference to the embryo.
There is good agreement between all three datasets for the endothelial genes. Data from the eFP browser shows that these genes are highly expressed early in seed development and that expression decreases with time (Supplementary Figure 1B shows
TT2 as an example). In the case of TT2 (At5g35550), expression appears to go up very
slightly between 7 and 11 DPA. However, because this fold change is so low, it is likely best interpreted as “no change”.
Generally, the trends in gene expression from these three data sources are in good agreement, indicating that the microarray data in the present study gives an accurate representation of changes in gene expression during seed coat development.
Differential expression between wild types
As already discussed, expression of known genes is similar in both Col-2 and Ws-2. As Col-2 and Ws-2 follow the same developmental program, it was also expected that the numbers of differentially expressed genes between each time point would be similar. While this is true for some comparisons, there are more genes downregulated between 3 DPA and 7 DPA in Ws-2 than in Col-2 (Figure 3A), and many more genes are differentially expressed in Col-2 compared to Ws-2 between 7 DPA and 11 DPA (Figure 3A).
Initially, the lists of significantly changed genes were used to extract genes that were common to both ecotypes, and distinct to each ecotype, at 3 DPA vs. 7 DPA, and 7 DPA vs. 11 DPA (Table 2). Interestingly, and perhaps unexpectedly, the number of genes common to both lists for all comparisons examined was smaller than expected. In addition, gene expression in Col-2 and Ws-2 was compared at each time point (Figure 3B), and there were large differences in the numbers of significantly expressed
genes between these two wild types. However, when the complete set of array data was analyzed using GeneSpring software (using all spots with an intensity value of 200 or more), the total number of genes expressed in both ecotypes across all time points was similar, with 14,284 genes expressed in Col-2 and 14,457 genes in Ws-2. Given that there are 26,173 genes on the array, 54% of the genes in Col-2 and 55% of the genes in Ws-2 are expressed during seed coat development, indicating that the developmental processes occurring in seed coats are complex and use a large percentage of the genome. Furthermore, the overlap in expressed genes between these ecotypes is very high, with 12,246, or approximately 85%, of these genes expressed in both ecotypes. This indicates that although there are some differences in relative expression levels, the overall expression programs between these two ecotypes are very similar.
Effect of the ap2-7 mutation on endothelial expression, and the tt16-1 mutation on epidermal expression
As described previously, ap2-7 and tt16-1 were chosen to help identify genes that are
important in development of the epidermis and endothelium respectively. In order to determine more specifically whether disruption of the epidermis had an effect on endothelial development and vice versa, the expression of key genes involved in the development of these tissue types was examined.
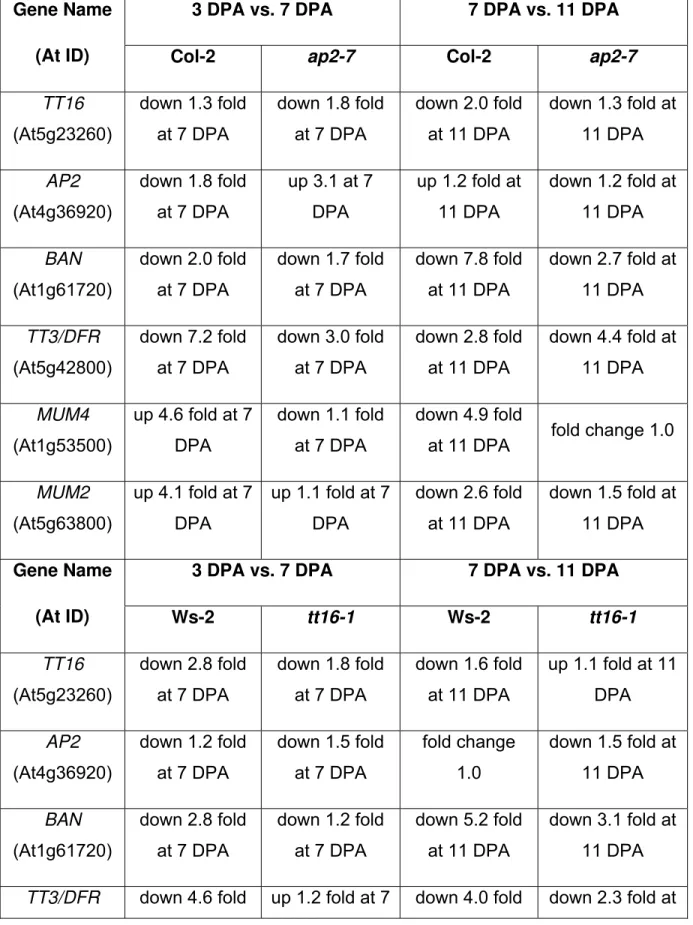
Table 3 shows expression of three key genes in epidermal development (AP2, MUM2
and MUM4) and three key genes in endothelial development (TT16, BAN and TT3/DFR)
in Col-2, ap2-7, Ws-2 and tt16-1.
As expected, AP2 is expressed normally in the tt16-1 background (compare AP2
expression in Ws-2 and tt16-1 at 3 DPA vs. 7 DPA and 7 DPA vs. 11 DPA), and TT16 is
expressed similarly in the Col-2 and ap2-7 backgrounds (compare TT16 expression in
Col-2 and ap2-7 at 3 DPA vs. 7 DPA and 7 DPA vs. 11 DPA) indicating that the two
transcription factors do not regulate each other. Further, transcript can be detected for
these mutants are not transcript nulls. Interestingly, AP2 transcript is upregulated
between 3 and 7 DPA in the ap2-7 background.
In the case of both BAN and TT3/DFR, similar patterns of regulation are seen in Ws-2,
Col-2, and ap2-7, where expression of these genes decreases between 3 DPA and 7
DPA, and again between 7 DPA and 11 DPA. As expected from previous studies, the decrease in expression of these genes in the tt16-1 background is not so pronounced
between 3 DPA and 7 DPA, presumably because the lack of functional TT16 meant that
these genes were not highly expressed at 3 DPA.
In the case of MUM4 and MUM2, similar patterns of regulation are seen in Col-2, Ws-2
and tt16-1, where expression increases between 3 DPA and 7 DPA and then decreases
again from 7 DPA to 11 DPA. However, MUM4 expression does not increase between 3
and 7 DPA as much as would be expected considering the results from the other
backgrounds, and that tt16-1 seeds produce mucilage in comparable amounts to wild
type. Conversely, and in agreement with previous studies, in the ap2-7 background,
these genes are not significantly changed in expression, presumably because there is no functional AP2 transcript that is needed for their activation.
Therefore, this analysis indicates that the developmental pathways and the associated gene expression programs in the epidermis and the endothelium function relatively independently.
Expression of mucilage and PA biosynthesis associated genes in ap-2 and tt16-1 mutant backgrounds
In order to examine the effect of the different mutant backgrounds on gene expression, the expression of genes known to be involved in epidermal pathways were compared in
ap2-7 and Col-2, and the expression of genes known to be involved in endothelial
pathways were compared in tt16-1 and Ws-2. Microarray data was validated using
qPCR analysis using RNA prepared from isolated seed coats as before. These results were then compared with published expression patterns where available in the literature. All data is shown in Table 4.
MUM4, GL2 and TTG1 were selected as markers for expression in ap2-7 vs. Col-2 at 7
DPA as these genes are known to be required for epidermal development. In the case of MUM4, the decrease in expression in the ap2-7 background is confirmed by the
qPCR results, and this is supported by published data (Western et al., 2004). For GL2,
the microarray data does not show a significant decrease in expression in the ap2-7
background, as has been reported in the literature (Western et al., 2004) and was shown by qPCR. Although TTG1 is involved in mucilage synthesis, it does not appear to
be significantly downregulated in the ap2-7 background (Western et al., 2004), and this
is also reflected in the microarray data and by the qPCR analysis. Overall, the microarray data is broadly in line with both the literature and qPCR analysis.
BAN and TT3/DFR were selected as markers for expression in tt16-1 vs. Ws-2 at 3 DPA
as these genes are known to be required for PA synthesis. There is good agreement
between the microarray and qPCR data in the case of TT3/DFR, where a large
decrease in expression was seen in the tt16-1 background. No data in the literature
regarding expression of TT3/DFR in tt16-1 is available for comparison. In the case of BAN, the microarray data does not show a large decrease in expression in the tt16-1
background, which is unexpected as BAN has been shown to be downregulated in tt16-1 using a BAN promoter fused to the GUS marker (Nesi et al., 2002; Debeaujon et al.,
2003). However, more sensitive qPCR analysis of BAN expression showed significant
down regulation in the tt16-1 background that is consistent with the earlier study (Nesi
et al., 2002). This result indicates the importance of independently validating microarray results with qPCR.
In addition, GeneSpring software was used to analyze the microarray data in order to illustrate that groups of other genes follow the same trends in expression pattern as genes known to act in development of seed coat tissues. Figure 5A shows the expression pattern of significantly changed genes at 7 DPA in ap2-7 vs. Col-2. It can be
seen that MUM4, along with a number of other genes, are downregulated in the ap2-7
background at 7 DPA. Similarly, Figure 5B shows the expression pattern of significantly
changed genes at 3 DPA in tt16-1 vs. Ws-2. Here TT3/DFR is downregulated in the
trend in expression pattern. This indicates that MUM4 and TT3/DFR are representatives
of groups of genes that respond similarly to AP2 and TT16. Based on their similar
co-expression patterns, these genes are considered likely to be involved in seed coat development.
Confirmation of microarray data using qPCR
A number of gene targets were selected from the gene lists for independent validation using qPCR to confirm that the changes in expression as indicated by the microarray data were authentic and reliable. Candidates for qPCR were not chosen on the basis of
expression level per se. Some were selected based on a known involvement in seed
coat development e.g. At1g53500 (MUM4), At1g61720 (BAN), At5g23260 (TT16), and
At5g42800 (TT3/DFR), while others were selected at random from among putative
carbohydrate-active enzymes and regulatory factors identified in the microarray data. In addition, several genes of unknown function were also included. Genes were selected in these ways so that a broad range of genes was examined for confirmation of the microarray datasets with independent qPCR analysis.
qPCR analysis of 20 genes selected from comparisons relating to epidermal processes was carried out so that relative transcript abundance in Col-2 from 3 DPA to 7 DPA
(Figure 6A), and in ap2-7 with respect to Col-2 at 7 DPA (Figure 6B), could be
investigated. The microarray data and the qPCR data are in very good agreement for Col-2 in terms of whether gene expression increased, decreased or remained the same between 3 DPA and 7 DPA. Typically, the fold change determined by PCR was higher than that determined by the microarray. Similarly, in the case of the ap2-7 with respect
to Col-2 at 7 DPA, comparisons between the microarray and the qPCR are in close agreement, with the exception of At2g41070 and At4g18425. However it is worth noting that in these two exceptions the overall changes in gene expression were very small. Twenty genes from key comparisons related to endothelium processes lists were also selected and again qPCR was carried out so that relative transcript abundance in Ws-2 from 3 DPA to 7DPA (Figure 6C), and in tt16-1 with respect to Ws-2 at 3 DPA (Figure
6D), could be investigated. There is very good agreement between the microarray data and the qPCR data in all cases.
Next, 10 genes from each of these sets of 20 were analysed in more detail. For the 10 epidermal genes, microarray data was compared to qPCR data for all comparisons between Col-2 and ap2-7 that were determined experimentally in the microarray (Figure
3A). There is good agreement across all comparisons for all of these gene candidates.
Figures 7A and 7B show this analysis for two genes, At1g53500 (MUM4) and
At4g17695 (encoding the KANADI 3 transcription factor, and selected from the 2 fold changed gene lists). In the case of MUM4, the increase in gene expression at 7 DPA
followed by the decrease in expression at 11 DPA can be clearly seen, and the lack of
MUM4 expression in the ap2-7 background is also confirmed. In the case of At4g17695,
gene expression follows a similar pattern to MUM4 in wild type, and also appears to be
downregulated in ap2-7 compared with Col-2 at both 3 and 7 DPA. In the ap2-7
background, At4g17695 expression increases between 3 DPA and 7 DPA, indicating that AP2 is not the only regulator that influences its expression. The detailed expression
data for the other 8 genes examined is shown in Supplementary Figure 2 online.
For the 10 endothelial genes, microarray data was compared to qPCR data for all comparisons that were determined experimentally in the microarray between Ws-2 and
tt16-1 (Figure 3A). There is good agreement across all comparisons for all of these
gene candidates. Figures 7C and 7D show this analysis for two genes, At1g61720 (BAN) and At4g22870 (a leucoanthocyanidin dioxygenase selected from the two fold
changed lists). In the case of BAN, decreased expression can be seen between 3 DPA
and 7 DPA, and between 7 DPA and 11 DPA in Ws-2, and the lack of BAN expression
in tt16-1 in comparison with Ws-2 at 3 DPA is also confirmed. At4g22870 shows a
similar expression pattern to BAN. The detailed expression data for the other 8 genes
examined is shown in Supplementary Figure 2 online.
These data indicate that results from qPCR are comparable to the microarray data across all comparisons in the microarray.
In order to allow this data to be accessed by the research community, the datasets have been processed to allow them to be incorporated into the BAR expression browser, which can be accessed at http://www.dotm.ca/efp/cgi-bin/efpWeb.cgi or by following the link from the BAR website (http://bar.utoronto.ca/).
Identification of new gene targets based on microarray data
Candidates for reverse genetic studies were targeted to comparisons that were directly relevant to identifying genes involved in certain processes. Gene lists with transcripts showing at least 2 fold change in expression were used to identify candidates involved in the key processes of epidermal and endothelial development (Supplementary Table 1 online).
For the identification of candidate epidermal genes, two major groups of genes were considered: those expressed early in development (3-7 DPA) at a time when mucilage synthesis/modification and PA biosynthesis occur, and genes expressed later (7-11 DPA) during secondary cell wall formation/modification.
To identify early stage candidate genes involved in epidermal development, genes that were upregulated in Col-2 between 3 and 7 DPA were identified. Genes that were also
found to be downregulated in ap2-7 with respect to Col-2 at 7 DPA were considered
likely to be involved in early stage epidermal development. Venn analysis was then used to determine candidates that were present in both groups. This approach was also useful as the global analysis showed that GO categories alone cannot be used to select for groups of likely candidates that are involved in key seed coat developmental processes as there are a large number of genes in each ontology that are expressed in seed coats.
Similarly, genes whose expression increased between 7 and 11 DPA in Col-2, and were also down regulated in the ap2-7 background at 11 DPA, were considered as likely late
stage candidates.
When selecting candidates for phenotype screens, preference was given to genes putatively involved in carbohydrate synthesis and signaling, as well as transcription
factors. Next, the eFP browser at BAR was used to manually assess time and place of expression and those predicted to be expressed during the relevant phase of seed development were selected. T-DNA lines available from TAIR with insertions in the selected genes are currently being screened for phenotypes but no heritable phenotypes have been detected to date.
Genes that were downregulated in Ws-2 between 3 and 7 DPA, and in tt16-1 with
respect to Ws-2 at 3 DPA, were considered likely to be involved in endothelium development since tannin biosynthesis in the endothelium occurs in the wild type at 3 DPA but not in the tt16-1 mutant. Fifty-three loci were selected (Supplementary Table 2
online) and screened for changes in seed coat coloration, but no new transparent testa mutants have been identified to date.
DISCUSSION
This work presents the first comprehensive gene expression profiling study specifically for seed coat development in the model plant Arabidopsis thaliana. A genetic approach
using mutants defective in seed coat development, in combination with physical removal of the embryo from the seed coat, was used to identify genes expressed in specific seed coat cell types at specific times in development. The selected mutants were ap2-7
(defective in epidermal and palisade cell development) and tt16-1 (defective in
endothelial development). The sectioning of developing seeds from these genotypes confirmed that other seed coat cell layers develop normally (Figure 2), confirming the specificity of the effects of ap2-7 and tt16-1 within the seed coat.
Genome-wide expression profiling
Figure 3A shows all of the comparisons that were made experimentally, along with the numbers of differentially regulated genes with a change in expression of more than two fold. Figure 3B shows several additional comparisons that were inferred from the direct comparisons shown in Figure 3A. Although the numbers of differentially regulated genes may seem high on first inspection, the tissue used for these microarrays contains three distinct cell types from the seed coat (epidermis, palisade, and endothelium), cells of the inner integument that undergo cell death, and endosperm. These five cell types
are all undergoing distinct and complex developmental transitions. In support of this hypothesis, it is important to note that there are approximately three to four times the number of differentially expressed genes between different stages in the same genotype compared to the same stages in different genotypes. Such differences in the number of differentially expressed genes is expected because when comparing stages of development, changes in gene expression for 4-5 cell types are detected whereas when comparing mutant versus wild type only changes in the small number of cell types affected by the mutation (endothelium or epidermis/palisade) are detected. The exception is the comparison between Col-2 and Ws-2 at 11 DPA (Figure 3B) where there are also many more genes differentially regulated. This may reflect differential transcriptional regulation in these diverse ecotypes as has been previously observed (Chen et al., 2005). Although slight differences in growth rate was observed between these two ecotypes, if this variation is due to differences in staging and sampling then variation between biological samples should also be evident, but this is not the case. Therefore, it seems plausible that the major contributing factor could be natural variation associated with regulatory factors between these ecotypes.
In addition, although comparisons between mutants and the corresponding wild type represent changes caused by a mutation in a single gene, that gene product controls differentiation of at least one cell type and thus must affect several developmental and biochemical processes. The numbers of differentially regulated genes between each time point in wild type are broadly in line with other studies including those that examined gene expression in ovules in wild type vs. ovule defective mutants (Skinner and Gasser, 2009), and during leaf senescence (Buchanan-Wollaston et al., 2005). Overall, the data shows that seed coat development uses expression of over 50% of the genes in the genome to regulate and coordinate developmental processes that operate in this complex tissue, as mentioned in the Results section on differential expression between wild types.
The clustering of 2 fold changed genes using GO classifications (Figure 4) showed that several major developmental processes such as mucilage synthesis and columella synthesis could be identified using this analysis. However, as large numbers of genes
are present in each GO category, further selection as described here may be useful in selecting candidates for reverse-genetic analyses.
Differential expression between wild types
One interesting finding of the microarray experiments was the difference in the number of differentially expressed seed coat genes between the two wild types. As both genotypes follow the same developmental program, it had been expected that similar numbers of genes would be expressed in each, and that the gene identities would be the same. However, this was not the case, as there were large differences in the number of genes expressed (Figure 3B), with only approximately 50-60% of the genes from any two comparable Col-2 and Ws-2 lists overlapping at any of the three selected developmental points (Table 2). However, when all the expressed genes at these three stages are considered, the overlap is much higher, in accordance with the fact that both ecotypes develop a normal seed coat. These data suggest that the observed differences in gene expression between the two ecotypes relate to differences in the relative timing of seed coat differentiation due to differential growth/differentiation rates and not to major differences in the differentiation process itself.
Expression of BAN in the tt16-1 background
For the analysis of the microarray data, BAN was selected as a marker gene for
comparing expression data between the microarray, the literature and independent qPCR data in tt16-1 with respect to Ws-2 at 3 DPA (Table 4). Unexpectedly, microarray
data did not show a large decrease in expression in the tt16-1 background, despite
promoter studies that have shown the BAN promoter to be downregulated in tt16-1
(Debeaujon et al., 2003; Nesi et al., 2002) and qPCR data from this study that did indicate a significant down regulation in the tt16-1 background. Although the reason for
this anomaly in the data is unclear, several possible explanations can be ruled out. First, the probe chosen for the array appears to function correctly because BAN expression
levels are as expected in Ws-2 i.e. expression is highest at 3 DPA with significant down regulation between 3 and 11 DPA (Table 1). Second, the problem is unlikely to lie with the staging of the biological sample or isolation of the mRNA since qPCR results using
the same RNA showed a large reduction in BAN expression in the tt16-1 background
and the expression of other endothelial-expressed genes examined was reduced as expected. However, we cannot rule out the possibility that the probe designed for BAN in the AROS oligo array is not optimal for detecting hybridization signal.
Validation of array data using qPCR
Overall there is good agreement between the microarray and the qPCR, indicating that the microarray data is an authentic representation of gene expression in the RNA samples and should be a valuable resource for researchers interested in seed coat and endosperm development.
In the case of the genes where there is poor correlation (e.g. At2g41070 and At4g18425, Figure 6B), these genes do not show significant changes in expression between the stages examined, and therefore the observed variability likely illustrates that the array data is not accurate below the 2 fold cut off, as would be expected. This highlights the importance of independent validation of expression levels, especially when nearing the cut off limits for significance. In addition, changes in expression as determined by more sensitive qPCR method were generally higher than those from the microarray but this is a common phenomena (Jiang and Deyholos, 2010).
Identification of candidate genes for seed coat development
Screening for transparent testa mutants based on seed colour or seed mucilage mutants based on the extrusion of seed mucilage upon imbibition did not yield any potential novel candidates. This may indicate the previous screens mutants have identified most of the genes that could be identified in this manner and that other mutants could be found only with more sensitive screening e.g. biochemical assays. Mutations in individual genes involved in these processed may not show phenotypes due to redundancy. This hypothesis could be tested by making double or triple mutants using mutations in homologous genes that are both expressed in the target tissue. Finally, some genes with differential expression in the seed coat may not have been detected by our analysis because the peak of expression lies between the time points sampled. For example, one gene we have identified as having differential expression
during seed coat development was not detected in the microarray because its peak expression was at 5 DPA with low levels of expression at both 3 and 7 DPA (E. Esfandiari, G. Levesque-Tremblay and G. Haughn, unpublished results).
New insights into seed coat development and implications for other seed systems
The data presented in this paper indicate that the developmental programs in the inner and outer integuments function relatively independently. This is supported both by morphological and histological analysis (Figures 1 and 2) and by examination of the expression of different genes in the two mutant backgrounds (Table 3). Although the expression of the genes examined indicates that epidermal/palisade and endothelial processes are independent, the possibility that expression of some epidermal/palisade genes is affected by loss of endothelial differentiation, or vice versa, cannot be ruled out. Important implications of these findings include the possibility of targeted genetic manipulation of individual cell layers in the seed coat to engineer desirable phenotypes e.g. in crops, without affecting the other layers of the seed coat.
During this analysis, it was confirmed that neither ap2-7 nor tt16-1 are transcriptional
null alleles because transcript of each gene was detected in its own mutant background
(Table 3). It was also revealed that AP2 expression is upregulated in the ap2-7
background between 3 and 7 DPA, suggesting that AP2 either directly or indirectly
autoregulates its own expression. Conversely, it does not seem that TT16 autoregulates
its own expression, as analogous increases in TT16 transcript were not seen in the tt16-1 background. This finding was supported by qPCR results that also indicate that TTtt16-16
does not appear to be involved in regulating its own expression (Figure 6C and Supplementary Figure 2B online).
These data sets are also valuable tools for other researchers and have been made publically available via a custom eFP interface (http://www.dotm.ca/efp/cgi-bin/efpWeb.cgi) and at the GEO depository (http://www.ncbi.nlm.nih.gov/geo/). In addition, the microarray data should be useful for identifying seed coat specific
promoters. Indeed, we have recently identified one such promoter using the data (Z. Jin, A. Abdeen, E. Esfandiari, T Western and G. Haughn, unpublished results).
Therefore, this work provides seed coat gene expression data sets, and provides a starting point for identification of putative candidate genes in involved in seed coat development and promoter identification. Finally, as Arabidopsis is closely related to the economically important crop Canola (Brassica napus) and is a model plant species, the
data generated here should also provide useful information for discovery of new gene targets with potential for improving seed coat characteristics in this and related crops.
MATERIALS AND METHODS Plant materials
ap2-7 was isolated from an EMS-mutagenised population in the Col-2 background
(Kunst et al., 1989). tt16-1 is a T-DNA insertion line in the Ws-2 background (Nesi et al.,
2002) that were received as a gift from Loϊc Lepiniec, Seed Biology Laboratory, IJPB, INRA, France.
Seeds were germinated on AT minimal medium (Haughn and Somerville, 1986) in
growth chambers at 20°C under continuous light (90 to 120 µmol m-2s-1
photosynthetically active radiation [PAR]) and then transferred at 7 to 10 days after germination to prepared soil mix (Sunshine Mix 5, Sun Gro Horticulture Ltd, Seba Beach, Alberta, Canada) watered once with liquid AT medium, then grown under the same conditions as above.
For staging of siliques, open flowers (0 days post anthesis, DPA) were marked with non-toxic, water-soluble paint to allow the selection of developing siliques at precise ages. In the case of ap2-7, flowers were also hand pollinated using WT pollen at 0 DPA
as they produce little pollen and are somewhat infertile.
Tissue preparation and RNA extraction
Seed coat isolations were performed using a dissecting microscope and forceps. Gentle manipulation with fine forceps allowed the release of embryos from the micropylar end
of the seed coat. Although flowers were staged to determine the developmental stage of the seed, the released embryo was also used to check that the correct stage was harvested. Isolated seed coats were cut into two pieces and, while holding the seed coat with forceps, the endosperm of early stages was washed away with a solution of 5% sucrose in 0.1% RNAlater solution (Ambion, Cat# AM7021). Replicates of dissected seed coats for each stage were collected in separate Eppendorf tubes in dry ice and stored at -80°C before extraction. For 3 DPA samples, 40 seed coats were collected, and for 7 and 11 DPA samples, 20 seed coats were collected.
Total RNA was extracted from each seed coat sample using the RNAqueous Micro kit (Ambion, Catalog# 1927) with a minor modification as follows. The seed coat tissues were crushed completely with a plastic pestle in Eppendorf tubes in 250 µL lysis buffer, then centrifuged at 13200 rpm for 2 minutes. 200 µL of supernatant was removed to a new Eppendorf tube and the extraction was completed according to the kit protocol. The resulting RNA was used both for microarray hybridisation and qPCR.
RNA amplification, RNA labelling and microarray hybridization, array scanning and data processing
mRNA amplification was carried out using the MessageAmp aRNA kit (Ambion, Catalog# 1750) according to the supplied protocol. During the second round of in vitro
transcription, aminoallyl-UTP was incorporated into the newly synthesized aRNA by including 3 µL of aminoallyl-UTP (50mM) plus 2 µL of UTP (75mM) in the reaction instead of 4 µL of UTP.
The aRNA was purified before NHS ester Cy3 and Cy5 dyes were chemically coupled with the modified aRNA base. aRNA labelling and array hybridization were performed using the protocol of Wellmer et al. (2004).
Hybridized arrays were scanned with a Genepix 4000B microarray scanner (Axon Instruments, CA, USA) at 10µm resolution and 100% laser power using a dual laser scanning system that acquires and displays both wavelength channels as a ratio image in real time. The scanner was set to scan each line twice and to average the value obtained. PMT values were automatically balanced by scanning the slides three times
and calculating PMT values so that similar red and green overall intensities were obtained. The percentage of spots with saturated pixels was set to <0.25%. The image analysis was performed using GenePix Pro version 6.0 software (Axon Instruments, CA, USA). After automatic alignment, feature indicators were manually moved, resized and fine-tuned. Features that failed the background threshold criteria were flagged using a quality control filter so they could be removed from the analysis. The local background corrected spot fluorescence intensities for the Cy5 and Cy3 channels were saved as .gpr files. These .gpr files were used as the starting point for statistical analysis and were also analysed using GeneSpring GX 7.3.1 (Agilent Technologies, Inc.) to produce Figure 5.
Details of the microarray design and the complete set of .gpr files are available at http://www.dotm.ca/microarray/datlahaughn.html. Data has also been submitted to the GEO database at http://www.ncbi.nlm.nih.gov/geo/.
Statistical methods and microarray data analysis
The Cy3 and Cy5 channels within each array were calibrated using Huber's variance stabilization normalization algorithm and a difference statistic was calculated for each gene for each array hybridization (Huber et al., 2002). As all intensities were high, this difference statistic corresponded to the log-ratio. For each gene, a linear regression model was then applied to the data across all 68 arrays in the experiment to estimate the expected expression and variance in expression for each genotype (ap2-7, Col-2, tt16-1, Ws-2) at each time point (3 DPA, 7 DPA, 11 DPA), and the covariance between
expressions for each mutant / time point pair was also estimated (Chambers, 1992). These three estimates (expected expression, variance in expression and covariance) were then used to compute the expression difference and its standard error, both between genotypes at the same time point, and between time points within a genotype. A t-test was performed to calculate the p-value (the probability that the observed difference occurred by chance alone) for each comparison of interest for each gene. The false discovery rate (q-value) was calculated and used to correct for significant differences in gene expression that occur due to chance alone when performing multiple comparisons (Storey, 2002). As well as computing the difference in gene expression
with standard error, p-value and q-value for each gene, the estimated fold change with a 95% CI was also calculated. Graphics showing degree of differential expression were also produced.
Those genes for which at least one comparison of interest had a q-value less than 0.05 and a fold change greater than 2.0 in magnitude either up or down were selected for clustering. This set of 8714 genes was clustered using the divisive hierarchical clustering method DIANA (Kaufman and Rousseeuw, 1990). Data was presented as a heatmap as well as a text file detailing gene order. In addition, lists of significantly up or down regulated genes (defined as more than 2 fold change in expression) for comparisons of interest were generated.
Further manipulation of these gene lists was carried out using the Classification Superviewer to identify trends in gene expression patterns (Provart and Zhu, 2003), and
SmartDraw software to perform Venn analysis (www.smartdraw.com). The normalized
values were also formatted for insertion into a MySQL database behind the eFP browser interface using a custom perl script.
Quantitative PCR methods and analysis
Quantitative PCR (qPCR) was performed in optical 48 well plates using the StepOneTM
Real-Time PCR System (Applied Biosystems, Foster City, CA, USA). SYBR® Green
used to monitor dsDNA synthesis. Reactions contained 5 µl 2x SYBR® Green Master
Mix reagent (Applied Biosystems), 1 ng cDNA and 200 mM of each gene specific primer in a final volume of 10 µl. The following standard thermal profile was used for all PCR: 50°C for 2 min; 95°C for 10 min; 40 cycles of 95°C for 15 sec and 60°C for 1 min.
β-6-tubulin (AT5G12250F, ACCACTCCTAGCTTTGGTGATCTG-3'; AT5G12250R,
5'-AGGTTCACTGCGAGCTTCCTCA-3') was used as an endogenous reference. Data
were analysed using the StepOneTM Real-Time PCR System version 1.0 (Applied
Biosystems).
Mature, dry seeds were immobilised on glass microscope slides using double-sided sticky tape before being viewed and photographed using a dissecting microscope.
Developing seeds were fixed with 3% (v/v) glutaraldehyde (Canemco, Lachine, Quebec, Canada) in 0.5 M sodium phosphate, pH 7. Post-fixation with 1% (v/v) osmium tetroxide, dehydration, embedding, and sectioning were as described by Western et al. (2000). Thick sections (0.2 to 0.5 µm) were stained with 1% (w/v) Toluidine Blue O in 1% (w/v) sodium borate, pH 11, and photographed using a Zeiss AxioScop light microscope (Carl Zeiss, Oberkochen, Germany).
Digital photographs were manipulated with Adobe Photoshop (Adobe Photosystems, Mountain View, CA) to prepare Figures.
Mucilage mutant screens
Mucilage release from mature seeds was investigated using Ruthenium Red (Sigma-Aldrich) staining. For staining without shaking, seeds were hydrated for 1 hour in water, then the water was carefully removed without disturbing the seeds, and the seeds stained for 1 hour in 0.01% (w/v) Ruthenium Red before being viewed. Both steps were performed without shaking. For staining with shaking, the same procedure was followed except that seeds were shaken during hydration with water and during staining with Ruthenium Red. All samples were mounted in water and viewed using a dissecting microscope.
Digital photographs were manipulated with Adobe Photoshop (Adobe Photosystems, Mountain View, CA) to prepare Figures.
Acknowledgements
This work was funded by the Genome Canada and Genome Alberta project “Designing Oilseeds for Tomorrow’s Market” to G.W.H. and R.D.. We thank Loϊc Lepiniec for the gift of tt16-1 seeds. We also thank the staff at the University of British Columbia
Figure Legends
Figure 1. Seed morphology of mature seeds. Mature dry seeds (A-D), mature seeds
stained with Ruthenium Red without shaking (E-H), and mature seeds stained with Ruthenium Red with shaking (I-L) for Col-2 (A,E,I), ap2-7 (B,F,J), Ws-2 (C,G,K) and
tt16-1 (D,H,L). Mature tt16-1 seeds are pale as they do no accumulate PA, whereas
mature Ws-2, Col-2, and ap2-7 seeds accumulate PA normally and are brown at
maturity. Mature ap2-7 seeds do not release mucilage when hydrated and stained with
Ruthenium Red both with and without shaking whereas mature Col-2, Ws-2 and tt16-1
seeds do release mucilage with these treatments. Scale bars 100 µm.
Figure 2. Seed coat sections from developing seeds. Col-2 (A-C), ap2-7 (D-F),
Ws-2, (G-I), tt16-1 (J-L) at 3 DPA (A,D,G,J), 7 DPA (B,E,H,K) and 11 DPA (C,F,I,L) Stars
indicate indicates epidermal cells to compare: note that epidermal cells do not develop in ap2-7, but develop normally in tt16-1. Arrows indicate endothelial cells to compare:
note that endothelial cells do not accumulate PA in tt16-1 but develop normally in ap2-7.
Scale bar 10 µm.
Figure 3. Pair wise comparisons of gene expression in developing seed coats.
Dotted lines indicate comparisons examined directly using the microarray (A) or
indirectly from the microarray data (B). Arrowheads on the dotted lines indicate the
direction of comparison e.g. if relative expression in the stage/genotype at the tail of the arrow is lower than that at the head of the arrow, then the expression is considered to increase. Numbers represent the number of probes with more than 2 fold change either
increased (red arrows) or decreased (black arrows) expression between different developmental stages or genetic backgrounds. The stage of seed coat was determined by days post anthesis and checked using embryo morphology expected for that time under our growth conditions. A typical seed for each stage is shown to the right of panel A. Comparisons within genotypes at key developmental transitions, between wild types and mutants, and between mutants, as well as between wild types at the same developmental stage, are shown. Scale bar 50 µm.
Figure 4. Clustering of two fold changed genes by GO classification for key comparisons.
The Classification Superviewer at the BAR website was used to determine the freqeuncy of genes in each GO category, normalized to the number of genes on the microarray chip. Lists of 2 fold changed genes for comparisons of interest were used as the input. A value of more than 1 indicates that the data set is enriched for a given class of genes compared with the probes on the array. Results for the following comparisons are presented: upregulated at 7 DPA compared with 3 DPA in Col-2 (A); upregulated at 11 DPA compared with 7 DPA in Col-2 (B); downregulated in ap2-7 with respect to
Col-2 at 7 DPA (C); downregulated in ap2-7 with respect to Col-2 at 11 DPA (D); and
downregulated in tt16-1 with respect to Ws-2 at 3 DPA (E). Error bars are SD. GO
categories that a significantly over- or under-represented at p<0.05 are in black text.
Figure 5. Expression pattern of significantly changed genes. Gene expression is
shown as Normalised Intensity (log scale) where a value of more than 1 indicates an increase in expression and a value of less than 1 indicates a decrease in expression. Genes up-regulated (orange) or down-regulated (blue) are represented. (A) Expression patterns of significantly changed genes at 7 DPA in ap2-7 with respect to Col-2. MUM4
(At1g53500, white line, arrowed) is regulated by AP2 and is downregulated in ap2-7
compared with Col-2 at 7 DPA. (B) Expression pattern of significantly changed genes at
3 DPA in tt16-1 with respect to Ws-2. TT3/DFR (At5g42800, white line, arrowed) is
downregulated in tt16-1 compared with Ws-2 at 3 DPA.
Figure 6. Validation of microarray data using qPCR. A comparison of the relative
transcript abundance as determined using both microarray and qPCR data for 20 epidermal genes (for 2 key epidermal comparisons), and 20 endothelial genes (for 2 key
endothelial comparisons) is shown. (A) Col-2 from 3 DPA to 7 DPA, (B) ap2-7 with
respect to Col-2 at 7 DPA, (C) Ws-2 from 3 DPA to 7 DPA, and (D) tt16-1 with respect
to Ws-2 at 3 DPA.
Figure 7. Detailed validation of microarray data using qPCR. A comparison of the
for 2 epidermal and 2 endothelial genes for all comparisons between mutant and wild type determined experimentally in the microarray is shown. (A) At1g53500 (MUM4), (B)
Table 1. Fold changes in gene expression in wild type; microarray data vs. literature and eFP browser
3 DPA vs. 7 DPA Gene name
(At ID) array Col-2 array Ws-2 eFP literature *
MUM4 (At1g53500) up 4.6 fold at 7 DPA up 4.1 fold at 7 DPA up 1.7 fold at 7 DPA up at 7 DPA MUM2 (At5g63800) up 4.1 fold at 7 DPA up 2.1 fold at 7 DPA up 1.3 fold at 7 DPA up at 7 DPA GL2 (At1g79840) up 1.2 fold at 7 DPA up 1.2 fold at 7 DPA up 6.0 fold at 7 DPA NC BAN (At1g61720) down 2.0 fold at 7 DPA down 2.8 fold at 7 DPA down 4.1 fold
at 7 DPA down at 7 DPA
TT2 (At5g35550) down 4.5 fold at 7 DPA down 4.1 fold at 7 DPA down 12.6
fold at 7 DPA down at 7DPA
TT3/DFR (At5g42800) down 7.2 fold at 7 DPA down 4.6 fold at 7 DPA down 3.2 fold
at 7 DPA down at 7 DPA
LDOX/TDS4 (At4g22880) down 3.5 fold at 7 DPA down 4.6 fold at 7 DPA down 12.2
fold at 7 DPA down at 7DPA
7 DPA vs. 11 DPA Gene name
(At ID) array Col-2 array Ws-2 eFP literature*
MUM4 (At1g53500) down 4.9 fold at 11 DPA down 1.8 fold at 11 DPA down 4.0 fold
at 11 DPA down at 11 DPA
MUM2 (At5g63800) down 2.6 fold at 11 DPA down 2.7 fold at 11 DPA down 2.0 fold
GL2 (At1g79840) down 1.4 fold at 11 DPA down 1.1 fold at 11 DPA down 3.5 fold at 11 DPA ND BAN (At1g61720) down 7.8 fold at 11 DPA down 5.2 fold at 11 DPA down 14.8 fold
at 11 DPA down at 11 DPA
TT2 (At5g35550) down 2.0 fold at 11 DPA down 1.9 fold at 11 DPA up 1.2 fold at
11 DPA down at 11 DPA
TT3/DFR (At5g42800) down 2.8 fold at 11 DPA down 4.0 fold at 11 DPA down 3.2 fold
at 11 DPA down at 11 DPA
LDOX/TDS4 (At4g22880) down 4.1 fold at 11 DPA down 4.1 at 11 DPA down 2.6 fold
at 11 DPA down at 11 DPA
Table 2. Numbers of 2 fold changed genes common to Col-2 and Ws-2
Time point Total in Ws-2 Total in Col-2 Common to Ws-2 and Col-2 Only in Ws-2 Only in Col-2 down 7 DPA vs. 3 DPA 1883 1470 916 967 554 up 7 DPA vs. 3 DPA 2132 2161 1403 729 758 down 11 DPA vs. 7 DPA 990 3074 668 322 2406 up 11 DPA vs. 7 DPA 1098 2064 561 537 1503