An Automated Framework for Power-Efficient Detection
in Embedded Sensor Systems
by
Ari Yosef Benbasat
S.M., Massachusetts Institute of Technology (2000) B.A.Sc., University of British Columbia (1998) Submitted to the Program in Media Arts and Sciences,
School of Architecture and Planning,
in partial fulfillment of the requirements for the degree of Doctor of Philosophy in Media Arts and Sciences
at the
MASSACHUSETTS INSTITUTE OF TECHNOLOGY February 2007
c
Massachusetts Institute of Technology 2007. All rights reserved.
Author
Program in Media Arts and Sciences February 9, 2007
Certified by
Joseph A. Paradiso Associate Professor of Media Arts and Sciences Program in Media Arts and Sciences Thesis Supervisor
Accepted by
Andrew B. Lippman Chair, Departmental Committee on Graduate Students Program in Media Arts and Sciences
An Automated Framework for Power-Efficient Detection in Embedded Sensor Systems
by
Ari Yosef Benbasat
Submitted to the Program in Media Arts and Sciences, School of Architecture and Planning,
on February 9, 2007, in partial fulfillment of the requirements for the degree of
Doctor of Philosophy in Media Arts and Sciences
Abstract
The availability of miniature low-cost sensors has allowed for the capture of rich, multi-modal data streams in compact embedded sensor nodes. These devices have the capacity to radically improve the quality and amount of data available in such diverse applications as detecting degenerative diseases, monitoring remote regions, and tracking the state of smart assets as they traverse the supply chain. However, current implementations of these appli-cations suffer from short lifespans due to high sensor energy use and limited battery size. By concentrating our design efforts on the sensors themselves, it is possible to construct embedded systems that achieve their goal(s) while drawing significantly less power. This will increase their lifespan, allowing many more applications to make the transition from laboratory to marketplace and thereby benefit a much wider population.
This dissertation presents an automated framework for power-efficient detection in embed-ded sensor systems. The core of this framework is a decision tree classifier that dynamically orders the activation and adjusts the sampling rate of the sensors, such that only the data necessary to determine the system state is collected at any given time. This classifier can be tuned to trade-off accuracy and power in a structured fashion. Use of a sensor set which measures the phenomena of interest in multiple modalities and at various rates fur-ther improves the power savings by increasing the information available to the classification process.
An application based on a wearable gait monitor provides quantitative support for this framework. It is shown that the decision tree classifiers designed achieve roughly identical detection accuracies to those obtained using support vector machines while drawing three to nine times less power. A simulation of the real-time operation of the classifiers demonstrates that our multi-tiered classifier determines states as accurately as a single-trigger (binary) wakeup system while drawing half as much power, with only a negligible increase in latency.
Thesis Supervisor: Joseph A. Paradiso
An Automated Framework for Power-Efficient Detection in Embedded Sensor Systems
by
Ari Yosef Benbasat
The following people served as readers for this thesis:
Thesis Reader
Rosalind W. Picard Professor of Media Arts and Sciences Program in Media Arts and Sciences
Thesis Reader
Mani B. Srivastava Professor of Electrical Engineering University of California, Los Angeles
Acknowledgments
Some titles, by their very nature and long history, carry with them certain meaning. We know that Generals lead tens of thousand with courage, Rabbis preach the word of God with humility, and Knights face their challenges with grace. But such is not the case for the title of Doctor of Philosophy. It remains to most an unknown, an enigma. The title carries with it only what the public sees in their few encounters with us. And thus it behooves us to show that this title does not represent what we have learned, but instead what that hard earned knowledge has given us: a measure of courage, a dose of humility, and a glimmer of grace.
Joe Paradiso has been instrumental in ever aspect of my career, and my committee members, Rosalind Picard and Mani Srivastava, were invaluable. To them, and the many other friends and colleagues who have helped me get to this point, I make this promise: I will cherish the lessons you have taught me, and the example you have set. I will remember that I have much still to learn, and that this is a blessing. And I promise to set an example to those who follow, so that one day they may lead.
Cambridge, MA February 2007
Contents
Abstract 3 List of Figures 13 List of Tables 15 Notation 17 1 Introduction 191.1 Embedded Wireless Sensing . . . 19
1.1.1 Background . . . 19 1.1.2 Current Status . . . 20 1.2 Solution . . . 21 1.2.1 Overview . . . 21 1.2.2 Relevant Systems . . . 22 1.2.3 Scope of Research . . . 25 1.3 Scenarios . . . 26 1.3.1 Medical Wearables . . . 27 1.3.2 Remote Monitoring . . . 30 1.3.3 Distributed Tracking . . . 32 1.3.4 Notable Thresholds . . . 34 1.4 Contributions . . . 34 2 Form of Solution 37 2.1 Overview . . . 37 2.2 Design Roadmap . . . 39 2.2.1 Hardware . . . 39
2.2.2 Data Collection and Markup . . . 41
2.2.3 Classifier Construction . . . 41 2.2.4 Solution Embedding . . . 43 2.3 Structural Limitations . . . 45 3 Related Works 47 3.1 Academic Work . . . 47 3.1.1 Design Principles . . . 47
3.1.2 Implementation Techniques . . . 48
3.1.3 Related Disciplines . . . 52
3.2 Consumer Devices . . . 54
4 Hardware Design and Implementation 57 4.1 Overall Design . . . 57
4.1.1 Motivation . . . 57
4.1.2 Goals . . . 58
4.1.3 Modular Design Philosophy . . . 59
4.2 Hardware Instantiation . . . 60
4.2.1 Mechanical Structure . . . 60
4.2.2 Electrical Interconnects . . . 61
4.2.3 Common Component Selection . . . 62
4.2.4 Individual Panes . . . 63
4.3 Software Instantiation . . . 67
4.4 Related Works . . . 67
4.5 Sample Uses . . . 69
4.5.1 Wearable Gait Laboratory . . . 70
4.5.2 Prototyped Systems . . . 70
4.6 Summary . . . 71
5 Pattern Recognition Design and Implementation 73 5.1 Sample Data Sets . . . 73
5.1.1 Collection . . . 74
5.1.2 Annotation . . . 76
5.1.3 Feature Extraction . . . 77
5.2 Data Classification . . . 81
5.2.1 Classifier Selection . . . 81
5.2.2 Priors and Costs . . . 84
5.2.3 Overview of Decision Tree Construction . . . 86
5.2.4 Decision Tree Splitting Criteria . . . 87
5.2.5 Decision Tree Pruning . . . 94
5.3 Examinations of Features . . . 96
5.3.1 Consistency over Window Size . . . 97
5.3.2 Consistency over Frequency . . . 102
5.4 Examination of Test Cost Weighting . . . 104
5.4.1 Discussion of Testing Methodology . . . 104
5.4.2 Results . . . 106
6 Design for an Embedded Implementation 113 6.1 Program Flow . . . 113
6.2 Specific Issues . . . 115
6.2.1 Conversion from MATLAB . . . 115
6.2.2 Power cycling . . . 119
7 Analysis 123
7.1 Testing Scenario . . . 123
7.2 Parameters of the Training Set . . . 125
7.2.1 Sensors . . . 125
7.2.2 Features . . . 128
7.2.3 Test Cost . . . 129
7.2.4 Priors and Number of Examples . . . 130
7.3 Performance of Classifier . . . 130
7.3.1 Methodology . . . 130
7.3.2 Full Sensor Set . . . 132
7.3.3 Without Redundant Sensors . . . 139
7.4 Simulation of Real-time Operation . . . 142
8 Future Work 159 8.1 Improvements to the Implementations . . . 159
8.1.1 Overall . . . 159
8.1.2 Hardware . . . 160
8.1.3 Pattern Recognition . . . 161
8.1.4 Design for an Embedded Implementation . . . 164
8.2 Expansion of Scope . . . 165
8.2.1 Networked Sensor Systems . . . 166
8.2.2 Unsupervised Solutions . . . 168
8.2.3 Active sensors . . . 170
9 Conclusions 171 9.1 Overview of Work . . . 171
9.1.1 Summary of Application Designer Tasks . . . 173
9.1.2 Assumptions . . . 173
9.2 Detailed Contributions . . . 174
A Other Applications Using The Modular Sensor Platform 177 A.1 Constructed Applications . . . 177
A.1.1 Roballet . . . 177
A.1.2 Novel Musical Controller . . . 178
A.2 Prototyped Systems . . . 180
B Details of Data Collection 183 B.1 Sensor Measurement Axes . . . 183
B.2 Stream Used for Classifier Training . . . 184
B.3 Stream Used for Real-time Simulation . . . 186
C Overview of Changes to MATLAB Decision Tree Implementation 189
List of Figures
2-1 Flowchart of proposed hardware solution . . . 38
2-2 Sample decision tree . . . 43
4-1 Six boards in the modular architecture . . . 63
4-2 Wearable gait analysis platform and sensor attachment . . . 70
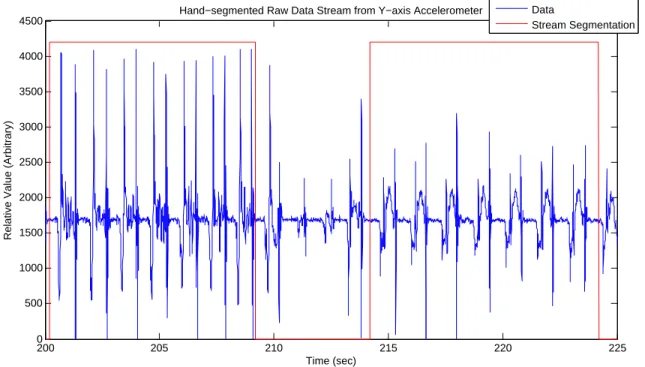
5-1 Sample data stream and windowed feature . . . 78
5-2 Classification tree split . . . 88
5-3 Comparison of the Gini and information splitting criteria . . . 90
5-4 Portion of sample data stream with segmentation . . . 97
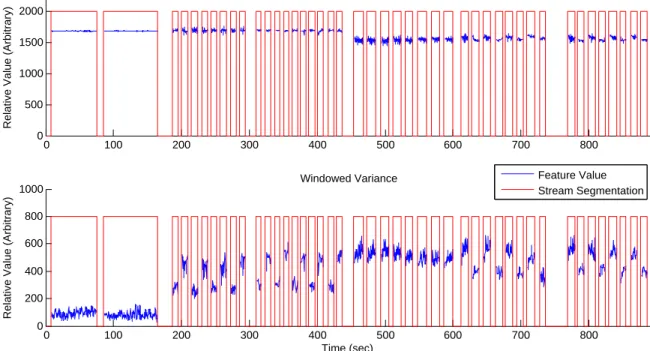
5-5 The windowed mean and variance features (1.2 sec window size) . . . 98
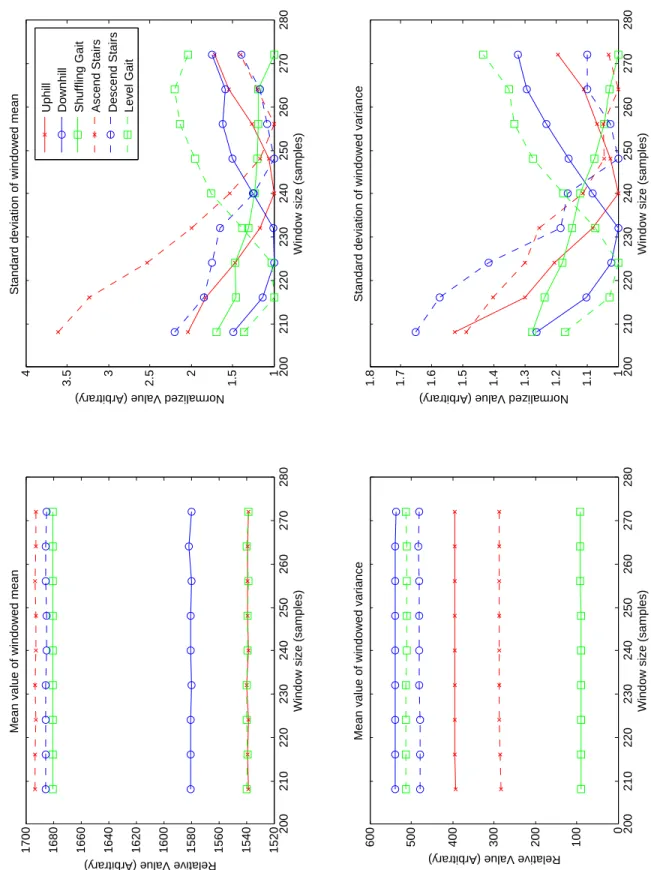
5-6 Effect of window size on mean and variance features . . . 99
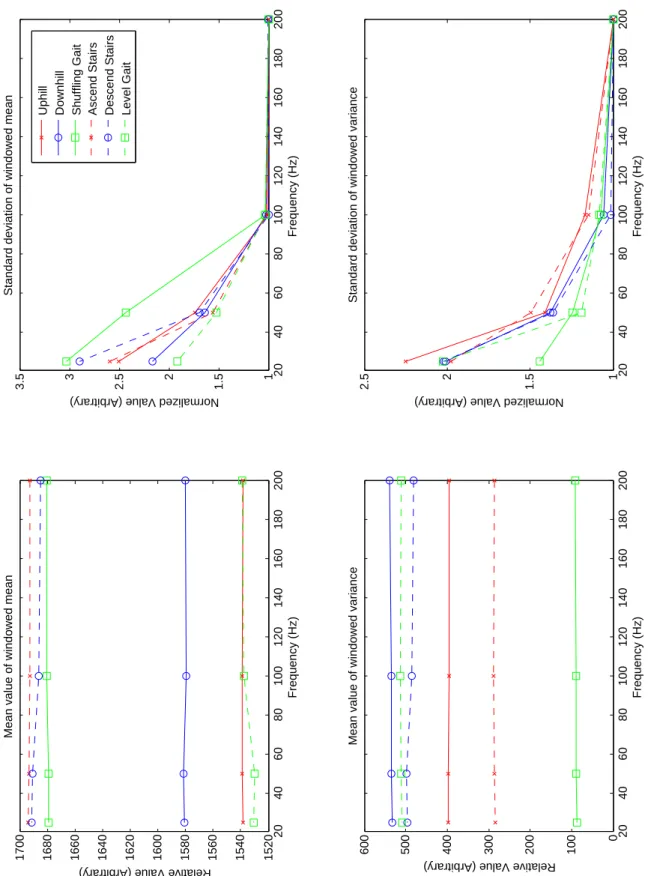
5-7 Comparison of windowed maximum and windowed 90th percentile features 101 5-8 Comparison of windowed minimum and windowed 10th percentile features . 101 5-9 Effect of sampling frequency of mean and variance features . . . 103
5-10 Effect of test cost weighting on classifier performance (Pima) . . . 108
5-11 Sample classification trees for Pima database . . . 109
5-12 Effect of test cost weighting on classifier performance (BUPA) . . . 111
5-13 Effect of test cost weighting on classifier performance (Clev) . . . 112
6-1 Timeline of a single cycle of the embedded hardware. . . 119
6-2 Latency and wasted power for various sensor de/activation scenarios . . . . 122
7-1 Oscilloscope captures of sensor settling times . . . 126
7-2 Oscilloscope captures of sensor wake up current . . . 126
7-3 Power/accuracy tradeoff for various subsets of the data (1) . . . 133
7-4 Power/accuracy tradeoff for various subsets of the data (2) . . . 134
7-5 Power/accuracy tradeoff for decision trees and SVM . . . 135
7-6 Power/accuracy tradeoff for decision trees and SVM (swapped axes) . . . . 136
7-7 Power/accuracy tradeoff for decision trees and SVM (no tilt sensors) . . . . 140
7-8 Power/accuracy tradeoff for decision trees with/out tilt sensors . . . 141
7-9 Decision tree for uphill gait classifier (f=200 Hz) . . . 146
7-10 Real-time simulation of uphill gait classifier . . . 147
7-11 Decision tree for downhill gait classifier (f=200 Hz) . . . 148
7-13 Decision tree for shuffling gait classifier (f=25 Hz) . . . 150
7-14 Real-time simulation of shuffling gait classifier . . . 151
7-15 Decision tree for stair ascent classifier (f=50 Hz) . . . 152
7-16 Real-time simulation of stair ascent classifier . . . 153
7-17 Decision tree for stair descent classifier (f=25 Hz) . . . 154
7-18 Real-time simulation of stair descent classifier . . . 155
7-19 Decision tree for level gait classifier (f=200 Hz) . . . 156
7-20 Real-time simulation of level gait classifier . . . 157
A-1 Roballet sensors . . . 178
A-2 FlexiGesture controller . . . 179
B-1 Coordinate axes for the sensor module . . . 183
B-2 Locations for training set data collection . . . 185
List of Tables
1 Summary of nomenclature of variables . . . 17
1.1 Power usage breakdown of selected embedded nodes/networks . . . 23
1.2 Power usage of selected commercial wearable devices with added IMU . . . 24
2.1 Comparison of energy cost of common data operations on a 64 byte block . 44 3.1 Summary of features of related projects . . . 49
4.1 Summary of major components of the modular circuit boards. . . 64
5.1 Summary of data sets used for testing . . . 104
7.1 Sensor wake up and active power usage . . . 127
7.2 Number of operations per time step to calculate various features . . . 128
7.3 Total energy usage of the sensors . . . 129
7.4 Power usage of sensors by sampling rate. . . 129
7.5 Number of examples of each activity in training set . . . 130
7.6 Highest accuracy achieved by Gaussian SVM . . . 137
7.7 Comparison of best practises classifiers to this framework . . . 138
7.8 Energy usage of trees in real-time simulation . . . 144
7.9 Energy savings of trees in real-time simulation . . . 144
Notation
To simplify references to various specifications of the hardware, we adopt the following structure:
ParameterPart,Action
For example, the time to wake up the microprocessor is denoted:
tµP,Wake
A full listing of symbols used can be found below: Parameter Symbol Energy E Power P Time t Part Symbol Microprocessor µP Sensor (ith of n) Si
Action/State Symbol Used with:
Waking up Wake Microprocessor/Sensor
Active On Microprocessor/Sensor
Analog to digital converter sample Adc Microprocessor Execute decision tree Tree Microprocessor Execute designated response Resp Microprocessor Calculate feature Feat Microprocessor Operation Cycle OP Microprocessor
Sampling Cycle Cyc Alone
Chapter 1
Introduction
1.1
Embedded Wireless Sensing
1.1.1 Background
Embedded wireless sensor nodes and networks are currently being used in a wide ar-ray of applications. These include, but are certainly not limited to, detecting degenera-tive diseases[79], monitoring remote regions[102], and ensuring the safety of housebound elders[52]. Such systems are part of a new class of sensor-driven applications, leveraging the decrease in both price and size of components to allow rich, multimodal data streams to be captured by very compact systems. However, limited battery size and continuous sam-pling of these sensor nodes greatly constrains their lifespan. By concentrating our design efforts on the sensors themselves, rather than on the networks, it is possible to construct a class of embedded systems which achieve their sensing goal(s) while drawing significantly less power. This will increase the lifespan of embedded sensor nodes, allowing many more applications to make the transition from laboratory to marketplace and thereby benefit a much wider population.
1.1.2 Current Status
Size, weight and battery life directly affect user acceptance and marketability of sensors and therefore greatly influence the ability of such technological innovations to improve people’s lives and provide societal benefits. In the case of stand-alone sensor systems, the size of the battery effectively determines size of device1. As the sensors and associated electronics have been reduced in size, the volume dedicated to powering them (usually via batteries) has remained roughly constant[95]. Sensor systems can both be made smaller and utilized in a larger set of applications if their battery size is reduced by lowering the power consumption.
As well, as sensors nodes increase in functionality (i.e. the number and extent of features), they require increasingly frequent use and hence replacement or recharging of batteries. This creates an increasing gap between the capabilities of a device and its lifespan under normal use. Thus, current applications of embedded sensor systems are mostly limited to prototype and experimental usage (see section 1.3 for a more detailed discussion) or very simple implementations (see section 3.2). The most common solutions to limited lifespan are to tether the system to wall power[66] or to confine the system to sampling at such a low rate that the lifespan is satisfactory[120]. Obviously, the full potential of wireless and wearable sensors is not being achieved through these systems, as their limited lifespans, sensing capabilities or update rates greatly reduce the utility to the end-user.
For example, long-term medical monitoring is often hindered by its power consumption. Both fixed environmental sensors, which cannot provide a full picture of an active patient’s movements, or body-worn sensors, which require large battery packs and/or frequent re-placement, are inadequate.
Left solely to the progress of semiconductor technology and battery chemistry, the situation will eventually become untenable and the rate of technology transfer to the consumer will slow or stop, as commercial devices currently use only the simplest forms of power manage-ment (see section 3.2). The solution then is to make sensor systems more power-efficient through their design.
1For other types of systems, such as PDAs and mobile phones, much of the volume is consumed by the
1.2
Solution
1.2.1 Overview
This dissertation work improves the capability/lifespan gap in wireless sensor nodes through high-level algorithmic means rather than low-level technical ones. We started from a fun-damental: the raison d’etre of these devices is to collect and process data and therefore the design of the sensors should be central2. We concentrated on reducing the energy usage of the sensors (and the associated processing) within the nodes. This metric was chosen since it is both general and tractable, though it is important to note that any power savings in the form of reduced sensing also correspond to further power savings through a reduction in:
• data to process
• data to transmit or store
• data to analyse (particularly for a human expert).
Any gains through this work can be considered independently from the large body of work exploring power savings through improvements to ad-hoc networking protocols and pro-cessor efficiency. This includes improvements to the software[111], hardware[1], and RF efficiency[69], which are described in more detail in section3.1.3.
Our goal is to extract the necessary or desired information available in the environment at any given point in time for the smallest outlay of energy. Specifically, the power drawn by the sensor node is reduced by dynamically adjusting the activation and sampling rate of the sensors, such that only the data necessary to determine the system state is collected at any moment. Use of a sensor set which detects the phenomena of interest in multiple fashions and various accuracies further improves the savings by increasing the possible choices for the above process. Overall, the amount of data collected by the system is reduced without affecting the amount of useful information collected.
The form of the solution is such that the sensor sampling rates, as well as the transitions between them, are generated in a semi-autonomous fashion and can easily be embedded in hardware. Therefore, the work should be applicable to a wide variety of applications.
2
1.2.2 Relevant Systems
While the processor and RF transceiver are by far the largest power drains in long-range wireless sensor networks, sensor power usage is often on par with them in light-weight and wearable instantiations[100,112]. Table 1.1gives a breakdown of the power usage in three field-tested wireless sensor systems.
The gait shoe is a wearable medical sensor for collecting information about a patient’s manner of walking. It is centred on an inertial measurement unit (IMU) sampled at 200 Hz, with the collected data transmitted directly to a wireless basestation. ZebraNet is a wireless sensor network composed of collared zebras. The core components of each collar are a long-range radio and a GPS unit sampled once every four minutes. The zebras themselves comprise a mobile peer-to-peer network whose goal is to aggregate all sensor readings (from all the units) at each node. Finally, the Great Duck Island habitat monitoring project (GDI) was a wireless sensor network designed to track the Storm Petrels which populate the eponymous island. Sensor nodes were placed at the entrance of the birds’ nests to record their comings and goings through measurement of the humidity and ambient temperature every five minutes. This data was sent to a gateway node - the first level of a hierarchical network which eventually transmitted the data off the island. For each project, power usage is broken down into three categories: the baseline power to run the processor and the wireless link, the power expended in sensing, and the power used in responding to the sensor data. In each application, the percentage of the power used for each of these categories is more important than the total power usage.
The baseline power varies with the level of networking in each application. Since the gait shoe is part of a hub and spoke network, it does not monitor an RF channel and therefore has low baseline power usage. ZebraNet uses a moderate amount of power for networking, since even though the radio is high power, it is rarely used. By contrast, the GDI radio is relatively low power but is very frequently powered up to listen for messages, and therefore uses almost four-fifths of the static power draw. As for the power usage of the sensing, the gait shoe samples a half dozen sensors at a high rate and ZebraNet samples a single high power sensor at a low rate, leading to sensing drawing approximately half the total power
Baseli ne Sens ing Res p onse Sys t em Pr o ce ss or RF Mon itori ng T yp e P o w e r T yp e P o w e r % P o w er for Sens ing/R esp ons e Gai t S ho e [ 8 , 79 ] 35 mW N/A IMU e v ery 5 ms 65 mW Tx Data 15 mW 70 Ze b raNet [ 57 , 129 ] 15 mW 13 mW GP S e v ery 4 min 30 mW Tx Data 0 .2 mW 52 Gr e at Duc k Is lan d [ 71 , 116 ] 118 µ W 465 µ W Ligh t, h e at, h u m idit y ev e ry 5 m in 118 µ W Tx Data 14 µ W 19 T ab le 1.1: P o w e r u sage b reakdo wn of se lec te d em b e d ded no des /n e tw orks
Device Base Power Usage Increase from IMUa Magellan eXplorist 400 GPS unit[70] 275 mW 23%
iPod Shuffleb MP3 player[55] 67 mW 97% Motorola v60t GSM Cell phone[109] 20 mWc 325%
Quartz Watch Movementd[34] 1.7 µW 3.8 × 10⁵% Table 1.2: Power usage of selected commercial wearable devices with added IMU
a
From gait shoe as above (65mW)
b
2nd Generation
c
Standby power (strong signal)
d
ETA Trendlife F05.111
in each case. By contrast, the Great Duck Island project collects small amounts of data at a low rate, and therefore dedicates only one sixth of its power to sensing. Finally, since each of these systems is designed for data logging and off-node analysis, their sole response to the collected data is to transmit it wirelessly. The proportion of the total power usage is related to the net amount of data generated, with the gait shoe using a substantial amount of power to offload the data while ZebraNet and GDI both use negligible amounts.
Overall, each system dedicates a significant percentage of its power usage to collecting sensor data and responding to it. Further, it should be noted that the power used to listen to the radio in the two network applications is partially proportional to the amount of sensor data transmitted over the network (nodes also listen for instructions and network maintenance). Therefore, reducing sensing should lead directly to a reduction in both RF transmitter and receiver power usage.
At an application level, there is considerable interest in adding sensors to everyday devices, both for medical[91] and personal activity monitoring[83]. To a first order, the feasibility of doing so would be based on the increase in power usage (and decrease in battery life) caused by including sensing capabilities. Table 1.2shows the percentage increase in power usage of four common body-worn electronic devices if the IMU from the gait shoe above were to be added to them3.
It is interesting to note that the power usage of the IMU is significant in each case, even that of a portable GPS unit (which combines high power sensing with an LCD display). As for
3Although the power consumed by commercial inertial components has dropped somewhat since the gait
portable music players and cell phones, the IMU’s power usage is on the same order as that of the base device. Finally, while it is no surprise that a quartz movement draws negligible power compared to continuous data sampling, the magnitude of the ratio demonstrates that a wearable IMU whose power usage can effectively be ignored (as is the case with wristwatches, which have battery life in years) is not naively achievable. In fact, in all these cases, augmentation of the device with sensors without associated power management would most likely significantly reduce marketability by increasing the frequency of battery replacement or recharging.
1.2.3 Scope of Research
While any sensor system should be able to benefit from the techniques that were developed in this dissertation, it is helpful for the purposes of discussion and evaluation to concentrate on a specific class of systems. This and other related restrictions written into the scope of the problem statement are discussed below. Further limitations to the applicability of the work created by the structure of the proposed solution are discussed in section2.3. Possible expansions of scope and methods for overcoming the structural restrictions are given in section 8.2and section8.1, respectively.
Explicit Limitations
While many application areas can be addressed by this framework, the main constraint applied to this work was to limit our consideration to embedded sensor systems used in human-focused applications - those which collect parameters of human activity either directly (personal/on-body) or remotely (environmental/off-body). These systems would benefit most in terms of usability from reduced power drain as they are required to use batteries because of their mobility or inaccessibility, respectively. Also of importance is the large body of prototype applications in this area which allow for points of comparison.
This achieves two goals. Firstly, the relevant applications are narrowed to what is generally considered the consumer domain (lightweight, cheap and easy to use), corresponding to the
scenarios of interest (section 1.3). The scope of sensors and other electronics to consider in the hardware design is reduced in terms of acceptable size and cost, which corresponds roughly to accuracy and update rate for sensors and processing speed for microcontrollers. Secondly, the limitations should render tractable the optimization algorithms, which will be used to generate the real-time embedded software, by narrowing the range of appropri-ate/acceptable sampling rates as well as the space of useful features. The results of the design and calculations for this class of systems provide guidance to alter the optimization algorithms such that they can be applied to a wider range of systems.
Also, while nodes in collaborative wireless sensor networks could certainly benefit individu-ally from the algorithms developed, this would be a first-order approach. More interesting are the potential benefits to the network as a whole from the nodes informing their neigh-bours of their current data or sensing state, allowing them to adjust their own sensing to guarantee that the network (rather than the nodes) was collecting the available informa-tion in the most efficient fashion. This necessarily requires details of the network size and structure.
We also limit the systems examined to the use of passive sensors - those which measure the environment without affecting it. Active sensors (e.g. sonar, radar) - those which control the transmission as well as the reception of a measured signal - are excluded from the initial analysis for two reasons. Firstly, they can use one to two orders of magnitude more power than passive sensors, often making them inappropriate for low-power systems. Secondly, their power management is potentially more complex as both the output power and the sampling rate can be adjusted individually. Section 8.2.3 offers some avenues for incorporating active sensors into this framework.
1.3
Scenarios
While the application space specified is still quite large, there are a few broad categories that comprise the majority of the relevant published work. Within these categories, we consider device scenarios without consideration of lifespan limitations to demonstrate the possible benefits of our approach. We further discuss current implementations in these areas and describe how the ideas developed in this dissertation could improve their functionality.
1.3.1 Medical Wearables
Wearable devices for the collection of medically interesting and important data can be categorized based on the amount of user interaction involved. Those which are triggered by the user - such as a blood glucose monitor - can only be made more efficient through improvement in sensor technology. Those which collect data without direct interaction can be improved though more efficient determination of the user’s state, and therefore the value of collecting data, at a given moment.
As an example, we consider a shoe-based wearable system with electronics integrated into the heel and insole. The system captures both the inertial parameters of gait (manner of walking) as well as the pressure distribution under the foot. Changes in gait are surrogate markers for a variety of medically important phenomena, such as developmental maturation, likelihood of falling, and recovery from a stroke. Currently, clinical gait analysis usually is carried out in a confined environment - the patients typically walk less than 10 m per trial - using expensive vision-based motion capture systems. A wearable system, built by our group in conjunction with the Massachusetts General Hospital (MGH) Biomotion lab[79], is smaller and cheaper than these systems and can collect data in any environment. Gait parameters are measured using a full six degree-of-freedom inertial measurement unit (IMU) and an insole with pressure and bend sensors. The full set of sensors is polled at 75 Hz, and the data is wirelessly transmitted to a nearby basestation. The IMU is attached to the back of a patient’s shoe via a 4 in wide PVC attachment which protrudes 1.5 in. The attachment weighs approximately 300 g, including a 9 V battery which powers the system for roughly six hours continuously. This system was validated against motion-tracking and reaction force data from the MGH Biomotion lab and produced nominally identical results. However, the lifespan of a single cell is not sufficient for even a single day’s continuous usage. This is a product of the continuous collection and wireless transmission of the data4, which is appropriate for laboratory testing of limited duration where the patient is assumed to always be in motion. For general use, it is necessary to limit power usage while the patient is in one of a number of uninteresting states (standing still, non-ambulatory motion, etc.). At
4
the same time, the continuous sampling, analysis and storage of interesting motions allows for new approaches to long-term medical treatment, both of diagnosed and asymptomatic patients.
In the former case, continuous monitoring can be of benefit in a variety of fashions. Purely passive monitoring can collect data which will help a doctor plot the course of a disease and adjust medication both in type and dosage. Given that the data is being collected, there are also a number of simple parameters which the device can monitor and use to provide real-time feedback to the wearer. For example, Parkinson’s disease patients often suffer from a chronically stunted walk and can spontaneously break into a slow shuffling gait. Research indicates this condition improves when patients hear strong rhythmic cues from a metronome[119] or other music[87,90]. The wearable could easily detect the characteristics of such a gait, and could produce the appropriate beat to reestablish proper stride length and pace. If combined with a portable music device (e.g. iPod), it would be possible for these cues to be detectable only by the user, a benefit since most people prefer discrete systems. In the case of motor rehabilitation, the wearable could cue the patient towards correct movements and away from dangerous ones. The system would, in effect, be replacing sensing capabilities which the body had lost and needs to relearn. Finally, even fairly mundane medical problems such as a broken leg could be aided by this system. The normal recovery path involves taking an increasing portion of the normal weight on the damaged limb over time. While this is fairly difficult for the patient to judge accurately, it is trivial for the wearable, which could also keep track of progress and set the timeline accordingly. In this case, the system would be providing sensing capabilities which the body never had.
An example of a mature medical wearable is the cardiac defibrillator[26]. The device itself consists of a processor, lead electronics, capacitors and a battery (which occupies most of the volume), and is implanted subcutaneously with leads connected to the heart. The pro-cessor analyses the cardiac rhythm for tachycardia (fast heartbeat) or fibrillation (irregular heartbeat). In the case of tachycardia, small pacing shocks are administered to attempt to restore a normal rhythm. If this fails, or if the heart goes into fibrillation, a much larger shock is applied. The device also records all tachycardic episodes for later analysis. Despite
several small pacing shocks being administered daily, the device has a lifespan of approxi-mately four years. Of note is the device’s tiered output. While administering the shocks to correct a tachycardia, it is also charging the main capacitors in case of fibrillation. If a nor-mal rhythm is not restored, this charge is immediately available; if not, it is simply dumped. This assures readiness while minimizing the number of painful shocks administered. Such a tiered structure will be used in the analysis techniques of our proposed system.
The more interesting group of patients, in the long run, are those who are currently healthy (or at least asymptomatic). Any device used with such patients would have to be subtler, cheaper and easier to use than those used with the patients mentioned above. The benefits could be just as great, but for a much larger portion of the population. The device could learn the patient’s normal baseline over time, providing a valuable reference point which is normally not available to doctors, who tend to only see patients after they become ill. This baseline would allow for quicker diagnosis of conditions which express themselves through simple externally measured parameters such as motion and gait, since the comparison to be made would not be with the normal range for the population at large but the much narrower range of the patient alone. Also, knowledge of the patient’s normal state could help avoid false positives as well, allowing a doctor to differentiate between, for example, an abnormal gait caused by mundane influences (such as frequent caffeine consumption) rather than pathological ones.
Long-term tracking of asymptomatic individuals was examined in the doctoral work of Brian Clarkson[23]. The goal of this work was to show that reoccurring events in daily behaviour could be recognized and predicted based on body worn sensors. The specific sensors chosen were: forward and rear facing video (32x24 pixels, 10 Hz), audio (16 bits, 16 kHz) and 3 gyroscopes for orientation (8 bits, 60 Hz). A Pentium III processor and 10GB harddrive were provided to process and store the data (5GB a day), and the system was powered by four large lithium batteries (approximately the same volume as the rest of the components combined) which lasted for 10 hours. In postprocessing, the system recognized 19 different scenes with an overall accuracy of 97%. Activity prediction based on transition probabilities between scenes gave promising results for long-term activity analysis. Increases in the length of scenes such as walking to work could indicate normal aging (slow decline) or illness (rapid
decline). Reduction in the number of scenes seen would suggest risk of depression. However, as with the wearable gait laboratory, the prototype implementation presents a number of problems, key among them being device size and lifespan. More efficient data collection is a possible solution as data is collected continuously regardless of state. For example, the addition of more inertial sensors would allow for motion to trigger the camera, reducing both power and storage use for a minimal increase in volume. Such a technique is used in the wearable SenseCam system[43], which uses inertial data to select when to take pictures and to ensure the quality of the pictures by waiting for the user to be somewhat stationary first.
1.3.2 Remote Monitoring
The application space of remote monitoring encompasses those tasks where data needs to be collected about ambient phenomena or local fauna in an environment where the sensors themselves cannot be easily accessed. The data itself is either cached or transmitted wirelessly. This limitation can take the form of distant or hostile environments, where the ability to change batteries and recover data is limited, but also applies to consumer products which perform low priority tasks and therefore must not require large amounts of user attention or maintenance. While the monitoring in these scenarios is not of human activity, the concepts and concerns established in the last section still hold.
In the case of applications for hostile environments, we consider the monitoring and record-ing of the presence and activity of an endangered species. Wireless sensor systems are well-suited to this problem since they can operate unattended for long periods of time. Fur-ther, they often have a small enough profile to be a minimal intrusion. The system would likely collect environmental data (temperature, humidity, etc.) at fixed intervals, as well as using heat and light sensors to detect the animal of interest. A small cellphone-style camera might also be used. This data would help estimate the population size, correlate their activity levels with changing weather conditions, and otherwise capture data solely available in the natural habitat (i.e. without humans). Many other similar scenarios exist,
with the literature most often centring around security and military applications and the tracking of human or vehicular movement.
While there are a number of examples of remote monitoring, a particularly relevant one is the work done on battlefield and border monitoring by a group at the University of California at Berkeley and the Ohio State University[29]. Their work examines the problem of detecting and identifying civilians, soldiers and vehicles travelling through a dense sensor grid in remote terrain. The nodes themselves are 3.5 in x 3.5 in x 2.5 in, are placed roughly 30 m apart and act independently. The area of interest is monitored for activity using a passive infrared detector, which wakes a microphone and magnetic sensor upon trigger. These additional sensors are used to identify the source of the trigger. The project aims for 1000 hours of life on two AA cells, though this goal was not achieved. There are a number of reasons for this. Key among them is that the number of false alarms was far greater than predicted, with false triggers mostly caused by moving flora. This illustrates the danger of designing systems without the use of real-world sample data streams. Also, the system draws more power than necessary since it turns on all sensors after a trigger, while the acoustic sensors alone can be used to distinguish between humans and vehicles and draws far less power than the magnetic sensor. It is further noted that the fragility of this system (in this case the high false alarm probability) is a product of the ad-hoc fashion in which the classification algorithms were designed (in this case the setting of the thresholds[28]), while a more analytic approach would likely have both identified the flaw sooner and made it easier to correct. Our solution (chapter 2) presents such an approach.
In the case of low-priority applications, we consider a system for monitoring the long-term stresses on building members and civil infrastructure. Again, temperature and humidity would be of interest, as would pressure and bend sensors and inertial data from accelerom-eters. Size is again the key parameter, not only to avoid alteration or stress to the beams, but also to allow the sensors to be easily retrofitted to the members rather than having to be implanted at time of construction. The data recovered would prove useful for evaluating and improving structural designs using the force distributions measured under a variety of circumstances. Also, in rare cases, the data could give advance warning of possible damage which could be catastrophic if unchecked.
Building infrastructure monitoring using wireless sensor nodes is still nascent, leading to a lack of useful references. Currently, the two main lines of research are testing the use of established hardware (e.g. Motes[9]) which shows that it cannot handle the peak stresses seen[44] and the building of robust nodes from scratch which have not yet been deployed for testing[20]. The state of the research related to civil infrastructure is similar, with deployed systems able to measure conditions but not predict integrity[128] and more complicated systems still in the design stage[17].
The link between these cases is that in both we are most interested in fairly rare data. It is fundamental that the system be able to capture this data when it presents itself, which requires vigilance (i.e. at least minimal sampling at frequent intervals). These applications tend to be enormously power-limited, though it is possible to increase the lifespan of such devices by being more judicious about the data sampled. Rather than sampling a fixed amount from all sensors at fixed time periods, it is possible to sample small amounts of data from more appropriate sensors (state determination) and then determine whether to sample more (state response). Therefore, it should be possible to sample a large amount of data at a few time points rather than smaller amounts of data far more frequently. This would have the effect of not only reducing the power usage of the device, but also increasing the relative quality of the data as well.
1.3.3 Distributed Tracking
The final application space we will consider is that of distributed tracking. While this area bears some resemblance to remote monitoring in that it uses nodes to capture data about local inhabitants and conditions, it fundamentally differs in that the nodes interact with each other to complete a single sensing task, rather than collecting data in isolation. Beyond that, the assumptions remain the same (inaccessible environment, limited maintenance ability, etc.). While we are not examining distributed applications in this work5, it is still worthwhile to quickly reference a few projects in the field. Their sensor hardware designs can still be instructive, even if the software and analysis are not directly applicable.
5
Consider the case of a network of simple sensor nodes which monitors the movement and activities of the occupants of an apartment. Such an application is currently being proposed as a solution to the impending mismatch between the number of people requiring some form of home care and monitoring and the number of medical professionals able to provide it. Networks of sensors - some video cameras watching portions of the house, others simple switches attached to drawers and so on - would feed their data into a central processor for analysis. In combination, they could provide a reasonable picture of what is taking place in the home at any given time. Using learning algorithms and pattern matching, it is possible to determine patterns which represent common daily activities. It is then possible to determine if those activities have been skipped (e.g. taking medicine) or forgotten while in progress (e.g. making tea). Except in the case of accidents or emergencies, a central processor manages the problem locally. Since this application is designed to preserve scarce resources, it is important that the nodes be easy to install (most likely a simple retrofit) and require minimal upkeep (e.g. battery changes).
Such a system is being tested by the MIT Changing Places/House n research consor-tium (Georgia Tech[58] and Intel[50] also have similar initiatives). Within their PlaceLab apartment[54], two different styles of sensors are used to track activities. As above, wired cameras are used for detailed overhead shots. In addition, simple sensors are deployed to measure data at key points in the environment. These sensors are designed to be low-cost, -power and -upkeep data collectors. Each is a circuit board, approximately 1 in square, containing a microcontroller, real-time clock and an input for a binary sensor - either a reed relay switch or a piezoelectric flag[35]. These sensors were attached to controllers, such as light switches or stove knobs, and containers, such as drawers and cabinets. Each time the sensor is tripped, the processor is awakened from a low-power sleep state, writes the current time to memory, and returns to a sleep state. Assuming ten triggers a day, these sensors will last for one year on a CR2430 coin cell, infrequent enough to allow for simple upkeep by a service company. Along with user annotations of example activities, these two forms of sensing are combined to determine the current activity of the home’s occupant. The value of sensing specific parameters of interest (i.e. the opening of a cabinet) directly is demonstrated by the quality of activity recognition achieved (up to 89% compared to a baseline of 30%) based solely on completely innocuous sensors[81].
1.3.4 Notable Thresholds
In the above scenarios, the potential gains from this dissertation are two-fold. In general, any decrease in power consumption increases the system lifespan, with the concomitant benefits detailed. Further, a decrease in battery use has the added benefit of reducing the amount of chemical waste going into the environment. These benefits, as a goal in and of themselves, are of value societally, even if they are not notable for the individual user.
However, there are two key thresholds in the area of power consumption. The first, which this work should help surpass, is that of commercial viability. Consider the medical wearable device discussed above. An early hand-scripted implementation of the techniques to be developed in this dissertation (detailed in chapter 2) increased the life of the wearable gait laboratory described from approximately six hours to just short of six days[7]. This would allow the system to provide real-time feedback to the user as part of everyday life, allowing for corrections which could help avoid a number of different injuries or aid in rehabilitation[79]. In general, systems which are currently confined to laboratories could be used in unconstrained environments, increasing both their potential applications and users.
The second threshold, that of infinite life, is somewhat further off. However, advances in parasitic power for wearable systems[113] combined with the high-level algorithmic power savings from this work and the inevitable low-level technological gains should eventually make it a reality. Eliminating the need for a power cell will simplify devices, reduce the amount of waste generated, and allow for their placement in areas which are either sensitive (e.g. subcutaneous) or inaccessible (e.g. battlefields). Other user benefits include systems which would always be ready for use, which is important for emergency gear, as well as reduced cost, volume and maintenance.
1.4
Contributions
The primary contribution of this dissertation is the construction of energy efficient sensor systems through the use of tiered activation levels cued to evolving sensor stimuli. This
work has resulted in a framework for automatically creating state determination algorithms specifically tailored to increasing energy efficiency through the reduction of sensor usage. Previous systems have most often used as many sensors as feasible at the maximum possible sampling rate without regard to power and have employed at best only binary hand-scripted techniques to increase efficiency. The consideration of energy cost as part of the system design at an integral level - and the ability to systematically trade off energy and system accuracy - is not only novel, but imperative for the progress of these technologies and applications.
The ability for others to continue this and related work is key to the continued development of low-power and power-aware sensor system. The modular prototyping system used to construct these systems will help other researchers working towards common ends to im-plement and test their design more rapidly. Similarly, techniques for quickly instantiating tree-based state determination schemes into hardware shortens the design cycle of these systems and reduces a barrier to exploration of different state determination algorithms. Both can therefore be considered important contributions to future progress in the field.
Also of importance is the design and simulation of a wearable medical sensor system using this framework. A large number of applications in this area (as described in section 1.3.1) are positioned to be of great importance and value to the general public over the next decade.
Chapter 2
Form of Solution
2.1
Overview
The main goal of this work is the reduction of energy usage in embedded sensor systems through the creation and demonstration of new tools and algorithms for their design and construction. We will first consider the general form of our solution and the details thereof. The problem space was limited to the sensing of human activity to reduce the scope of possible solutions as well as to allow the incorporation of constraints arising from a funda-mental knowledge of human physiology. The design of the device hardware, the software and its instantiation are then discussed. The section concludes with a short discussion of some of the limitations imposed by this solution. We note again that this solution centres around sensor usage, is independent of any power reduction techniques based on reducing RF transmissions or processor usage and can be used in conjunction with them.
Processed Data En able Sensor 1 Sensor 2 Sensor n
Microcontroller
Collection and Analysis Data
Activity Level Selection
State Determination
Response Storage
Transceiver
Figure 2-1: Flowchart of proposed hardware solution
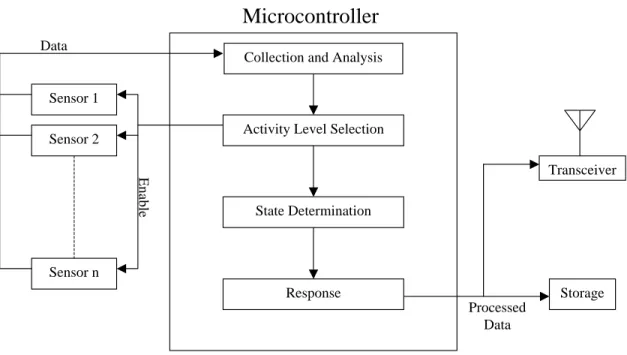
The general design for our system is shown in figure2-1. This system is centred around the concept of what we term “groggy”, or tiered, wake up. This stands in contrast to the more common binary wake up systems, which have only two modes: fully active, collecting all possible data and drawing maximal power, or fully asleep, collecting no data and drawing virtually no power. Instead, we envision a system with a number of different levels of activity and associated power usages. Each level comprises the currently active sensors for state determination and their sampling rate, together with algorithms to describe the level transitions. Execution is straight-forward. From a given initial state at power up, the system will begin to collect and analyse the sampled data and will switch activity levels accordingly. At each time step, the current level will specify how to use as little energy as possible to collect the data to determine the current state and whether a level transition is necessary. Specific responses, such as data capture and storage, can be associated with the individual states and are executed next. Once this is completed, the system powers down until the next time step.
2.2
Design Roadmap
Given a desired application, the design process proceeds as follows. First, hardware for the individual application is configured. In the initial deployment for testing and sample data collection, it is assumed that the system will include any sensors that could possibly be of value for state determination. A training data stream is collected with this hardware, and is annotated by the application designer. These annotated examples are used to construct a classifier that will determine the current system state. The sensor set used by the classifier allows the final, possibly pared down, form of the hardware to be built and the data col-lection to be implemented on it. Each of these tasks are briefly described and commented on in the following subsections. More detailed discussions can be found in the proceeding chapters.
2.2.1 Hardware
As a reasonable starting point for designing a low-power system, the hardware should be as efficient as possible. This generally entails choosing parts with the desired performance characteristics but no greater. Low-power versions of most parts are available at marginally higher cost than conventional versions. Also, a shutdown pin adds extra flexibility in tai-loring power usage in real-time and can be quite valuable. If not available on-chip, this functionality can be achieved with a separate CMOS switch.
There are a few specific characteristics to look for when choosing the two most important classes of components for this project: the sensors and the processor. In the case of sensing, parts with analog outputs are almost always superior in power usage to those with digital outputs. Most sensors are fundamentally analog, meaning that a digital output requires extra internal signal processing. Further, since a 12-bit analog to digital converter (ADC) uses roughly the same energy per sample as five processor operations[118], it is more efficient to collect an analog sample in all but the most trivial cases (i.e. 1 bit sensors). The other key parameter is sensor wake up time. Since much of the power savings of the framework is predicated on power-cycling the various components, reducing the wake up time is key
to minimizing the power wasted during that interval. This parameter can vary widely both between different sensing mechanisms for a given phenomenon (e.g. effectively nil for a phototransistor to 40 ms for a IR rangefinder) and individual parts (e.g. 8 ms for the ADXL202 MEMS accelerometer to 100 ms for the pin compatible MXR2312 thermal accelerometer). The wake up time sets the upper limit of how quickly a sensor can be cycled while still offering power savings over continuous activation. For the processor, we consider two main features. The first is the available sleep states. Our design requires an idle state, where the processor can be awoken by either a timer or a change on an external pin, which draws as little power as possible. The time to exit this state should also be as small as possible. The second consideration is the energy drawn per operation. This is notably different than the operating power of the whole device and the calculation of this value should include not only the energy of execution but also the energy necessary to wake up and put the device to sleep.
A key design technique is the use of multiple sensors to measure a single parameter of interest. The vast majority of sensor systems limit themselves (usually in the interests of simplicity or compactness) to a single sensor for each modality of interest. No matter how efficient such an implementation is for extracting information, it is guaranteed to be power inefficient in states where less (or more) data is necessary to determine the transitions. A system which can tailor its sensing in real-time to the current state of the device can draw far less power on average. While it seems counterintuitive that we can make a system more power-efficient by adding complexity (and/or redundancy), the key is that the system has been given a new, lower energy source of information.
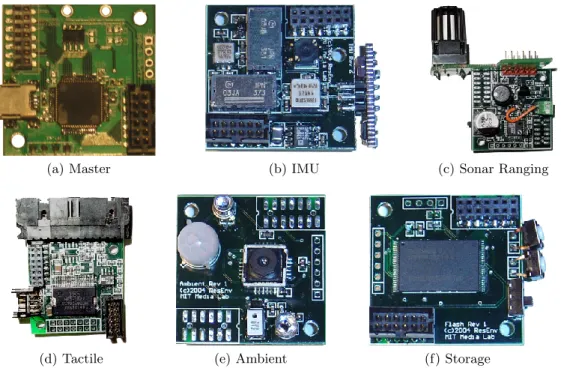
The prototype hardware for this work will be implemented using a modular sensor platform we have designed. This platform is based around a series of circuit boards (or panes), each of which instantiates a specific sensing modality - e.g. inertial sensing, tactile sensing or ambient sensing. These boards can be arbitrarily combined and recombined, allowing for rapid prototyping and testing of proposed sensor combinations. The individual boards have been built along the lines listed above, with low power amplifiers and analog outputs from the sensors. Further, individual boards generally have redundant sensor sets - e.g. the inertial board uses both passive tilt switches and accelerometers to measure motion. For a given application, the designer can use this platform to quickly put together a sensor node with which to collect training data.
2.2.2 Data Collection and Markup
Prior to the classifier construction process, sample data streams must be collected. These streams should be long enough that they contain a suitable number of examples (dependant on the application) of each of the interesting states (those to which the system should respond), as well as enough data from other times to allow the training algorithms to differentiate amongst them.
It is assumed that the application designer will hand annotate the data streams, labelling the areas containing different types of interesting data. We designate each type separately as A,B and so on. The remaining area, where the data is assumed to not be of interest, is labelled X. In the medical wearable example (section 1.3.1), walking could be designated as the A state and shuffling as the B state. The X state would then comprise everything else (stand still, shifting weight, climbing stairs, etc.). In general, it is assumed that the interesting examples will be fairly homogenous, while there may be large variations within the uninteresting data. If the designer wished to differentiate between different forms of walking (fast, slow, pathological), they would each need to be assigned to a separate cate-gory. However, this would only be necessary if they required different real-time responses (output, data collection, etc.).
We have chosen a supervised training approach based on the assumption of fairly constrained applications and clarity of designer intent. Annotations are added to the timestamped data stream by synchronizing with a separate record. This can be done via active schemes, such as a diary or user annotation switch on the hardware, or via passive means, such as a video recording. The former is preferred in most cases as it allows longer sample streams to be collected without regard to location, but passive means are beneficial if the level of user attention to the task is a concern.
2.2.3 Classifier Construction
Given the sample data stream and the user annotated states, the algorithms to determine whether of not the system is in an interesting state can be constructed. We intend to use
classification trees for this portion of the analysis1. There are three key factors to consider in this form of analysis: the features to be extracted from the data stream, the addition of energy use to the classifier construction algorithm, and the pruning technique. Note that for the application designer, this portion of the process is completely automated.
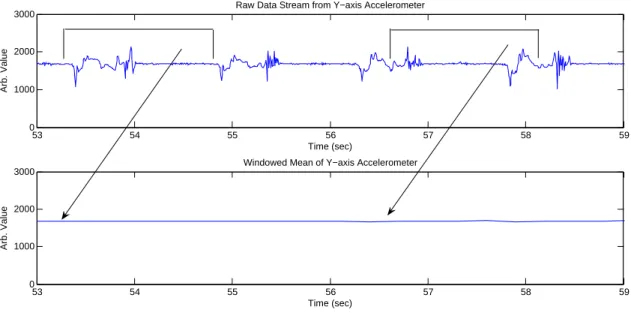
While the relevant features for any particular sensor will tend to vary, there are a few easily calculated functions which tend to work well across a wide spectrum of data sources. These include mean, variance, minima and maxima. One salient feature of each of these functions is that they can be computed efficiently on a point-by-point basis. Each function is calculated over a fixed window, the length of which will vary with application and will be based on the data markup.
A classification tree is built by recursively dividing the labelled examples into increasingly smaller sets until only interesting or uninteresting examples remain. The splits themselves are simple thresholds on the value of one of the above features, with the chosen split being the one which maximizes a specific criteria (e.g. entropy of the data sets). In this case, we are not solely concerned with finding the rules which separate the examples most accurately, but also in doing so for the least energy. Therefore, we will weight the chosen splitting criterion by the energy necessary to obtain the feature used. In most cases, this will be the energy necessary to collect the relevant sensor data as the energy used to calculate the features is negligible. This has the practical effect that once any sensor feature has been used in the tree, all other features based on that sensor’s data are, to a first order, free.
The final step to consider is the pruning of the tree both to reduce its complexity and to mitigate the risk of overtraining. This is a fairly straight-forward procedure. Any pruning action will result in lower energy usage and increased response speed in state determination, but also risks lowering the accuracy. This allows for accuracy, power and response speed to be traded off by the designer through simple adjustments in the pruning parameters. At least some pruning is likely to be necessary in most cases, since the lower branches on the tree tend to expend considerable energy to distinguish between a very small percentage of the examples.
1
ayb
51
Classification:
Pima Classifier - W=0 (High Power)
Plasma Glucose<123.5 diabetic not not Plasma Glucose<154.5 Body Mass Index <29.5 diabetic T T T F F FFigure 2-2: Sample decision tree
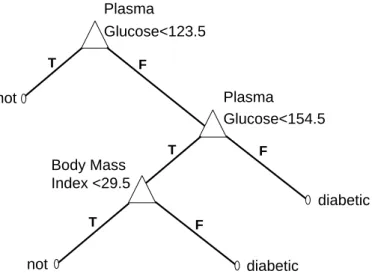
To make this concept a little more concrete, figure 2-2 shows a sample decision tree for evaluating whether a patient is diabetic. Values of plasma glucose below a certain threshold suggest that the patient is not diabetic, while those above another threshold suggest that they are. For patients with middling values, the body mass index is used to differentiate.
2.2.4 Solution Embedding
The real-time operation of the hardware for this design is fairly straight-forward and is given by the current activity level2. A reloading timer is set for the current update rate and the processor is put to sleep. The processor is awakened by the timer overflowing and turns on the desired sensors. As each sensor completes its wake up cycle, it is sampled and then turned off. Once all the sensors have been sampled, the data analysis is done and the state is determined. In the interesting states, the system responds as chosen by the designer, e.g. by making a notation of the occurrence, collecting data, or cuing the user. Actions can also be taken in the uninteresting states, though these responses would have to be identical for all possibilities. Once these actions are complete, the processor returns to sleep mode.
There are, as always, a few special cases. At the low data rate extreme, if the sole goal of an activity level is to wait for a transition from a binary (or thresholded) sensor, the processor
2
Operation Example Use Output Size Energy Use Wireless transmission Raw data transfer N/A 154 µJ Fast Fourier Transform Find spectrum 64 bytes 1.15 µJ Windowed variance Feature extraction 1 byte 291 nJ N-tap feedback network Generalized filtering 64 bytes 190 nJ per tap
Table 2.1: Comparison of energy cost of common data operations on a 64 byte block
can simply be instructed to sleep until it sees a change on the appropriate pin. Further, this change could be the output of a passive sensor for which the power cost is nearly nil. At the high data rate extreme, it may not be possible to put the individual sensors to sleep between samples, as their wake up time could be greater than the sampling period. It is also possible that the processor itself will not have time to go into a sleep state because of the time necessary to sample and process the data. At this point, hardware redesign should be considered, either to chose more appropriate sensors, shorten the sensor wake up time or the increase the processor speed.
It is straight-forward to algorithmically transform the decision tree found above into mi-crocode. From there, given the structure that we have imposed on sampling rate and feature size, we can automatically generate the transitions between the various levels and the pro-cess of activating and deactivating the sensors as nepro-cessary. This will significantly simplify the programming and therefore greatly reduce the implementation time.
Once the data has been collected, one response to consider is in-situ analysis of data. Most sensor systems either transmit or cache all data without regard to expository value. Simple data processing and feature extraction could reduce this volume considerably for a small power cost. In fact, it can possibly result in a net power savings if data is compressed[5] or discarded altogether. Table 2.1 gives the energy used by the Texas In-struments MSP430F1610 to perform a number of different operations on a 64 byte window, compared to the cost of transmitting that data outright. Due to the variety of applications and desired responses, any use of such algorithms beyond the state determination needed for this framework is best left to the discretion of the individual application designers.
2.3
Structural Limitations
We note a few limitations on the applicability of this work which are imposed by the specific form of the solution presented above. As opposed to the limitations of scope presented in section1.2.3, these structural limitations can be overcome by altering the algorithm choices. This is discussed further in section 8.1
The key structural limitation of this work is the requirement for a supervised solution for pattern recognition (in the form of the annotated data stream). This approach was chosen based on the assumption of fairly constrained applications and clarity of designer intent. The main benefit is the ability to ascribe specific meaning to the chosen states (e.g. walking), to combine states which might otherwise be separated (e.g. fast and slow gaits) and to ignore altogether portions of the data stream which could potentially be considered interesting (e.g. skipping). On the other hand, systems where the states of interest are either large in number or ill-defined will likely result in trees which are either too deep or classify poorly, respectively.
The tree-based solution requires a binary decision to be made on a function of a block of sensor data at each non-leaf node. Drawing from the limitation of scope to human activity given above, the choice of features was restricted to a few easily calculated functions which tend to work well across a wide spectrum of data sources. While this reduces the complexity of the tree construction, it could possibly increase tree depth (in the case of a combination of simple functions being substituted for a single complex one) and reduce classification accuracy. It is also admittedly slightly incongruous with the principle of guided design applied to the input data stream. The designer is expected to select and label the states of interest, but at the same time not have any mathematical intuition about their structure.
Also, classification trees are time-invariant, i.e. state transition probabilities and parameters are not effected by the time elapsed since the last transition (this is not the case for other techniques, such as hidden Markov models[99]). In most cases, there will be no pattern to the state changes, so it is preferable not to have one artificially imposed, though in certain
cases (such as people entering and exiting a sensed environment within a fixed interval) it can be of value.
Finally, it should be noted that any wake-up based system has the potential to miss anoma-lous events (i.e. those with no precursor) - either entirely or during the state determination procedure. While this may be a problem in general, it should not be in this case given that we will concentrate on human-centric sensing (see section 1.2.3). Since most activities in this domain take place on the order of seconds (at minimum) and state determination (in our examples) requires roughly a second, the chance of missing an event is minimal3.
3
Chapter 3
Related Works
We now describe a number of important publications which either implement similar con-cepts in other fields or which provide background techniques for our work. First, academic publications are discussed - both those directly on point (theoretically and practically) and those from other domains which are peripherally relevant in one fashion or another. Second, we comment on several consumer devices which implement first-order versions of some of the algorithms we have constructed. Works related to various implementation issues will be discussed in the relevant chapters.
3.1
Academic Work
3.1.1 Design Principles
Estrin’s[33] survey paper on pervasive networks highlights many of the techniques, both hardware and software, explored in our work. It defines variability, scale and autonomy as the key design axes for wireless networks and nodes. The need to maintain vigilance for interesting data while consuming almost no power is highlighted, and the ability to rapidly alter sensing based on incoming data is cited as the best way to cope with variability. The scale of a specific application determines the size, sensors and sampling rate needed and
are left to the designer in our work. Finally, the need for autonomy to facilitate long-term deployment leads to the use of multiple sensors per modality and the desire for a large number of activity levels. Note that Estrin presented only theoretical concepts, with no implementation details given or cited.
Srivastava has written a number of papers [101, 112] which examine the power usage of embedded nodes under a variety of conditions (data collection, wireless transmission, sleep, etc.) and comments on the selection of modes for processors and RF transceivers that are most efficient for their particular task. For short-range transceivers, the power drawn by the electronics is far greater than the radiated power. Therefore, data should be transmitted as quickly as possible, with the transceiver shut down between bursts. For the processors, not only should the capabilities mirror the task, but the possibility of never shutting down the processor should also be considered. Using dynamic voltage scaling[92], processor speed and energy can be traded off, allowing the necessary calculations to be performed in exactly the time allotted but for less energy. This work expressly sidesteps the issue of sensor power because the wide variation in sensing modalities, signal conditioning and analog-to-digital conversion make a compact general solution (like those above) unlikely. However, these factors can be taken into account in the sensor hardware design to construct circuits to measure an individual parameter as efficiently as possible. Some recent directions in adaptive sampling are described in [100] and a number of them are detailed below.
3.1.2 Implementation Techniques
Table3.1lists the properties of a number of related projects with the same overarching goal as our own - the reduction of power usage in embedded nodes by controlling sensor sampling. Most concentrate on the measurement and collection of data from a single phenomenon. Jain[56], Liu[67] and Rahimi[102] each use a different model of the sensor data to adjust the sampling rate of a sensor on a single node. Jain uses the innovation of a Kalman filter[42] as a measure of the entropy rate of the data stream and adjusts the sampling rate accordingly. Liu models the system as a random walk and varies the sampling rate when subsequent measurements fall outside of the expected range. Finally, Rahimi measures a phenomenon