The MIT Faculty has made this article openly available.
Please share
how this access benefits you. Your story matters.
Citation
Fu, Qiang et al. "The Brewer#Dobson Circulation During the Last
Glacial Maximum." Geophysical Research Letters 47, 5 (February
2020): e2019GL086271 © 2020 The Authors
As Published
http://dx.doi.org/10.1029/2019gl086271
Publisher
American Geophysical Union (AGU)
Version
Final published version
Citable link
https://hdl.handle.net/1721.1/125265
Terms of Use
Creative Commons Attribution 4.0 International license
The Brewer
‐Dobson Circulation During the Last
Glacial Maximum
Qiang Fu1 , Rachel H. White2 , Mingcheng Wang1 , Becky Alexander1 , Susan Solomon3 , Andrew Gettelman4 , David S. Battisti1 , and Pu Lin5
1Department of Atmospheric Sciences, University of Washington, Seattle, WA, USA,2Barcelona Supercomputing Center,
Barcelona, Spain,3Department of Earth, Atmospheric, and Planetary Sciences, Massachusetts Institute of Technology,
Boston, MA, USA,4National Center for Atmospheric Research, Boulder, CO, USA,5Atmospheric and Oceanic Sciences Program, Princeton University, Princeton, NJ, USA
Abstract
The Brewer‐Dobson circulation during the Last Glacial Maximum (LGM) is investigated in simulations using the Whole Atmosphere Community Climate Model version 6. We examine vertical massfluxes, age of stratospheric air, and the transformed Eulerian mean stream function andfind that the modeled annual‐mean Brewer‐Dobson circulation during the LGM is almost everywhere slower than that in the modern climate (with or without anthropogenic ozonedepleting substances). Compared to the modern climate, the annual‐mean tropical upwelling in the LGM is 11.3–16.9%, 11.2–15.8%, and 4.4–10.2% weaker, respectively, at 100, 70, and 30 hPa. Simulated decreases in annual‐mean mass fluxes at 70 and 100 hPa are caused by a weaker parameterized orographic gravity wave drag and resolved wave drag, respectively.
Plain Language Summary
The Brewer‐Dobson Circulation (BDC) is the large‐scale stratospheric circulation that transports stratospheric ozone from the tropics to poles and transports ozone from the stratosphere to troposphere in middle‐ and high‐latitudes. During the Last Glacial Maximum (LGM), the BDC could have been very different from the modern climate, due to different radiative constituent concentrations, the presence of large ice sheets in the Northern Hemisphere, and lower sea surface temperatures but an increased latitudinal sea surface temperature gradients. Here we investigate the BDC during the LGM using the Whole Atmosphere Community Climate Model version 6 with fully interactive chemistry for thefirst time. We find that the annual‐mean BDC during the LGM is everywhere weaker than that in the modern climate. A decreasing BDC in the LGM will have implications for the spatial distribution of ozone in the stratosphere, as well as stratosphere‐troposphere exchange and surface ultraviolet radiation. The latter two changes can be expected to affect tropospheric oxidant abundances, with potential implications for the lifetime of trace gases such as methane. Because of impacts on the climate sensitivity and methane, dynamically consistent O3fields in the LGM from the present study provide an improved framework for an accurate simulation of the LGM climate.1. Introduction
The Brewer‐Dobson circulation (BDC) is the global overturning mass circulation in which tropospheric air enters the stratosphere across the tropical tropopause, moves upward and poleward, and descends into the extratropical troposphere (e.g., Butchart, 2014; Haynes et al., 1991; Holton et al., 1995). The BDC varies with season, with a stronger cell occurring in the winter hemisphere where stratospheric winds are westerly (e.g., Plumb, 2002; Rosenlof, 1995). Because of considerably more longitudinal asymmetry in topography and land and ocean in the Northern Hemisphere (NH) than in the Southern Hemisphere (SH), planetary wave drag during winter is much stronger in the NH, leading to a stronger BDC.
In the last decade, there has been a surge of interest in the BDC, mainly resulting from the development and continuing improvement of general circulation models (GCMs) and chemistry‐climate models (CCMs) with detailed representations of the stratosphere (e.g.,Butchart, 2014; Eyring et al., 2005; Gerber et al., 2012; Pawson et al., 2000; SPARC CCMVal, 2010). In agreement with pioneering work by Rind et al. (1990), the new stratosphere‐resolving GCMs and CCMs consistently predict a strengthening of the BDC in response to greenhouse gas‐induced climate change (e.g., Bunzel & Schmidt, 2013; Butchart et al., 2006; Fu et al., 2015; Fu et al., 2019; Garcia & Randel, 2008; Li et al., 2008; Lin & Fu, 2013; McLandress & Shepherd, ©2020. The Authors.
This is an open access article under the terms of the Creative Commons Attribution License, which permits use, distribution and reproduction in any medium, provided the original work is properly cited.
RESEARCH LETTER
10.1029/2019GL086271Key Points:
• A state‐of‐the‐art atmosphere model shows a slower Brewer‐Dobson circulation during the Last Glacial Maximum than the modern climate • Compared to modern climate, the
annual‐mean tropical upwelling in the Last Glacial Maximum is 14%, 14%, and 7% weaker at 100, 70, and 30 hPa, respectively
• Decrease in mass fluxes at 70 and 100 hPa is caused by weaker parameterized orographic gravity wave and resolved wave drags, respectively Supporting Information: • Supporting Information S1 Correspondence to: Q. Fu, [email protected] Citation:
Fu, Q., White, R. H., Wang, M., Alexander, B., Solomon, S., Gettelman, A., et al. (2020). The Brewer‐Dobson circulation during the Last Glacial Maximum. Geophysical Research
Letters, 47, e2019GL086271. https://doi. org/10.1029/2019GL086271
Received 19 NOV 2019 Accepted 19 FEB 2020
2009; Oberlander et al., 2013; Okamoto et al., 2011). Modeling studies alsofind that the BDC becomes stron-ger (weaker) in response to the ozone depletion (recovery) (e.g., Li et al., 2008; Lin & Fu, 2013; McLandress et al., 2010; Oman et al., 2009; Polvani et al., 2011; Polvani et al., 2018; Polvani et al., 2019; Shindell & Schmidt, 2004). Compared to the rich literature on the BDC for the current and future climate, there are very few studies on the BDC during the Last Glacial Maximum (LGM) (Rind et al., 2001; Rind et al., 2009). The stratosphere during the LGM is expected to be considerably different from today because of reduced CO2, CH4, and N2O, the presence of large ice sheets in the NH, and increased latitudinal sea surface tem-perature (SST) gradients. Rind et al. (2001) used the GISS Climate Middle Atmosphere Model (8° × 10° and 23 vertical layers) to investigate how the stratosphere may have changed during the LGM. They sug-gested a warmer LGM stratosphere, due primarily to reduced CO2, and an increase in the BDC in the lower stratosphere but a decrease above. Using the GISS model with a higher resolution (4° × 5° and 53 layers), Rind et al. (2009) again found an intensified LGM BDC in the lower stratosphere and increased stratosphere‐troposphere exchange (STE) at higher latitudes, but a decreased circulation for most of the mid-dle atmosphere. Noting intensified BDC and STE associated with increased CO2 (e.g., Butchart, 2014; Hegglin & Shepherd, 2009; Shepherd, 2008), Rind et al. (2009) argued that the LGM SSTs enhanced latitu-dinal temperature gradients, thus forcing a similar STE response. Here we investigate the BDC during the LGM using the Whole Atmosphere Community Climate Model version 6 (WACCM6). Wefind that the annual‐mean BDC during the LGM is almost everywhere weaker than that in the modern climate. The BDC controls the spatial distribution of stratospheric O3as well as stratosphere‐troposphere O3 trans-port, which have important implications for LGM tropospheric chemistry through the impact on ultraviolet radiation as well as a direct contribution to tropospheric O3(e.g., Geng et al., 2017; Murray et al., 2014). Quantifying the BDC in the LGM is important for interpretation of ice‐core proxies of atmospheric chemistry (Geng et al., 2017; Yeung et al., 2019) and biological productivity (Luz et al., 1999). A dynamically consistent O3field in the LGM can also be expected to be important to the simulation of the LGM climate (e.g.,Chiodo & Polvani, 2017; Nowack et al., 2015; Szopa et al., 2019). The present study should also broaden our perspec-tive regarding the stratospheric response to anthropogenically induced climate changes in the future.
2. Model Experiments
We used the WACCM6, which is the high‐top atmospheric component of the Community Earth System Model version 2, described by Gettelman et al. (2019). The model was run with specified ocean and ice com-ponents with a horizontal resolution of 0.9° longitude × 1.25° latitude. WACCM6 has 70 levels up to 140 km and includes the physics and chemistry of the troposphere, stratosphere, and mesosphere. The WACCM model suite has a realistic evolution of the SH springtime ozone hole over the latter half of the twentieth cen-tury (Solomon et al., 2015) and a realistic frequency of stratospheric sudden warming (Gettelman et al., 2019). Further, as a result of improvements in the model climatology and the gravity wave parameterization, WACCM6 has an internally generated rather than prescribed QBO in the lower stratosphere (Garcia & Richter, 2019). We couple the WACCM6 model to the CLM4.0 land model and make use of the CLM4.0 LGM lower boundary conditions from the CESM Paleo Working Group (e.g., Brady et al., 2013).
Four simulations were performed: (1) LGM simulation with prescribed SSTs derived from models (LGMPMIP3), (2) LGM simulation with SSTs based on proxy data (LGMPROXY), (3) modern climate simula-tion (MC), and (4) modern climate simulasimula-tion without anthropogenic ozone‐depleting substances (ODS) (MCno_ODS). Each simulation was run for 60 years, and the last 50 years were analyzed. The concentrations of CO2, CH4, and N2O for the LGM (MC) are 185 (369) ppm, 349 (1748) ppb, and 200 (316) ppb, respectively. The surface concentrations of long‐lived atmospheric species including the ODS were taken from the year 2000 for MC, and all anthropogenic emissions are turned off in LGM. The orbital parameters are conditions 21,000 years ago for LGM simulations and 2000 CE for the MC simulations. For the MC simulations with and without ODS, the SSTs/sea ice are the climatological averages of years 1980–2000 based on observations (Rayner et al., 2003) with a seasonal evolution. For LGMPMIP3, we used the PMIP3 multimodel mean SST/sea ice for all models that had both LGM and historical runs (CCSM4, CNRM‐CM5, GISS‐E2‐R, IPSL‐CM5A‐LR, MIROC‐ESM, MPI‐ESM‐P, and MRI‐CGCM3) (Braconnot et al., 2012). The SSTs/sea ice distributions for the LGM were obtained from the model differences between LGM and current climate simulations plus current observed SSTs/sea ice. For LGMPROXY, the SSTs were from the MARGO proxy
data (Kucera et al., 2005), while sea ice was derived as for LGMPMIP3. The ice sheet topography from Abe‐Ouchi et al. (2015) was used in the LGM simulations. The results from LGMPMIP3and LGMPROXY inform the sensitivity to the SSTs used for the LGM.
Before investigating the BDC during the LGM, wefirst examine WACCM6's performance by comparing the WACCM6 MC simulation with the ERA‐I reanalysis and quantify the ODS effects on the BDC (section 3).
3. MC Simulation Versus ERA‐I Reanalysis and ODS Effect
Supporting information Table S1 shows the annual‐mean air mass fluxes at different altitudes and by differ-ent BDC branches from the MC simulation compared with ERA‐I reanalysis. The BDC was decomposed into
Figure 1. (Left) massflux profiles from MC (solid lines) and LGMPMIP3(dashed lines). (Middle) relative differences in massfluxes at 100, 70, and 30 hPa between
LGMPMIP3and MC. (Right) relative differences in massfluxes transported by transition (100–70 hPa) and stratospheric shallow (70–30 hPa) and deep (above
30 hPa) branches of the Brewer–Dobson circulation. Black, red, and blue colors indicate results associated with upwelling in the tropics and downwelling in the Northern Hemisphere and Southern Hemisphere, respectively. The annual‐mean and seasonal results are shown in row (a) and rows (b–e), respectively. The relative differences that are statistically significant at 95% confidence level are denoted with the slant lines in the bar for the middle and left panels.
10.1029/2019GL086271
the transition (100–70 hPa) and stratospheric shallow (70–30hPa) and deep (30 hPa–) branches following Lin and Fu (2013). The WACCM6 MC compares well with ERA‐I and shows better agreement with the reanalysis than the average of 12 CCMs (see Table 1 of Lin & Fu, 2013). The MC simulation also shows excellent agreement with ERA‐I for the spatial distribution of annual‐mean residual vertical velocities at 70 hPa (Figure S1) and annual‐ and seasonal‐mean transformed Eulerian mean (TEM) stream functions (Figure S2). The annual‐mean age of air for the MC (Figure S3) also agrees well with previous estimates (e.g., Garcia et al., 2011; Li et al., 2012).
Compared with the MC (Table S2), the MCno_ODSannual‐mean upwelling mass fluxes decrease by 1.8% and 3.6%, respectively, at 70 and 30 hPa (Table S3), which are both statistically significant. The mass flux trans-ported by the SH deep branch in DJF (December, January, and February) is only 0.44 × 10⁹kg/s in MC (Table S2) but decreases by 39.8% in MCno_ODS(Table S3), which is largely responsible for simulated signif-icant changes in the annual‐mean upwelling mass fluxes at 70 and 30 hPa. This result agrees with Lin and Fu (2013) that the response of the BDC to the ozone depletion is primarily in the southern deep branch during the austral summer. Further, significant changes are also seen in SH transition and stratospheric shallow branches in various seasons (Table S3).
4. BDC During the LGM Versus That in the Modern Climate
The far left panel in Figure 1 shows annual‐ and seasonal‐mean mass flux profiles from the MC and LGMPMIP3for the upwelling in the tropics and its partitioning into downwelling in the NH and SH. While the massfluxes show large dependences on season, hemisphere, and altitude, the fluxes from LGMPMIP3 are almost always smaller than those from MC. Shown in the middle panel are the corresponding relative differences in massfluxes at 100, 70, and 30 hPa between LGMPMIP3and MC: The annual‐mean tropical upwelling from LGMPMIP3is 16.9%, 15.8%, and 7.8% smaller than those in MC, respectively. Most of the rela-tive differences shown in the middle panels of Figure 1 for the four seasons are also negarela-tive and statistically significant. Except for the SH in DJF, stratospheric ozone depletion has a small impact (compare Figure 1 with Figure S4, in which MC has been replaced with MCno_ODS). The annual mean tropical upwellingfluxes at 100, 70, and 30 hPa from LGMPMIP3 are 16.5%, 14.2%, and 4.4% smaller than those from MCno_ODS, respectively.
Figure 2. Change in age of air in years (color) for (a) LGMPMIP3versus MC and (b) LGMPMIP3versus MCno_ODS. The contours are the age of air in years from MC in (a) and MCno_ODSin (b).
The far right panel of Figure 1 shows the relative differences in massfluxes transported by the BDC transition and stratospheric shallow and deep branches for LGMPMIP3 versus MC. The stratospheric ozone depletion effects (compare Figures 1 and S4) are again associated with the strato-spheric deep cell in the SH in DJF. The annual‐mean mass fluxes transported by the BDC transition and stratospheric shallow and deep branches from LGMPMIP3 are 18.4% (19.3%), 23.3% (23.2%), and 7.8% (4.4%) smaller than those from MC (MCno_ODS), respectively, and these changes are all statistically significant.
The age of stratospheric air is defined as the time to transport an air parcel from the tropical tropopause to a given location in the stratosphere, which is an indicator of the strength of the BDC (Hall & Plumb, 1994; Waugh & Hall, 2002). The age of stratospheric air is derived in WACCM6 by using a synthetic
Figure 3. (a) Annual‐mean and (b–e) seasonal‐mean TEM stream functions from MC (contour) and corresponding differences between LGMPMIP3and MC (color).
Positive values for clockwise turning, and negative values for counterclockwise turning. The units are in kg m−1s−1.
10.1029/2019GL086271
tracer without sinks and imposing a uniform mixing ratio at the surface which increases linearly with time. A reference point was chosen at 0.47°N and 143 hPa (Garcia et al., 2011). The change in age of air is shown in Figure 2 for (a) LGMPMIP3 versus MC and (b) LGMPMIP3 versus MCno_ODS, indicating increased age of air everywhere in the stratosphere, as would be expected based on the decrease in the annual‐mean BDC during the LGM (top panels in Figures 1 and S4). The larger increases in (a) compared to (b) are caused by stratospheric ozone depletion. The results shown in Figure 2 are some-what different from those in Rind et al. (2009) (see their Figure 3). Although Rind et al. (2001, 2009) also showed a decrease in the middle atmosphere residual circulation (e.g., over ~50 hPa), they found an increase in the lower stratosphere circulation over the extratropics.
The Lagrangian‐mean meridional mass transport by the BDC can be approximated by the TEM stream function (Andrews et al., 1987). Figure 3 shows the annual‐ and seasonal‐mean TEM stream functions from the MC simulation (contours) and the differences between LGMPMIP3 and MC (colors). Positive (negative) values indicate clockwise (counterclockwise) turning. For the region with solid (dashed) con-tours, a negative (positive) change indicates a decrease of the circulation intensity. We see a decelera-tion of the annual‐mean BDC in both the NH and SH cells (Figure 3a). The seasonal‐mean values of the BDC strength also show an overall deceleration (Figures 3b and 3e) but with a few acceleration regions including parts of the NH (SH) cell in DJF (JJA) and parts of both NH and SH cells in MAM and SON. Similar results are obtained by comparing the LGMPMIP3 with the MCno_ODS simula-tions (Figure S5). It is interesting to compare the TEM stream function changes in DJF and JJA (Figures 3b and 3d) to those obtained by Rind et al. (2001) (see the left panel in their Plate 6). In DJF, the BDC from Rind et al. (2001) is largely weakening in the middle stratosphere, consistent with Figure 3b, but it is strengthening in the lower stratosphere below ~50 hPa, especially in the NH, which is different from Figure 3b. In JJA, the changes in the TEM stream function from Rind et al. (2001) show a largely strengthening BDC in the SH, and also a strengthening in the NH between 200 and 100 hPa, different from Figure 3d.
Figure 4. Annual‐mean mass fluxes at (a) 70 hPa and (b) 100 hPa for upwelling in the tropics (left) and downwelling in the Northern (middle) and Southern (right) Hemispheres from MC, MCno_ODS, LGMPMIP3, and LGMPROXY. Massfluxes calculated from the residual vertical velocity are shown by black bars. Mass fluxes
calculated by downward control principle are split into contributions from resolved waves (grey), parametrized orographic gravity wave drag (dark grey), and parameterized nonorographic gravity wave drag (light grey).
The global‐mean surface air temperatures are 15.0, 10.5, and 10.0 °C from the WACCM6 MC, LGMPROXY, and LGMPMIP3simulations, respectively, corresponding to global‐mean SSTs of 18.4, 16.6, and 16.2 °C. The global‐mean surface air temperatures and SSTs from LGMPROXYare thus ~0.4–0.5 °C higher than LGMPMIP3. The higher global‐mean SSTs from LGMPROXYare due to higher tropical SSTs compared to LGMPMIP3; middle‐latitude SSTs are lower in LGMPROXY(Figure S6). This leads to a larger latitudinal SST gradient in LGMPROXY. The BDC from LGMPROXYis generally stronger than that from LGMPMIP3, especially for the transition and stratospheric shallow branches (Table S4). However, the results from LGMPROXY rela-tive to MC and MCno_ODS(Figures S7–S11) are very similar to results from LGMPMIP3relative to MC and MCno_ODS (Figures 1–3, S4, and S5). The annual‐mean tropical upwelling at 100, 70, and 30 hPa from LGMPROXYis 11.7 (11.3)%, 12.8 (11.2)%, and 10.2 (6.9) % smaller than those from MC (MCno_ODS), respec-tively (Figures SM7 and SM10).
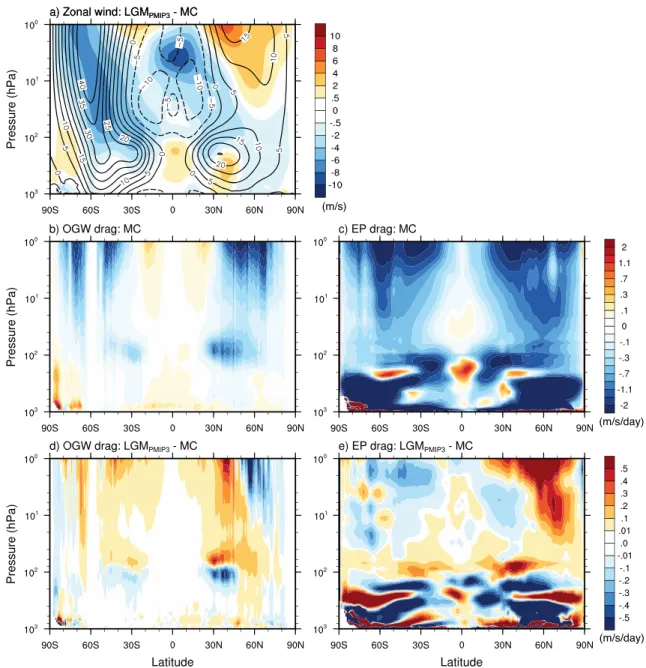
Figure 5. (a) Annual‐mean zonal wind from MC (contour) and the difference between LGMPMIP3and MC (color). Annual‐mean (b) parameterized orographic
gravity wave drag and (c) resolved wave drag from MC and corresponding differences (d) (e) between LGMPMIP3and MC. Positive values in (d) and (e) mean
weaker wave drag.
10.1029/2019GL086271
Figure 4 shows the annual‐mean air mass fluxes derived from the downward control principle versus those from the TEM residual vertical velocity at 70 and 100 hPa for tropical upwelling and NH and SH downwelling, for the four WACCM6 simulations. The massfluxes from the two methods agree well. The decrease in the modeled massfluxes at 70 hPa during the LGM is largely caused by weaker para-meterized orographic gravity wave drag (Figure 4a). This is because of a downward shift of the NH sub-tropical jet and slow down of the SH jets during the LGM (Figure 5a), both of which cause the parameterized orographic gravity waves to break lower in the atmosphere (Figures 5b and 5d) (Butchart, 2014; Butchart et al., 2010; Li et al., 2008; Okamoto et al., 2011). This results in a less drag above 70 hPa, which leads to weaker tropical upwelling at that level. Note that following the downward control principle the residual vertical velocity at a given altitude is determined by the vertically inte-grated wave forcing above that altitude and changes in the wave drag in the vicinity of the turnaround latitudes are most relevant. Our result here is broadly consistent with Butchart et al. (2010), who found that the percentage contribution of the parameterized waves to driving trends in the 70 hPa upwelling caused by an increase in CO2is much larger than their percentage contribution to driving the upwelling itself. Similar to the parameterized gravity waves, a downward shift of wave dissipation is also found in the resolved waves (Figures 5c and 5e) due to the changes in the subtropical jets (Figure 5a) (Cohen et al., 2014; Garcia & Randel, 2008; Shepherd & McLandress, 2011). Less wave drag from the resolved waves is largely responsible for the massflux decreases at 100 hPa (Figures 4b, 5c, and 5e). The results in this paper are not sensitive to the subgrid‐scale topography treated in the LGM simulations (e.g., the present day versus LGM subgrid‐scale topography) (not shown).
Rind et al. (2009) found a larger global poleward eddy heat flux in their LGM simulations than their present‐day control run, which was responsible for the strengthening of their LGM BDC in the lower stratosphere. Based on our simulations (Figure 4), although the contribution of resolved waves to the massfluxes at 70 hPa during the LGM also becomes slightly larger in the NH than the modern climate, it is not enough to compensate for the decrease caused by the orographic gravity wave drag changes. It is also interesting to note that in Rind et al. (2001), the annual‐mean surface air temperature during LGM based on the proxy data is 4.3 °C colder than in their control run, which is very similar to our 4.5 °C from LGMPROXY versus MC. Rind et al. (2001, 2009) showed that their results are not sensitive to either SSTs used or wave drag treatments associated with the ice sheet. The differences between our results and Rind et al. (2001, 2009) highlight the need for multimodel simulations and comparison of the LGM stratospheric circulations.
5. Summary and Conclusions
This study examines the BDC in the LGM with simulations for both LGM and modern climate using WACCM6. The BDC simulation for the modern climate agrees well with ERA‐I in terms of annual‐mean air mass fluxes at different levels and by different BDC branches as well as the annual‐ and seasonal‐mean TEM stream functions.
We show smaller annual‐mean air mass fluxes during the LGM compared to the modern climate at all levels and branches. The annual‐mean tropical upwelling in the LGM is 11.3–16.9%, 11.2–15.8%, and 4.4–10.2% smaller, respectively, at 100, 70, and 30 hPa than in the modern climate (with or without anthropogenic ozone depleting substances). The age of stratospheric air in the LGM increases everywhere as compared with that from the modern climate. The annual‐mean TEM stream functions also indicate a slowdown of the BDC during the LGM. The annual‐mean BDC during the LGM is therefore always slower than that in the modern climate regardless of altitude, latitude, and BDC vertical and hemispheric branches. This result is insensitive to the SSTs used in the LGM simulation and irrespective of the presence of anthropogenic ODS in the mod-ern climate. The seasonal‐mean BDC during the LGM also shows an overall slowdown of the circulation apart from a few regions.
A decreasing BDC in the LGM will have important implications for the spatial distribution of ozone in the stratosphere, as well as STE and surface ultraviolet radiation. The latter two changes can be expected to affect tropospheric oxidant abundances, with potential implications for the lifetime of trace gases such as methane. These impacts will be explored in future studies.
References
Abe‐Ouchi, A., Saito, F., Kageyama, M., Braconnot, P., Harrison, S. P., Lambeck, K., et al. (2015). Ice‐sheet configuration in the CMIP5/PMIP3 Last Glacial Maximum experiments. Geoscientific Model Development, 8(11), 3621–3637. https://doi.org/10.5194/gmd‐8‐
3621‐2015
Andrews, D., Holton, J., & Leovy, C. (1987). Middle atmosphere dynamics. San Diego: Academic Press.
Braconnot, P., Harrison, S. P., Kageyama, M., Bartlein, P. J., Masson‐Delmotte, V., Abe‐Ouchi, A., et al. (2012). Evaluation of climate models using palaeoclimatic data. Nature Climate Change, 2, 417–424. https://doi.org/10.1038/nclimate1456
Brady, E. C., Otto‐Bliesner, B. L., Kay, J. E., & Rosenbloom, N. (2013). Sensitivity to glacial forcing in the CCSM4. Journal of Climate, 26, 1901–1925. https://doi.org/10.1175/JCLI‐D‐11‐00416.1
Bunzel, F., & Schmidt, H. (2013). The Brewer‐Dobson circulation in a changing climate: Impact of the model configuration. Journal of the
Atmospheric Sciences, 70, 1437–1455. https://doi.org/10.1175/JAS‐D‐12‐0215.1
Butchart, N. (2014). The Brewer‐Dobson circulation. Reviews of Geophysics, 52, 157–184. https://doi.org/10.1002/2013RG000448 Butchart, N., Cionni, I., Eyring, V., Shepherd, T. G., Waugh, D. W., Akiyoshi, H., et al. (2010). Chemistry‐climate model simulations of
twenty‐first century stratospheric climate and circulation changes. Journal of Climate, 23(20), 5349–5374. https://doi.org/10.1175/ 2010JCLI3404.1
Butchart, N., Scaife, A. A., Bourqui, M., de Grandpré, J., Hare, S. H. E., Kettleborough, J., et al. (2006). Simulations of anthropogenic change in the strength of the Brewer‐Dobson circulation. Climate Dynamics, 27(7‐8), 727–741. https://doi.org/10.1007/s00382‐006‐0162‐4 Chiodo, G., & Polvani, L. M. (2017). Reduced Southern Hemispheric circulation response to quadrupled CO2due to stratospheric ozone
feedback. Geophysical Research Letters, 44, 465–474. https://doi.org/10.1002/2016GL071011
Cohen, N. Y., Gerber, E. P., & Bühler, O. (2014). What Drives the Brewer–Dobson Circulation? Journal of the Atmospheric Sciences, 71, 3837–3855. https://doi.org/10.1175/JAS‐D‐14‐0021.1
Eyring, V., Harris, N. R. P., Rex, M., Shepherd, T. G., Fahey, D. W., Amanatidis, G. T., et al. (2005). A strategy for process‐oriented validation of coupled chemistry‐climate models. Bulletin of the American Meteorological Society, 86(8), 1117–1134. https://doi.org/10.1175/BAMS‐ 86‐8‐1117
Fu, Q., Lin, P., Solomon, S., & Hartmann, D. L. (2015). Observational evidence of strengthening of the Brewer‐Dobson circulation since 1980. Journal of Geophysical Research: Atmospheres, 120, 10,214–10,228. https://doi.org/10.1002/2015JD023657
Fu, Q., Solomon, S., Pahlavan, H. A., & Lin, P. (2019). Observed changes in Brewer‐Dobson circulation for 1980–2018. Environmental
Research Letters, 14. https://doi.org/10.1088/1748‐9326/ab4de7
Garcia, R. R., & Randel, W. J. (2008). Acceleration of the Brewer‐Dobson circulation due to increase in greenhouse gases. Journal of the
Atmospheric Sciences, 65, 2731–2739. https://doi.org/10.2275/2008JAS2712.1
Garcia, R. R., Randel, W. J., & Kinnison, D. E. (2011). On the determination of age of air trends from atmospheric trace species. Journal of
the Atmospheric Sciences, 68, 139–154. https://doi.org/10.1175/2010JAS3527.1
Garcia, R. R., & Richter, J. H. (2019). On the momentum budget of the quasi‐biennial oscillation in the Whole Atmosphere Community Climate Model. Journal of the Atmospheric Sciences, 76(1), 69–87.
Geng, L., Murray, L. T., Mickley, L. J., Lin, P., Fu, Q., Schauer, A. J., & Alexander, B. (2017). Isotopic evidence of multiple controls on atmospheric oxidants over climate transitions. Nature, 546(7656), 133–136. https://doi.org/10.1038/nature22340
Gerber, E. P., Butler, A., Calvo, N., Charlton‐Perez, A., Giorgetta, M., Manzini, E., et al. (2012). Assessing and understanding the impact of stratospheric dynamics and variability on the Earth system. Bulletin of the American Meteorological Society, 93(6), 845–859. https://doi.org/10.1175/BAMS‐D‐11‐00145.1
Gettelman, A., Mills, M. J., Kinnison, D. E., Garcia, R. R., Smith, A. K., Marsh, D. R., et al. (2019). The Whole Atmosphere Community Climate Model version 6 (WACCM6). Journal of Geophysical Research: Atmospheres, 124, 12,380–12,403. https://doi.org/10.1029/ 2019JD030943
Hall, T. M., & Plumb, R. A. (1994). Age as a diagnostic of stratospheric transport. Journal of Geophysical Research, 99(D1), 1059–1070. https://doi.org/10.1029/93JD03192
Haynes, P. H., Marks, C. J., Mcintyre, M. E., Shepherd, T. G., & Shine, K. P. (1991). On the“downward control” of extratropical diabatic circulations by eddy‐induced mean zonal forces. Journal of the Atmospheric Sciences, 48, 651–678.
Hegglin, M. I., & Shepherd, T. G. (2009). Large climate‐induced changes in ultraviolet index and stratosphere‐to‐troposphere ozone flux.
Nature Geoscience, 2(10), 687–691.
Holton, J. R., Haynes, P. H., McIntyre, M. E., Douglass, A. R., Rood, R. B., & Pfister, L. (1995). Stratosphere‐troposphere exchange. Reviews
of Geophysics, 33, 403–439. https://doi.org/10.1029/95RG02097
Kucera, M., Rosell‐Mele, A., Schneider, R., Waelbroeck, C., & Weinelt, M. (2005). Multiproxy approach for the reconstruction of the glacial ocean surface (MARGO). Quaternary Science Reviews, 24(7‐9), 813–819.
Li, F., Austin, J., & Wilson, R. J. (2008). The strength of the Brewer‐Dobson circulation in a changing climate: Coupled chemistry‐climate model simulations. Journal of Climate, 21, 40–57. https://doi.org/10.1175/2007JCLI1663.1
Li, F., Waugh, D. W., Douglass, A. R., Newman, P. A., Strahan, S. E., Ma, J., et al. (2012). Long‐term changes in stratospheric age spectra in the 21st century in the Goddard Earth Observing System Chemistry‐Climate Model (GEOSCCM). Journal of Geophysical Research, 117, D20119. https://doi.org/10.1029/2012JD017905
Lin, P., & Fu, Q. (2013). Changes in various branches of the Brewer‐Dobson circulation from an ensemble of chemistry climate models.
Journal of Geophysical Research: Atmospheres, 118, 73–84. https://doi.org/10.1029/2012JD018813
Luz, B., Barkan, E., Bender, M. L., Thiemens, M. H., & Boering, K. A. (1999). Triple‐isotope composition of atmospheric oxygen as a tracer of biosphere productivity. Nature, 400, 547–550.
McLandress, C., Jonsson, A. I., Plummer, D. A., Reader, M. C., Scinocca, J. F., & Shepherd, T. G. (2010). Separating the dynamical effects of climate change and ozone depletion. Part I Southern Hemisphere stratosphere. Journal of Climate, 23, 5002–5020. https://doi.org/ 10.1175/2010JCLI3586.1
McLandress, C., & Shepherd, T. G. (2009). Simulated anthropogenic changes in the Brewer‐Dobson circulation, including its extension to high latitudes. Journal of Climate, 22, 1516–1540. https://doi.org/10.1175/2008JCLI2679.1
Murray, L. T., Mickley, L. J., Kaplan, J. O., Sofen, E. D., Pfeiffer, M., & Alexander, B. (2014). Factors controlling variability in the oxidative capacity of the troposphere since the Last Glacial Maximum. Atmospheric Chemistry and Physics, 14, 3589–3622. https://doi.org/10.5194/ acp‐14‐3589‐2014
Nowack, P. J., Abraham, N. L., Maycock, A. C., Braesicke, P., Gregory, J. M., Joshi, M. M., et al. (2015). A large ozone‐circulation feedback and its implications for global warming assessments. Nature Climate Change, 5, 41–45. https://doi.org/10.1038/NCLIMATE2451
10.1029/2019GL086271
Geophysical Research Letters
Acknowledgments
This research was supported by National Science Foundation Grant AGS‐1821437 and NASA Grant 80NSSC18K1031. R. H. W. was partially funded by the European Union's Horizon 2020 research and innovation program under the Marie
Sklodowska‐Curie Grant Agreement No. 797961. S. S. was partially funded under National Science Foundation grant 1848863. We would like to acknowledge high‐performance computing support from Cheyenne (doi:10.5065/D6RX99HX) provided by NCAR's Computational and Information Systems Laboratory, sponsored by the National Science Foundation, for the WACCM6 simulations and analyses presented in this study and for data management, storage, and preservation. The data used can be obtained from the University of Washington Research Works Archive through the link http:// hdl.handle.net/1773/45025. The National Center for Atmospheric Research is sponsored by the U.S. National Science Foundation.
Oberlander, S., Langematz, U., & Meul, S. (2013). Unraveling impact factors for future changes in the Brewer‐Dobson circulation. Journal
of Geophysical Research: Atmospheres, 118, 10,296–10,312. https://doi.org/10.1002/jgrd.50775
Okamoto, K., Sato, K., & Akiyoshi, H. (2011). A study on the formation and trend of the Brewer‐Dobson circulation. Journal of Geophysical
Research, 116, D10117. https://doi.org/10.1029/2010JD014953
Oman, L., Waugh, D. W., Pawson, S., Stolarski, R. S., & Newman, P. A. (2009). On the influence of anthropogenic forcings on changes in the stratospheric mean age. Journal of Geophysical Research, 114, D03105. https://doi.org/10.1029/2008JD010378
Pawson, S., Kodera, K., Hamilton, K., Shepherd, T. G., Beagley, S. R., Boville, B. A., et al. (2000). The GCM‐Reality Intercomparison Project for SPARC (GRIPS): Scientific issues and initial results. Bulletin of the American Meteorological Society, 81(4), 781–796. https://doi.org/ 10.1175/1520‐0477(2000)081<0781:TGIPFS>2.3.CO;2
Plumb, R. A. (2002). Stratospheric transport. Journal of the Meteorological Society of Japan, 80, 793–809. https://doi.org/10.2151/jmsj.80.793 Polvani, L. M., Abalos, M., Garcia, R., Kinnison, D., & Randel, W. J. (2018). Significant weakening of Brewer‐Dobson circulation trends
over the 21st century as a consequence of the Montreal Protocol. Geophysical Research Letters, 45, 401–409. https://doi.org/10.1002/ 2017GL075345
Polvani, L. M., Wang, L., Abalos, M., Butchart, N., Chipperfield, M. P., Dameris, M., et al. (2019). Large impacts, past and future, of ozone‐depleting substances on Brewer‐Dobson circulation trends: A multi‐model assessment. Journal of Geophysical Research:
Atmospheres, 124, 6669–6680. https://doi.org/10.1029/2018JD029516
Polvani, L. M., Waugh, D. W., Correa, G. J. P., & Son, S. W. (2011). Stratospheric ozone depletion: The main driver of twentieth‐century atmospheric circulation changes in the Southern Hemisphere. Journal of Climate, 24, 795–812. https://doi.org/10.1175/2010JCLI3772.1 Rayner, N. A., Parker, D. E., Horton, E. B., Folland, C. K., Alexander, L. V., Rowell, D. P., et al. (2003). Global analyses of sea surface
temperature, sea ice, and night marine air temperature since the late nineteenth century. Journal of Geophysical Research, 108(D14), 4407. https://doi.org/10.1029/2002JD002670
Rind, D., Chandler, M., Lonergan, P., & Lerner, J. (2001). Climate change and the middle atmosphere. 5. Paleostratosphere in cold and warm climates. Journal of Geophysical Research, 106, 20,195–20,212.
Rind, D., Lerner, J., McLinden, C., & Perlwitz, J. (2009). Stratospheric ozone during the Last Glacial Maximum. Geophysical Research
Letters, 36, L09712. https://doi.org/10.1029/2009GL037617
Rind, D., Suozzo, R., Balachandran, N. K., & Prather, M. J. (1990). Climate change and the middle atmosphere, Part I: The doubled CO2
climate. Journal of the Atmospheric Sciences, 47, 475–494. https://doi.org/10.1175/1520‐0469(1990)047<0475:CCATMA>2.0.CO;2 Rosenlof, K. H. (1995). Seasonal cycle of the residual mean meridional circulation in the stratosphere. Journal of Geophysical Research, 100,
5173–5191. https://doi.org/10.1029/94JD03122
Shepherd, T. G. (2008). Dynamics, stratospheric ozone, and climate change. Atmosphere‐Ocean, 46, 117–138.
Shepherd, T. G., & McLandress, C. (2011). A robust mechanism for strengthening of the Brewer‐Dobson circulation in response to climate change: Critical‐layer control of subtropical wave breaking. Journal of the Atmospheric Sciences, 68, 784–797. https://doi.org/10.1175/ 2010JAS3608.1
Shindell, D. T., & Schmidt, G. A. (2004). Southern Hemisphere climate response to ozone changes and greenhouse gas increases.
Geophysical Research Letters, 31, L18209. https://doi.org/10.1029/2004GL020724
Solomon, S., Kinnison, D., Bandoro, J., & Garcia, R. R. (2015). Simulation of polar ozone depletion: An update. Journal of Geophysical
Research: Atmospheres, 120, 7958–7974. https://doi.org/10.1002/2015JD023365
SPARC CCMVal (2010). SPARC report on the evaluation of chemistry‐climate models, in SPARC Report No. 5, WCRP‐132, WMO/TD‐No, edited by V. Eyring, T. G. Shepherd, and D. W. Waugh, pp. 1526.
Szopa, S., Thiéblemont, R., Bekki, S., Botsyun, S., & Sepulchre, P. (2019). Role of the stratospheric chemistry‐climate interactions in the hot climate conditions of the Eocene. Climate of the Past, 15, 1187–1203. https://doi.org/10.5194/cp‐15‐1187‐2019
Waugh, D. W., & Hall, T. N. (2002). Age of stratospheric air: Theory, observations and models. Reviews of Geophysics, 40(4), 1010. https:// doi.org/10.1029/2000RG000101
Yeung, L. Y., Murray, L. T., Martinerie, P., Witrant, E., Hu, H., Banerjee, A., et al. (2019). Isotopic constraint on the twentieth‐century increase in tropospheric ozone. Nature, 570(7760), 224–227. https://doi.org/10.1038/s41586‐019‐1277‐1