1 Part 1: Calibration Solutions
3 4
Daniel G. Beach1, Sheila Crain1, Nancy Lewis1, Patricia LeBlanc1, Hardstaff, W.R.1, Ruth 5
Perez1, Sabrina D. Giddings1, Camillo F. Martinez-Farina1, Ian W. Burton1, Jane Kilcoyne2, 6
Jeremy E. Melanson1,φ, Michael A. Quilliam1, Pearse McCarron1* 7
8
1
National Research Council Canada, Measurement Science and Standards, 1411 Oxford St., 9
Halifax, NS, Canada, B3H 3Z1 10
2
Marine Institute, Rinville, Oranmore, Co. Galway, H91 R673, Ireland 11
φ
Current address: National Research Council Canada, Measurement Science and Standards, 12
1200 Montreal Road, Ottawa, Ontario, Canada, K1A 0R6. 13
14 15
Table of Contents 16
SI-1: Structural Characterization of 19-epi-DTX2 by NMR 17
SI-2: High Resolution Mass Spectrometry Analysis of DSP CRMs 18
SI-3: Preliminary Stability Studies on OA in Solution 19
SI-4: Additional Selected Reaction Monitoring Conditions 20
SI-5: LC-FLD of ADAM Derivatized DSP toxin CRMs 21
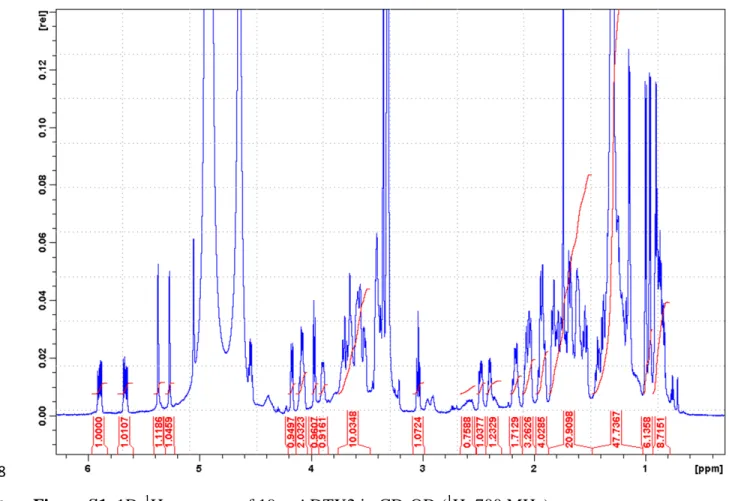
2 1D-1H spectrum showed resonances consistent with DTX2, notably the vinyl protons at lower 24
field than the OH resonance of the solvent and the proper number of methyl resonances (Figure 25
S1). Proton and 13C chemical shifts are shown in Fig. S2A and S2B respectively. The proton 26
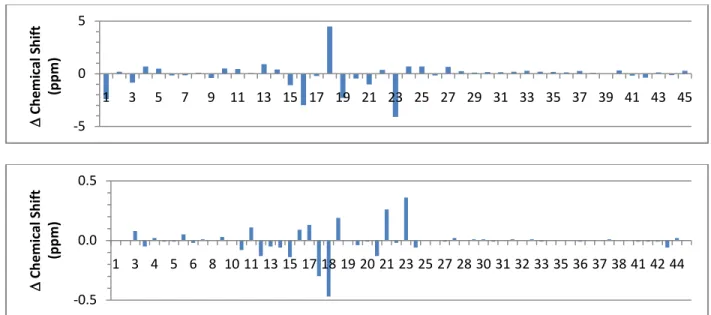
resonances were identical to published data for DTX2 (1) except for significant deviations in 27
chemical shift between positions C15 and C23, with a maximum difference at C18 and C23, as 28
shown in Fig. S3 for both the 1H and 13C. This is consistent with the published reports of the 19-29
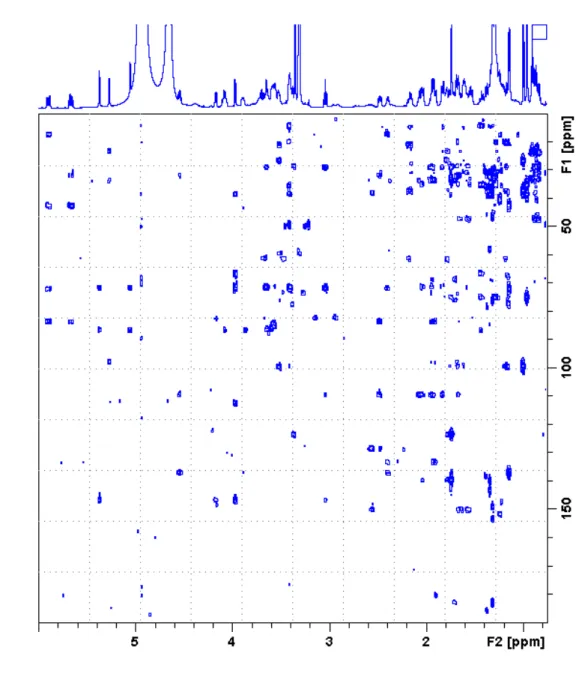
epimer of OA (2). 13C resonances were determined from the HSQC (Fig. S4) and HMBC (Fig. 30
S5) spectra. Analysis of the HSQC spectrum yielded 5 methyl resonances, 16 methylene 31
resonances and 16 methine resonances. The HMBC spectrum gave chemical shifts for a further 7 32
quaternary carbons. 33
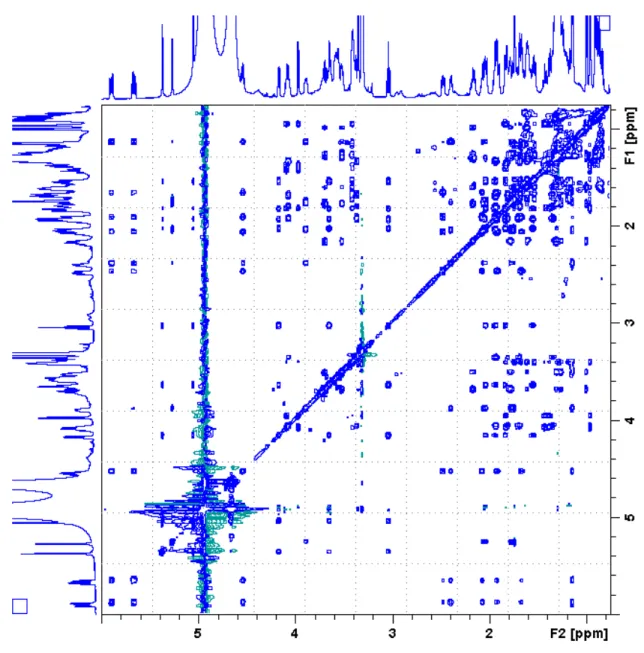
Interpretation of the 2D-1H TOCSY spectrum (Fig. S6) revealed the following spin systems: 34 1. 4.06, 3.36, 1.93, 1.80, 1.70, 1.67, 1.35 35 2. 5.89, 5.66, 4.53, 3.88, 2.47, 2.39, 2.07, 2.04, 1.91, 1.77, 1.66, 1.13 36 3. 4.16, 3.66, 3.04, 2.03, 1.93, 1.83, 1.53 37 4. 4.08, 3.97, 3.41, 1.82, 1.73, 1.67, 1.60, 1.53, 1.42, 1.37, 1.27, 1.17, 0.96 38 5. 3.69, 3.51, 2.17, 1.78, 1.61, 1.30, 1.26, 0.99 39
Isolated resonances were also observed at 1.73, 1.31 ppm. Vinyl resonance at 5.26 ppm also 40
showed TOCSY correlations to the methyl resonance at 1.73 ppm and the resonances at 2.04 and 41
1.77 ppm. The vinyl resonances at 5.37 and 5.05 ppm showed TOCSY correlations to resonances 42
at 4.16, 3.66 and 3.04 ppm. Analysis of the COSY (Fig. S7), TOCSY (Fig. S6) and HMBC (Fig. 43
S5) spectra revealed the same connectivity as in DTX2. Figure S8 shows the TOCSY spin 44
3 47
48
Figure S1. 1D-1H spectrum of 19-epi-DTX2 in CD3OD (1H: 700 MHz).
49 50
4 51
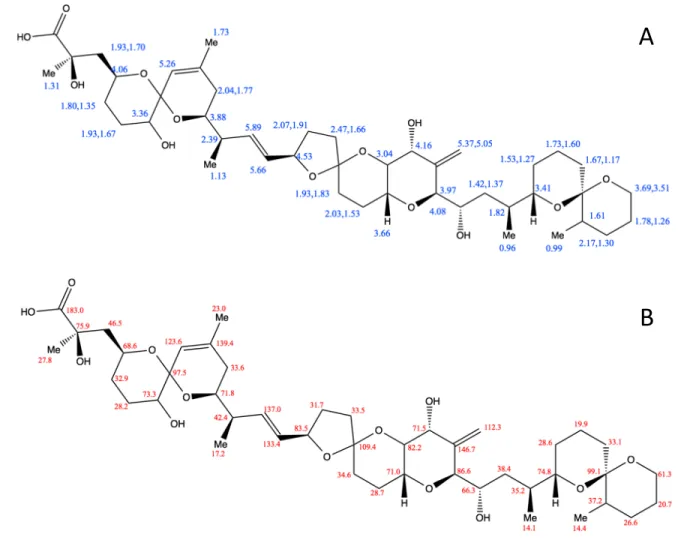
Figure S2. Structure of 19-epi-DTX2 showing 1H (A) and 13C (B) chemical shift assignments. 52
53
A
5 55
56
Figure S3. Plot of the difference in 13C chemical shift (top) and 1H chemical shift (bottom) 57
between DTX2 and 19-epi-DTX2. Note the largest difference is at the protons and carbons of 58 C18 and C23. 59 60 -5 0 1 3 5 7 9 11 13 15 17 19 21 23 25 27 29 31 33 35 37 39 41 43 45 ∆ Ch em ica l S hif t (p pm) -0.5 0.0 0.5 1 3 4 5 6 8 10 11 13 15 17 18 19 20 21 23 25 27 28 30 31 32 33 35 36 37 38 41 42 44 ∆ Ch em ica l S hif t (p pm)
6 Figure S4. 1H-13C HSQC spectrum of 19-epi-DTX2 acquired with multiplicity sorting.
62 63
7 65
66
Figure S5. 1H-13C HMBC spectrum of 19-epi-DTX2 acquired with 60 ms mixing time time in 67
CD3OD.
68 69
8 71
72
Figure S6. TOCSY spectrum of 19-epi-DTX2 with 120 ms mixing time in CD3OD.
73 74
9 Figure S7. DQF-COSY spectrum of 19-epi-DTX2 in CD3OD.
77 78
10 Figure S8. TOCSY spin systems shown as bold bonds. Red arrows indicate the key HMBC 80
correlations (pointing from carbon to proton) used to connect the spin systems. The blue arrow 81
indicates the COSY correlation between the pendant vinyl protons H41 at 5.37 and 5.05 ppm and 82
H24 at 4.16 ppm. The numbering of carbons in the molecule is consistent with Hu et al, 1992. 83
11 86
87
Figure S9. High-resolution full scan (A) and product ion (B) mass spectra of the [M-H]- ion, m/z 88
803, of OA in CRM-OA-d measured on a Thermo Exactive Orbitrap mass spectrometer 89
equipped with a heated electrospray ionization probe. Data acquired in negative ion mode with a 90
-2.7 kV spray voltage, +360 °C capillary temperature, and +250 °C heater temperature. HCD 91
collision energy in (B) was 60 V. 92 93 700 750 800 850 900 R el at iv e int ens it y ( % ) 0 20 40 60 80 100 803.4587 [OA-H]- = 803.4588 mass error = - 0.1 ppm m/z 50 100 150 200 250 300 350 0 20 40 60 80 100 255.1233 151.0756 113.0598 87.0078
A
B
12 94
95
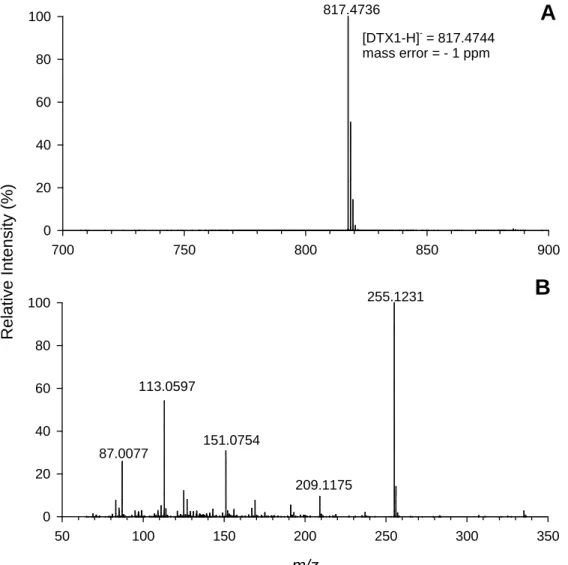
Figure S10. High-resolution full scan (A) and collision induced dissociation (B) mass spectra of 96
the [M-H]- ion, m/z 817, of DTX1 in CRM-DTX1-b measured on a Thermo Exactive Orbitrap 97
mass spectrometer equipped with a heated electrospray ionization probe. Data acquired in 98
negative ion mode with a -2.7 kV spray voltage, + 360 °C capillary temperature, and + 250 °C 99
heater temperature. HCD collision energy in (B) was 60 V. 100 101 700 750 800 850 900 R el at iv e Int ens it y ( % ) 0 20 40 60 80 [DTX1-H]- = 817.4744 mass error = - 1 ppm m/z 50 100 150 200 250 300 350 0 20 40 60 80 100 255.1231 151.0754 113.0597 87.0077
B
209.117513 103
104
Figure S11. High-resolution full scan (A) and collision induced dissociation (B) mass spectra of 105
the [M-H]- ion, m/z 803, of DTX2 in CRM-DTX2-b measured on a Thermo Exactive Orbitrap 106
mass spectrometer equipped with a heated electrospray ionization probe. Data acquired in 107
negative ion mode with a -2.7 kV spray voltage, + 360 °C capillary temperature, and + 250 °C 108
heater temperature. HCD collision energy in (B) was 60 V. 109 110 700 750 800 850 900 R el at iv e int ens it y ( % ) 0 20 40 60 80 [DTX2-H]- = 803.4587 mass error = + 0.4 ppm m/z 50 100 150 200 250 300 350 0 20 40 60 80 100 255.1233 151.0755 113.0598 87.0077
B
14 112
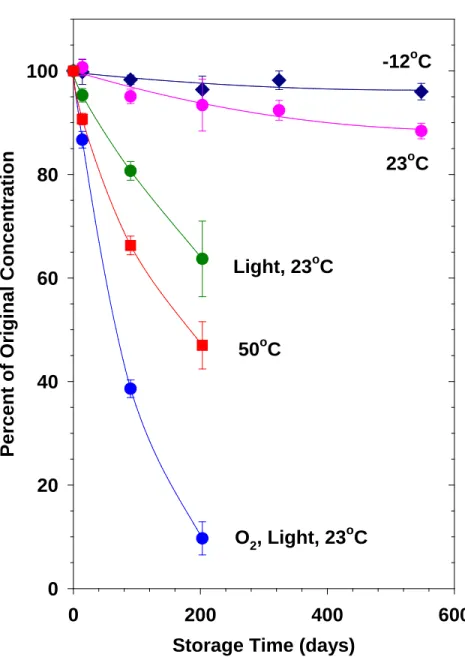
Figure S12. Stability of OA solutions in DMF at a range of temperatures and environmental 113
conditions. 114
115
Storage Time (days)
0 200 400 600 P er ce n t o f O ri g in al C o n ce n tr at io n 0 20 40 60 80 100 -12oC 23oC O2, Light, 23oC Light, 23oC 50oC
15 solution exposed to light and oxygen at room temperature for one week. The product was
118
tentatively identified as the ketone analog formed by elimination of formic acid. 119 120 121 122 123 124 125
16 126
Figure S14. Stability of OA solutions in MeOH at a range of temperatures and environmental 127 conditions. 128 129 130 131 132
Storage Time (days)
0 200 400 P er ce n t o f O ri g in al C o n ce n tr at io n 0 20 40 60 80 100 -12 o C 23oC O2, Light, 23oC Light, 23oC 50oC
17 Table S1: Selected Reaction Monitoring settings used for quantitative LC-MS/MS analysis of 134 DSP toxins. 135 Analyte m/z Precursor > m/z Product Declustering Potential (V) Collision Energy (V) OA 803.5>255.1 803.5>113.1 -80 -80 -65 -85 DTX1 817.5>255.1 817.5>113.1 -70 -70 -70 -90 DTX2 803.5>255.1 803.5>113.1 -80 -80 -65 -85
Parameter Setting Parameter Setting
Dwell
(msec) 125 CUR (psi) 20
GS1 (psi) 50 GS2 (psi) 50
IS (V) -4500 CAD (V) -3
EP (V) -10 CXP (V) -6
136 137
18 SI-5.1 ADAM Derivatization
139
Reactions were carried out under yellow or reduced light. The ADAM precursor, 140
9-anthraldehyde hydrazone, was prepared from 9-anthralaldehyde and hydrazone hydrate 141
according to the method of Nakaya et al. (3). Solutions of 9-anthraldehyde hydrazone (35 mM), 142
N-chlorosuccinimide (35 mM) and quinuclidine (70 mM) were prepared in THF. To prepare the 143
ADAM reagent, equivalent volumes (500 µL) of all three solutions were mixed in an amber 144
glass vial and allowed to react at ambient temperature for 1 hour prior to sample derivatization. 145
A 35 µL aliquot of the sample was placed in a 1.5 mL amber vial with 100 µL of the ADAM 146
reaction reagent. The reaction mixture was placed in a sonication bath (Model 1510, Branson, 147
Danbury, CT, USA) for 10 min at 37 °C and then transferred to a mutlitherm thermal reaction 148
chamber (Model H5000-HC, Benchmark Scientific, Sayreville, NJ, USA) for 2.5 hours at 37 °C. 149
Samples were sonicated for an additional 10 min before drying down using a rotary vacuum drier 150
(Model SPD2010-220, Savant Instrument Inc., Holbrook, NJ, USA) and then reconstituted in 151
300 µL n-hexanes: chloroform (1:1) for SPE. 152
153
SI-5.2 Solid Phase Extraction of Derivatized Samples 154
Derivatized samples were cleaned up using the SPE procedure published previously (4). Glass 155
SPE tubes (7 mL) equipped with a Teflon frit were packed with 0.5 g of activated silica and 156
placed on a vacuum manifold. The columns were conditioned with 6 mL of chloroform and 3 157
mL n-hexanes:chloroform (1:1). The columns were not allowed to become dry from this point 158
on. The ADAM derivatized samples were transferred onto the column and vials were rinsed with 159
2 × 300 µL of n-hexanes: chloroform (1:1) and passed slowly through the column at approx. 1 160
drop/sec. The columns were then washed with 5 mL of n-hexanes: chloroform (1:1) followed by 161
5 mL of chloroform (containing 1.15 % ethanol). Samples were eluted with 5 mL of MeOH: 162
chloroform (1.5:8.5). Eluted fractions were evaporated under nitrogen and reconstituted with 2 163 mL of MeOH. 164 165 166 167
19 LC-FLD analysis was carried out on an Agilent 1200 series LC quipped with a fluorescence 170
detector (model no. G1321A) operated with excitation/emission wavelengths of 254/412 nm. A 171
50 x 2 mm Luna C18 HST(2.5 µm) (Phenomenex, Torrence, CA USA) was eluted isocratically 172
with mobile phase of (A) DIW and (B) 95% acentonitrile each containing 50 mM formic acid 173
and 2 mM ammonium formate at 70% B and 300 µL/min. The column temperature was 20 °C 174
and an injection volume of 5 µL was used. 175
176
177
Figure S15: LC-FLD of ADAM derivatized DSP toxin calibration solutions for OA (b), DTX1 178
(c), DTX2 (d) and a derivatization reagent blank (a). 179 180 Time (min) 0 2 4 6 8 10 12 14 % R el at iv e Int ens it y 0 20 40 60 80 100 (a) (b) (c) (d) OA DTX2 DTX1
20 182
SI: REFERENCES 183
184
(1) Larsen, K., Petersen, D., Wilkins, A.L., Samdal, I.A., Sandvik, M., Rundberget, T., 185
Goldstone, D., Arcus, V., Hovgaard, P., Rise, F., Rehmann, N., Hess, P., & Miles, C.O. 186
(2007) Chem. Res. Toxicol .20, 868-875 187
(2) Cruz, P.G., Hernández Daranas, A., Fernandez, J.J., & Norte, M. (2007) Org. Lett. 9, 3045-188
3048 189
(3) Nakaya, T., Tomomoto, T., & Imoto, M. (1967) Bull. Chem. Soc. Japan 40, 691-692 190
(4) Quilliam, M.A., Gago-Martinez, A., & Rodriguez-Vazquez, J.A. (1998) J. Chromatogr. A 191
807, 229-239 192
![Figure S9. High-resolution full scan (A) and product ion (B) mass spectra of the [M-H] - ion, m/z 88](https://thumb-eu.123doks.com/thumbv2/123doknet/14078062.463254/11.918.168.755.172.782/figure-high-resolution-scan-product-ion-mass-spectra.webp)