Publisher’s version / Version de l'éditeur:
Vous avez des questions? Nous pouvons vous aider. Pour communiquer directement avec un auteur, consultez la Questions? Contact the NRC Publications Archive team at
[email protected]. If you wish to email the authors directly, please see the first page of the publication for their contact information.
https://publications-cnrc.canada.ca/fra/droits
L’accès à ce site Web et l’utilisation de son contenu sont assujettis aux conditions présentées dans le site LISEZ CES CONDITIONS ATTENTIVEMENT AVANT D’UTILISER CE SITE WEB.
Surface and Coatings Technology, 406, 2020-12-10
READ THESE TERMS AND CONDITIONS CAREFULLY BEFORE USING THIS WEBSITE.
https://nrc-publications.canada.ca/eng/copyright
NRC Publications Archive Record / Notice des Archives des publications du CNRC :
https://nrc-publications.canada.ca/eng/view/object/?id=0ffe796c-c22d-465e-88a5-1d8ee6d22e04 https://publications-cnrc.canada.ca/fra/voir/objet/?id=0ffe796c-c22d-465e-88a5-1d8ee6d22e04
NRC Publications Archive
Archives des publications du CNRC
This publication could be one of several versions: author’s original, accepted manuscript or the publisher’s version. / La version de cette publication peut être l’une des suivantes : la version prépublication de l’auteur, la version acceptée du manuscrit ou la version de l’éditeur.
For the publisher’s version, please access the DOI link below./ Pour consulter la version de l’éditeur, utilisez le lien DOI ci-dessous.
https://doi.org/10.1016/j.surfcoat.2020.126735
Access and use of this website and the material on it are subject to the Terms and Conditions set forth at
Particle temperature effect in cold spray: a study of soft particle
deposition on hard substrate
Particle Temperature Effect in Cold Spray: A study of soft particle deposition on
hard substrate
A. Nastica, B. Jodoina, D. Poirierband J-G. Legouxb
a University of Ottawa Cold Spray Laboratory, Ottawa, ON Canada bNational Research Council of Canada, Boucherville, QC, Canada
Abstract
In cold spray, the interactions between feedstock particles and propellant gas control deposition outcome. The particle impact temperature, along with impact velocity, governs the deposition due to its effect on the impact deformation processes. As bonding mechanisms rely predominantly on the particle/substrate plastic flow upon impact, particle impact temperature holds a predominant role in process optimization.
The current work studies the effect of pure aluminum particle impact temperature on deposition phenomena on a hard steel substrate. Particle impact temperature was varied while achieving the same particle impact velocity, using low and high-pressure cold spray systems. Three different particle diameters are studied, with varying resulting inherent impact temperatures, to provide size dependent insight on deposition/adhesion.
Experimental results demonstrate that at low particle impact temperature, i.e. 50°C, coating adhesion is controlled by in-situ peening. Adhesion shifts to particle in-flight characteristics dependent bonding, i.e. = / , as particle temperature increases. At low particle impact temperatures, the coating bond strength increases with increasing in-situ impingement intensity and frequency, i.e. decreasing deposition efficiency with increasing particle size. At higher particle impact temperatures, in-situ peening rate decreases and the adhesion strength increases with decreasing particle size. In addition to affecting the impact process (DE, and adhesion), the particle impact temperature also influences the coating mechanical properties through the creation of temperature-dependent crack propagation mechanisms, i.e. deflection, bridging and acceleration, and particle-particle structural arrangement related deformation processes, i.e. fish scale effect and pseudo-plasticity behavior.
Keywords: upstream injection, downstream injection, numerical critical velocity, particle temperature
List of Symbols
P Flow pressure (N/m2) Average distance between particles
(m)
V Flow velocity (m/s) L Characteristic length (m)
T Flow temperature (K) Z Mass ratio, powder/gas (-) ui Gas velocity component in
i-direction (i=1,2,3) (m/s) d Particle diameter (m)
ρ Density (kg/m3) ̇ Volume flow rate (m3/s)
Drag coefficient ( - ) ̇ Mass flow rate (kg/s)
t Time (s) ̇ Density flow rate (kg/m3s)
Turbulent kinetic energy (m2/s2) Body force (kg m/s2) Turbulent dissipation rate (m2/s3) A Cross-sectional area (m2) Viscosity (kg/m s) D Level of particle interactions ( - ) Inverse effective Prandtl number
for turbulent dissipation rate ( - ) Π Momentum coupling (kg m 2/s2) Turbulent Prandtl number ( - ) Thermal conductivity (kg m/s3 K) Particle phase influence on gas
momentum (kg/m
2s2) Inverse effective Prandtl number for turbulent kinetic energy
( - )
Contribution of the fluctuating dilatation in compressible turbulence to dissipation rate
(kg/m s3) Stress tensor in viscous dissipation term
(kg/m s2) Generation of turbulence kinetic
energy due to mean velocity gradient
(kg/m s3) Radial direction coordinate ( - ) Generation of turbulence kinetic
energy due to buoyancy (kg/m s
3) , User-defined source terms (kg/m s3)
, , RNG k- turbulent model
constants ( - ) Specific heat at constant volume
(m2/s2K) ℎ Total system enthalpy (kg m2/s2) , RNG constants ( - )
Normal direction coordinate ( - ) S Modulus of the mean rate-of-strain tensor
(1/s) Particle-size-dependent fitting
parameter ( - ) σ Particle m material tensile strength
(N/m2) Cartesian coordinate in the
i-direction (i=1,2,3) ( m ) Cumulative percentage (%)
n Spread factor ( - ) Average Nusselt number ( - )
Particle Reynolds number ( - ) Particle Mach number ( - )
Abbreviations
BSD Backscattered detector HPCS High pressure cold spray CFD Computational fluid dynamics LPCS Low pressure cold spray CGDS Cold gas dynamic spray PBI Polybenzimidazole
CSM Cold spray meter RNG Re-normalized group
DE Deposition efficiency SEM Scanning electron microscopy DRW Discrete random walk SOD Standoff distance
FEM Finite element model VC Critical velocity
Critical velocity Kinetic energy
Ra Arithmetic surface roughness LPIT Low particle impact temperature HPIT High particle impact temperature
Subscripts
i ith coordinate variable (=1,2,3 vector component) t Turbulent j Einstein summation of j=1,2,3 g Gas
p Particle m Melting
1 INTRODUCTION
The cold gas dynamic spray (CGDS) process, or simply cold spray (CS), is used for the deposition of various materials and has become a promising method in multiple material processing fields, including additive manufacturing (Ref 1–3). CGDS is based on the energy exchange between a gas flow and injected powder material. The gas stream (nitrogen, helium or air) is directed through a converging/diverging nozzle to reach the supersonic regime. Particles are injected into the nozzle and propelled to high velocities reaching values between 300m/s and 1200m/s (Ref 4,5). Upon impact with a target surface (substrate), up to 90% of the particle kinetic energy is converted into heat, while the remaining energy is used for viscoelastic and elastic deformations of particle and substrate. The successful adhesion of the impacting material depends on various phenomena that initiate due to the high strain rate plastic deformation occurring at the impact boundaries (Ref 5–8). Reported strain and strain rates at the particle/substrate interface reach values of 10 and 109 s-1, respectively (Ref 9), which are far beyond values commonly encountered in classical powder manufacturing methods (Ref 10,11). These extreme material deformation phenomena lead to surface oxide layer breakup, localized melting, amorphization, diffusion, shear instability and hydrodynamic plasticity (Ref 8,12,13).
Aside from the particle material properties, the CGDS impact dynamics rely on in-flight particle/gas momentum and energy exchange processes. The process gas stagnation pressure and temperature govern the flow dynamics and thus particle in-flight characteristics (Ref 14–16). The particle/gas mixture undergoes large changes in many properties inside and outside the nozzle. Furthermore, the occurrence of oblique shocks and Mach disks, inducing abrupt discontinuity and instantaneous variation in gas flow characteristics can significantly affect the particle thermal history prior to impact (Ref 17,18). A few studies have captured the gas stream phenomenological characteristics using Schlieren photography (Ref 19,20). Computational fluid dynamics (CFD) models have also been used to study the driving gas behavior with the objective of assessing the particle impact velocity and temperature. These CFD efforts have generated physically realistic flow simulations (Ref 17,18,21,22). CGDS particle velocities have been measured through laser-light sheet, laser two focus velocimetry and high speed cameras (Ref 23–31). These experimental observations have been used to develop proper momentum transfer models, contributing to adequate prediction of the particle impact velocity influence on deformation and deposition (Ref 32–36). However, the low particle temperatures in the CGDS process coupled with high particle velocities prohibit the use of classical optical pyrometry, which makes any CGDS particle temperature measurement a technical challenge. In a recent study, CGDS particle in-flight temperature measurements have been successfully reported (Ref 14), allowing the evaluation and development of a proper particle transient heat transfer model. Many have reported various benefits of increasing particle impact temperature on deposition and adhesion, which have been related to improved particle deformation promoting the creation of zones suitable for bonding (Ref 37–39). To support this assertion, use of external powder preheating systems has shown to increase DE and adhesion in low-pressure CS systems using downstream injection (Ref 39–42). Analogously, in high-pressure CS systems, in which the powder injection is made axially in the converging section, reported DE’s reaching up to 95% (Cu on Al) (Ref 33,43), as heat transfer processes are promoted in the stagnant pre-chamber high temperature gas.
Hence, the primary objective of the current work is to investigate the effect of particle impact temperature and size on deposition for soft particle/hard substrate material combination. The influence of particle impact temperature on deposition characteristics (deposition efficiency and critical velocity), adhesion and coating properties (apparent ductility) are studied. Since particle impact temperature is impossible, validated CFD models are used to obtain the particle impact temperatures (Ref 14). Particle velocities are measured and used to validate the model’s accuracy. Low and high-pressure cold spray systems (LPCS and HPCS) have been utilized to generate deposits with similar particle impact velocities but different particle impact temperatures. The particle injection location and particle trajectory are used to explain the statistical particle in-flight characteristics. The experiments are conducted for three distinct particle size ranges to provide a size-dependent analysis.
2 EXPERIMENTAL PROCEDURES 2.1 Feedstock powder
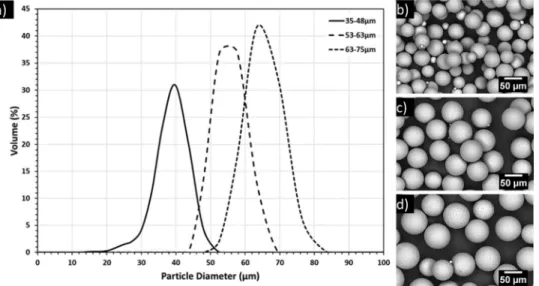
Spherical commercially pure aluminum feedstock powder has been used (Equispheres, ON, CA) in the generated deposits. Three distinct sets of powders with different size diameter distributions have been selected to study the effect of particle size on impact temperature and its influence on coating deposition and bonding developments. Figure 1a presents the particle size distribution for all three powder sets. The powder sets are referred to as set 1, set 2 and set 3 and present an average powder size of 40 µm, 58 µm and 68 µm respectively. As shown in Figure 1b, c and d, using electron microscopy (SEM, Zeiss, EVO-MA10, UK) images under backscattered electron detector (BSD), all three powder sets exhibit a spherical shape with negligible presence of satellites.
Figure 1: a) Feedstock powder size distribution. The geometry and size of all three powder sets are depicted in b) set 1, c) set 2 and d) set 3 using backscattered scanning electron microscope (BSD-SEM) images.
2.2 Substrate material
Low carbon steel, SAE1018, (25.4mm diameter and 40mm height) has been used as substrate material. Surface preparation and coating depositions were performed on the flat ends of the cylindrical samples. Two surface preparation methods have been utilized. A mirror finish surface has been obtained by gradual grinding and polishing steps up to a final process using 3 μm abrasive suspensions. A grit blasting method using a 20mesh (850μm) ferrosilicate abrasive was also utilized as a second surface preparation method to roughen the substrate surface. Prior to the deposition process, all substrates have been cleaned and degreased using ethanol. During coating deposition, all substrates have been thermally insulated from the surroundings to avoid uncontrolled substrate temperature variations. A digital optical microscope (VHX-2000 Keyence Corporation, Osaka, Japan) has been used to obtain profile depths, which have been subsequently imported in Matlab for the calculation of the arithmetic surface roughness average, Ra.
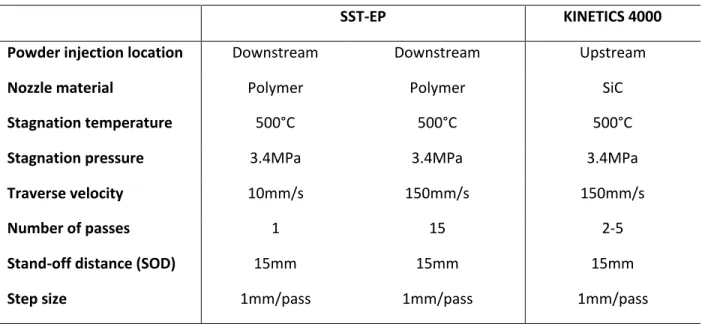
Commercially available CS systems (SST-EP, CenterLine Limited, Windsor, ON, CA and Oerlikon Metco KINETICS 4000, Schwytz, CH) have been utilized to deposit the aluminum powders. In the SST-EP system, the powder is injected radially in the diverging nozzle section. A PBI nozzle has been used for all deposition made with the LPCS (Ref 44). Due to the significant particle trajectory deviation shown to occur after particle nozzle wall deterioration from impact wear (Ref 44), a new unworn PBI nozzle has been utilized for all deposits. The powder injection in the HPCS system is located in the center of the converging nozzle section, parallel to the nozzle axis. A SiC nozzle has been used in the KINETIKS 4000 system. The nozzles geometries and dimensions are provided in detail in section 3.1. Table 1 presents the spray parameters used when operating each system to ensure comparable particle impact velocities while providing different particle impact temperatures.
Powder feeding rate was kept similar for all sprays (≈ 20g/min). Deposition efficiency (DE) has been measured using the specimen weight gain with respect to the total powder weight propelled at the substrate surface. As presented in Table 1, the LPCS deposits have been made using two gun traverse velocities, i.e. 10 mm/s and 150 mm/s, while only 150 mm/s was utilized for HPCS deposits due to the robot minimum speed limit. For the LPCS, spot sprays, i.e. powder deposition at a single gun position, have also been carried out to characterize the particle spatial position upon deposition.
Coating microstructural analysis has been performed through digital optical microscopy, scanning electron microscopy using secondary (SE) and backscattered detectors.
Table 1: CS process deposition parameters and features
SST-EP KINETICS 4000 Powder injection location Downstream Downstream Upstream
Nozzle material Polymer Polymer SiC
Stagnation temperature 500°C 500°C 500°C
Stagnation pressure 3.4MPa 3.4MPa 3.4MPa
Traverse velocity 10mm/s 150mm/s 150mm/s
Number of passes 1 15 2-5
Stand-off distance (SOD) 15mm 15mm 15mm
Step size 1mm/pass 1mm/pass 1mm/pass
2.4 Particle velocity measurement
The in-flight particle velocity was measured at a distance of 15mm from the nozzle exit using a Cold Spray Meter (CSM) eVolution (Tecnar Automation Ltd., St-Bruno, Canada). The CSM is equipped with a
diffracted light is subsequently captured and collected data filtered by an internal interpreting system. The velocity is calculated using the traveling distance and time interval that the detected particle takes to cross two mask slits. For statistical purposes, a minimum of 1000 individual particle velocities have been measured for each conducted tests. The velocity readings have been made at the center of the nozzle for all cases.
2.5 Adhesion tests
Coating adhesion strength values have been obtained and evaluated following the ASTM-C633 standard. A thermally curing elastomeric adhesive, FM-1000 (Cytec Engineering Materials, MD, USA) has been used to glue the cylindrical coated substrates to counter uncoated steel cylindrical specimens. Prior to testing, all coatings have been machined to a 550µm thickness. Once cured and cooled to room temperature, the assembly has been pulled using an universal tensile testing machine (Instron Series 4482, MA, US) at a rate of 0.017mm/s and failed coating fracture surfaces have been subsequently analysed. Three to five coatings have been tested per spray set.
2.6 Bend-to-break tests
Bend-to-break tests have been performed, following a procedure similar to the ASTM D4145-10 standard, using coatings deposited on grit blasted surfaces. After machining the coatings down to 550µm thickness, natural interfacial delamination occurring during high speed saw cutting processes allowed proper coating removal from the steel substrate. The machined surface was placed under tension while the other side (initially bonded to the roughened substrate surface) was put under compression to avoid pre-mature crack propagation and arbitrary surface roughness dependant results.
3 COMPUTATIONAL FLUID DYNAMICS
3.1 Geometry and operating conditions
The commercially available Computational Fluid Dynamics (CFD) ANSYS Fluent 19 software was used to model the carrier and driving gas flows and particulate phase for both spray systems. The three-dimensional meshing systems, using approximately 2 million cells, are shown in Figure 2. The meshes were generated through ANSYS WB Meshing Tool by discretizing the computational domain into separate grids and using edge sizing with a biased growth rate to increase resolution near the nozzle walls. A grid dependency study was performed to determine the appropriate grid size ensuring grid independency. The substrate surface, modeled as an adiabatic wall, was placed at the end of the atmospheric environment at the corresponding 15 mm stand-off distance. The surrounding environment was set at a radius of 80 mm to avoid disturbance of the flow field. The solutions were considered converged when the residuals were decreased by at least three orders of magnitude. In addition, the mass imbalance was also verified (~8e-8kg/s) at convergence.
Figure 2: Three-dimensional computational domain dimensions and meshing details for both CGDS systems. a) upstream powder injection HPCS system and b) downstream powder injection LPCS system.
Pressure-based boundary conditions were applied at the main gas inlet and outlet of each nozzle and the flow was treated as a compressible flow. Mass flow rate boundary conditions, according to experimental values, were set to 0.00033 kg/s and 0.0036 kg/s for the powder feeding line nitrogen flow in the LPCS and HPCS cases respectively. A no-slip condition was enforced on all nozzle walls. The various boundary conditions are summarized in Table 2.
Table 2: Boundary conditions
Location P V T
Nozzle inlet Specified stagnation
= 0 Specified stagnation
Powder inlet N/A (mas flow rate
specified) = 0
Room temperature
Surrounding atmosphere Ambient condition
= 0 = 0 Nozzle walls = 0 0 = 0 Substrate surface = 0 0 = 0 Symmetrical axis = 0 = 0 = 0
Substrate/wall
= 0 0 = 0
3.2 Gas flow model
The Reynolds Averaged Navier-Stokes (RANS) equations along with the re-normalized group (RNG k- ) turbulence model was utilised to model the gas flow structure inside and outside the converging/diverging nozzle. The RANS- based model accounts for the effect of turbulence while greatly reducing the required computational resources. A total of six governing equations have thus been utilized; conservation of mass and energy, momentum balance (in three dimensions) and turbulent kinetic energy. The continuity equation is written as follow;
+ ( ) = 0, Eq. 1
where is the gas flow density, is the time, is the flow velocity in the direction and is a coordinate variable in space. The momentum balance is;
( ) + = − + + + , Eq. 2
where P is the pressure and includes an additional term due to the turbulent normal stress, represents the mass added to the gas phase from the dispersed particulate phase or the momentum change it generates to the gas phase in each coordinate system and accounts for turbulent viscosity;
= ϵ , Eq. 3
where =0.0845 (Ref 45). The k and terms are obtained using the following respective differential transport equations;
( ) + ( ) = + + − + − , Eq. 4
and
( ) + ( ) = + ( + ) − + − , Eq. 5
where , and are turbulent constants depending on the application and simulation conditions (Ref 46). The and quantities are the inverse effective Prandtl numbers for k and terms, respectively. and represents the generation of turbulent kinetic energy due to the mean velocity gradients and due to the buoyancy, respectively. The and are user-defined source terms. The RNG additional term, , in the dissipation rate equation is given by;
= 1 +(1 − ⁄ ) , Eq. 6
where ≡ / and in which refers to the modulus of the mean rate-of-strain tensor, = 4.33 and = 0.012 (Ref 45).
The model total energy or total enthalpy (ℎ ) modified for the Reynolds average energy equation is given by;
( ℎ ) − + ℎ = + ℎ + − + , Eq. 7
where is the turbulent Prandtl number, is the source term expressing the heat transfer between the flow and particles, is the stress tensor and is the thermal conductivity. The total enthalpy refers to the total energy of the system including viscous work, such that;
ℎ = + ( ) + . Eq. 8
The additional terms, i.e. and , provided in Eq.2 and Eq.7 respectively, have been neglected due to the high Stokes number, St, and low momentum coupling interactions parameter, Πmomobtained in the current study. The momentum coupling expressed in the following equation, is used to assess the impact of the aluminum particle phase on the nitrogen gas flow;
Π = Z
18 + 1
, Eq. 9
where the subscript p and g refer to the particle and gas phase respectively, d is the particle diameter, L is the characteristic length, i.e. diameter of the nozzle at a specific location, and Z is the mass ratio of powder to gas. The momentum coupling parameter has been calculated and is less than 5% in all cases, such that the gas phase momentum variation due to the presence of particles has not been included (Ref 47). In addition, many have used the volumetric, ̇ , particle to gas flow ratio to evaluate the significance of the particle phase influence on the gas flow (Ref 41,48,49);
̇ ̇ = ̇ ̇ ∙ ̇ ̇ , Eq. 10
where ̇ and ̇ are the mass and density flow rate, respectively. Provided that ≪ holds and that the powder feed rate used in the current study is 20 g/min, a ratio less than 1% is obtained indicating negligible effects. Particle-particle interactions can also have an effect on the behavior of the particulate flow. The particle level of interactions can be described using the mean distance between particles, , to the average particle diameter, ,;
= . Eq. 11
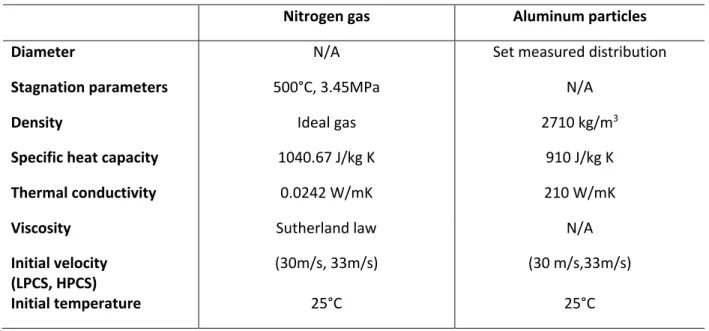
Since values over ten have been obtained in the current study, the particles are considered isolated and the particle to particle interactions have been neglected (Ref 49). Based on the above discussion details and analysis, a one-way coupled Lagrangian particle tracking method has been assessed as appropriate (Ref 47,48,50,51). A density-based solver with a Green-Gauss node-based gradient method was utilized to model the nitrogen gas stream features. The ideal gas law has been used to account for the compressibility effects and a two-coefficient temperature-dependant Sutherland law is used to express viscosity variations with temperature (Ref 14). Table 3 provides a summary of the gas and particle characteristics utilized in the current computational work.
Table 3: Simulated phase properties included in the computational work
Nitrogen gas Aluminum particles Diameter N/A Set measured distribution
Stagnation parameters 500°C, 3.45MPa N/A
Density Ideal gas 2710 kg/m3
Specific heat capacity 1040.67 J/kg K 910 J/kg K
Thermal conductivity 0.0242 W/mK 210 W/mK
Viscosity Sutherland law N/A
Initial velocity
(LPCS, HPCS) (30m/s, 33m/s) (30 m/s,33m/s)
Initial temperature 25°C 25°C
3.3 Discrete phase/Particle
3.3.1 Momentum and heat transfer
The particle phase was modeled as an inert point in space using a Lagrangian method. The velocity and trajectory of the discrete phase, i.e. the aluminum particles, in the two-phase model was computed using a drag force balance, i.e. Newton’s balance equation.
=1
2 ( − ) + Eq. 12
where , , and are the a particle mass, particle drag coefficient, particle cross-sectional area and additional body forces. The particle possible deceleration due to the adverse pressure gradient generated at the substrate surface bow shock is also taken into account and included in the term. The body force per unit mass is given as;
= ∙ ∇ Eq. 13
No other additional body forces have been added to the equation as the common gravity, lift, thermophoretic and electrostatic forces provide little influence on the particle momentum in the CGDS process.
The Henderson drag correlations, for term definition, has been used to describe the particle momentum (Ref 52). According to previous studies, the Henderson correlation, which covers a wide range of particle Mach and Reynolds numbers and describes flow motion from incompressible to free molecular regimes, has shown accurate results based on experimental particle –laden flow measurements (Ref 14,15,53–57). The transient particle heat transfer processes are calculated assuming a lumped capacitance method and the energy balance equation from the first law of thermodynamics is used (Ref 14,23,58). Details describing the terms involved in the analysis can be found in a previous study (Ref 14). The following Nusselt, , correlation has been utilized to define the convective heat transfer coefficient;
= 2 + 0.44 . . exp 0.1 + 0.872 , Eq. 14 which is valid for particle Mach numbers above 0.24. In all other cases the common Ranz-Marshall model is utilized (Ref 59). The correlation described in Eq. 14 has been shown to provide accurate particle temperature readings based on recent CGDS experimental work(Ref 14).
3.3.2 Stochastic trajectory
Since the flow is turbulent, a stochastic tracking approach, referred to as the discrete random walk (DRW) model, is applied to simulate the particle turbulent dispersion ensuring representative particle trajectories. Numerous studies conducted in the CGDS field have shown that the DRW does provide an accurate particle dispersion (Ref 41,48,51,60). DRW computes the trajectory of each particle based on the statistical sum of the mean and turbulent velocity component of the gas. In addition, an integral time scale is linked to the characteristic lifetime of an eddy. It is assumed that a particle is in contact with the turbulent eddy for whichever time is shorter between the eddy lifetime and eddy crossing time. Sufficiently large numbers of DRW runs have been used to ensure the trajectories include the statistical effect of turbulent dispersion.
3.3.3 Numerical size distribution
To model the particle size distribution for each powder set, the Rosin-Rammler distribution function has been utilized to generate proper particle size bins in ANSYS Fluent using;
= ( ⁄ ) , Eq. 15
where represents the cumulative percent retained at size and ̅ and are fitting parameters, referred to as the average diameter and spread factor. The obtained spread factor is 4.07, 13.87 and 14.33 for set 1, set 2 and set 3 respectively. Following the injection of accurate particle diameter bins, a function generating a random selection of particles in each bin size has been included to obtain the actual measured distribution.
3.3.4 Particle/ Nozzle wall interactions
In the HPCS, the powder injection line is estimated to be perfectly aligned with the nozzle axis. As the feeder tube size is the same as the nozzle throat, the particle radial acceleration and movement is limited and particle-nozzle interactions are expected to be low (Ref 49). The particle collisions are estimated to be perfectly elastic and as the particle-nozzle impact collisions are anticipated to be limited such estimation would have little effect on results if inaccurate. For the LPCS, however, significant particle/wall interactions are expected to occur due to the radial injection process. Experimental evaluation of the coefficient of restitution for impacts between metal particles and PBI material are not found in the literature. Wu et al. have investigated the rebound behavior of spheres traveling at 5m/s during elastic-plastic oblique impacts using FEM (Ref 61). Although the velocity is far below the particle velocities reached in the CGDS process, particles are expected to travel with much higher axial velocity than radial velocity due to the strong axial gas flow momentum. Based on their study, the tangential and normal coefficient of restitution are both chosen to be 0.8 in the current simulation work (Ref 49,61).
4 CFD RESULTS
The current section covers the CFD results used to assess the particle in-flight temperature, which cannot be measured (Ref 14). The heat transfer analysis and correlations used have been validated elsewhere (Ref 14). In addition, the accuracy and validity of the models for the current study have been evaluated using particle velocity measurements and single spot deposit. The CFD results are also used to visualize the flow structure and particle trajectory.
4.1 Gas flow properties
Figure 3 shows the gas velocity contour maps of both spray systems up to the substrate surface. The gas velocity along the HPCS nozzle varies gradually and reaches about 1000 m/s at the nozzle exit, with a thin boundary layer all along the nozzle length. Cross-sectional inserts reveal that the carrier gas affects the driving gas, producing a slower core at the nozzle center, although mixing seems to minimize the effects towards the nozzle exit. In comparison, the gas velocity reaches high values much earlier in the LPCS system, with similar exit velocity. The expansion of the gas at each sharp step of the LPCS nozzle generates the formation of an expansion wave/oblique shock wave system, creating an oscillatory pattern in the gas flow that maintains/replenishes a high gas velocity outside the boundary layer zone. These structures stabilize after multiple reflections due to viscous effects, homogenizing the flow profile. Furthermore, the radial carrier gas injection also affects the driving gas properties. This main flow disturbance remains following the wall boundary layer, such that the high shock trail flow appears as a dissymmetrical phenomenon. The carrier gas effect is damped after the first nozzle step.
Figure 3: 2D axial cross-sectional view of the gas flow velocity contour across the nozzle and exit region in HPCS (top) and LPCS
(bottom) systems. The gas velocity across the nozzle diameter at three selected regions ( , ) are shown in provided
inserts.
into kinetic energy. The cold carrier gas is clearly visible in r1 and r2 regions, which generates a colder central flow surrounded by the high temperature main flow. This cold core also limits the stagnation temperature in the converging section, i.e. regions c and c . In the LPCS nozzle, the oscillatory shock wave system generates local zones of very low temperature in the diverging nozzle section (-125°C in r2). The gas core exits at around 50°C, due to the low nozzle expansion ratio and with an almost uniform thermal energy distribution.
Figure 4: 2D axial cross-sectional view of the nitrogen flow temperature contour across the nozzle and atmospheric regions in high (top) and low (bottom) pressure CS systems are provided. In the HPCS, the gas temperature in the converging section is illustrated using two cross-sectional inserts ( ). The gas temperature across the nozzle diameter at three regions in the
diverging section ( , ) are shown using provided inserts for both systems.
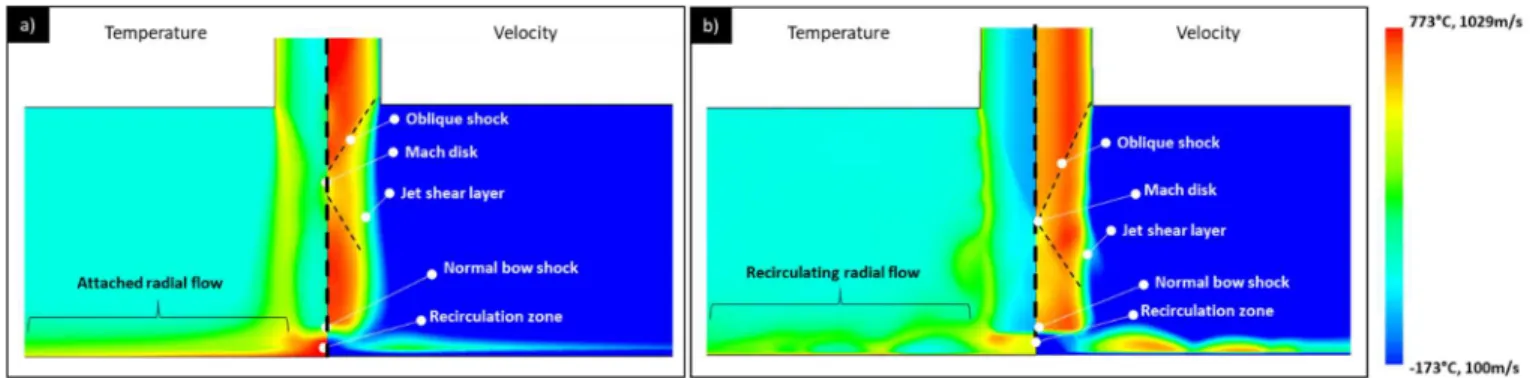
Figure 5 shows the gas temperature and velocity maps near the substrate surface for both CS systems. A normal bow shock occurs as a result of the flow adjustment to the downstream stagnation perturbation (substrate). An outward radial deflection of the primary flow follows. While this flow is attached for the LPCS configuration, it is a recirculating flow in the HPCS system, as shown in Figure 5b. This difference has been associated to the dissimilar Reynolds number (Re) that each flow reach in both systems, i.e. increasing Re have been linked to the generation of downstream wall-jet recirculation(Ref 62). The flow mechanisms controlling the wall jet features are mainly the jet-edge expansion and its reflexion from the sonic line and wall-jet boundaries (Ref 63). One can observe that while the LPCS jet reaches a stagnation temperature of 500°C in the zone under the normal shock, the HPCS jet reaches a temperature of 327°C. It is expected that these temperatures could have an effect on the substrate temperature during spraying (Ref 62,64).
Figure 5: Flow temperature and velocity at the substrate vicinity showing the radial gas flow regimes obtained in the a) LPCS and b) HPCS systems.
4.2 Effect of particle injection and size on in-flight characteristics
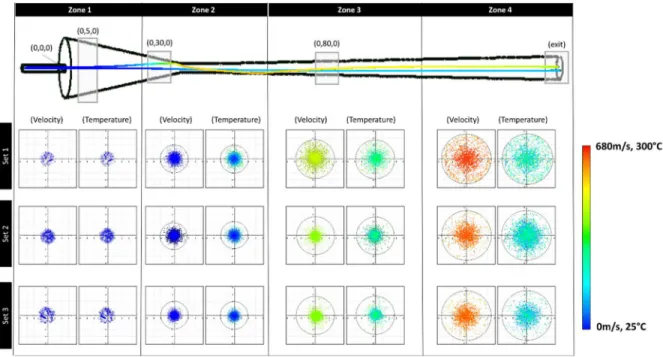
Examination of LPCS particle streak lines (only one streak line is shown as an example) reveals that all powder sets come into contact with the nozzle wall in zone 2, prior to the first nozzle step. This location corresponds to the zone shown to experience important nozzle erosion (Ref 44), confirming the accuracy of the computed particle path lines. The powder rebound path is dependent on particle size with larger particles able to recoil further towards the nozzle center and cross the shock wave trail on their path from the wall to the center due to their higher inertia. This is reflected in the particle distribution in the velocity/temperature maps presented in Figure 6. In addition, smaller particles are seen to accelerate and decelerate faster in the stream center and shear layer respectively. Hence, set 1 particles reach velocities up to 680m/s at the nozzle exit while powder set 3 reaches 620m/s. Analogously, smaller particles heat transfer rate is larger than that of larger particles due to their larger specific surface. Although the particle temperature is seen to slightly increase in the high temperature shear layer at the nozzle wall, larger increase for smaller particles, their limited time in the wall boundary combined with fast velocities and trajectory in the cold central supersonic gas stream only permits slight increase in temperature. At the nozzle exit, particles from set 1, set 2 and set 3 reach temperature up to 72°C, 58°C and 41°C respectively.
Figure 6: LPCS particle velocity and temperature from near powder injection location to nozzle exit. Particle radial distribution and spatial temperature and velocity at different locations are provided, i.e. 35mm (zone 1), 65mm (zone 2), 115mm (zone 3)
and 147mm (zone 4) with respect to the provided origin (0,0) position. A single in-flight velocity streak line of a 40µm particle is
depicted to demonstrate the effect of nozzle impact on the particle overall momentum.
Figure 7 shows the particle characteristics and overall spread in the HPCS. The high symmetry footprint of particle dispersion is attributed to the injection alignment with the nozzle. From zone 1 to zone 2, the particle stream widens due to the presence of turbulence and low gas velocity in the gas mixing area. Smaller particle having less inertia contribute mostly to the radial dispersion. However, from zone 2 to zone 4, the presence of the narrow throat and higher gas central velocity confines the majority of particles in the nozzle center. At the nozzle exit stream center, particle set 1 reaches velocities up to 690m/s while set 3 particles are accelerated up to 625m/s. Smaller particles are heated to a higher temperature as their spread towards the nozzle wall is more pronounced in the converging gas mixing area in zone 2. Analogously, colder particles at the exit of the nozzle originate from a mixture of cold particles coming from the cold un-mixed converging-throat center and from radially dispersed particles traveling in the cold slow diverging flow. As a result, set 1, 2 and 3 feedstock powder particles reach a wide spread of in-flight temperatures with values reaching 327°C, 227°C and 202°C respectively, at the nozzle exit.
Figure 7: HPCS particle velocity and temperature from powder injection to nozzle exit. Particle radial distribution and spatial temperature/velocity at different locations are provided, i.e. 5mm (zone 1), 30mm (zone 2), 80mm (zone 3) and 172.5mm (zone 4) with respect to the provided origin (0,0) location. Two particle streak lines, i.e. central cold and hot spread of a 40µm particle
is depicted to show the influence of particle spreading in the sonic zone on the in-flight particle exit temperature.
In addition, for the three powder size sets, it was found that the bow shock and the 15 mm particle flow distance from the nozzle exit do not drastically affect the particle in-flight characteristics.
In order to validate the model predictions and ensure particle temperatures can be inferred adequately from the model, particle velocity measurements were conducted at the center of the gas stream, and at distance of 15 mm from the nozzle exit, using feedstock powder set 2. The measurements provided average particle velocities of 668 m/s and 660 m/s for the HPCS and LPCS systems respectively. In addition, the numerical average particle velocities obtained at the same location generated average velocities of 620m/s and 600m/s for the HPCS and LPCS system respectively. This agreement between experimental and numerical results provides some reliability of the simulations and its additional use in finding particle in-flight characteristics. Consequently, as both systems provided similar particle impact velocities, it is assumed that all results can be properly compared for each powder set between the two CS systems.
5.2 Deposition efficiency
Figure 8 shows the DE of all deposited aluminum coatings in the current study. For coatings produced with low particle impact temperature (LPIT) using the LPCS system, the DE is low and the particle size noticeably affects it. The feedstock powder set 1 is almost double the DE values obtained for powder set 2 and set 3, i.e. 13% vs ~5%. Figure 8 also shows that the CS gun traverse speed has minor influence on the measured DE. A significant improvement in DE is recorded when particle impact temperature is increased with average DEs of 81%, 76% and 57% for powder sets 1, 2 and 3 respectively, which shows a decrease with particle size increase. Finally, the substrate surface roughness, affecting primarily the deposition of the first layer of particles, does not influence the DE in all sprays. The sudden drop in DE of the high particle impact temperature (HPIT), generated using the HPCS system, feedstock set 1 onto the grit blasted sample is believed to be caused due to inconsistent powder feeding resulting from local clogging/deposition inside the nozzle.
Figure 8: Coating DE for various particle size range (sets) and substrate surface roughness deposited using both LPIT and HPIT depositions. Data shown as solid fill represents deposits made on polished surfaces while patterns filled data correspond to deposits made on grit blasted substrates. Superimposed dashed columns in the LPIT represent the DE for coatings sprayed at a
Figure 9 shows the top surface of the produced coatings using both LPIT and HPIT depositions illustrating the effect of different impact dynamics occurring due to particle size and particle impact temperature. LPIT deposits exhibit much smoother coating surfaces as the particles are more deformed, and this effect is enhanced with increasing particle size. The coating top surface features for LPIT depositions generated under both traverse speeds are the same such that only one is shown for conciseness. The top surface of HPIT coatings show minimal particle deformation, as shown in Figure 9b, d and f.
Figure 9: Coating top surface topography after spray illustrating the contrast in impingement phenomena when utilising low (left) and high (right) particle in-flight temperatures for powder (a-b) set 1, (c-d) set 2 and (e-f) set 3.
5.3 Coating adhesion strength
Figure 10 shows the coatings adhesion/cohesion strength for all sprayed cases. The substrate surface roughness generated using a grit blasting process induces a low adhesion strength irrespectively of particle impact temperature and size. The average adhesion strength on grit blasted surfaces for both low and high particle impact temperatures is 10.9±4.5MPa. Similar adhesion strength values have been observed in a previous work with irregularly shaped pure aluminum powder material (Ref 5).
An increase in coating adhesion strength is observed with the increase of particle diameter for LPIT deposits. The average value increases from 34.8MPa to 71.7MPa for set 1 to set 3 powder size sets. The CS nozzle traverse speed for LPIT sprays shows minor influence on the general bond strength trend across
size increase for the case of HPIT sprays, from 71.2MPa to 32.3MPa for set 3 and set 1 respectively. This trend is the opposite of the one observed for LPIT.
Figure 10: Coating adhesion/cohesion strength based on particle size (sets 1-3) and substrate roughness for sprays generated using low and high particle impact temperatures. The box shows the position of the 25thpercentile, median and 75thpercentile.
Whisker lines illustrate the data variability outside the upper and lower quartiles while the ‘x’ marker displays the mean data value. The minimum and maximum value exclude outliers.
Fracture surface topologies of the pull test set have also been obtained for deposits made on polished surfaces, as shown in Figure 11, to characterize the phenomena responsible for coating failure. Imaging of grit blasted surfaces fracture surface topologies was omitted due to the coating consistent low adhesion stress failure. The fracture topology imaging describes the fracture zones by providing the failure location inside the layered pull test set, i.e. glue, coating (cohesion) and/or substrate/coating (adhesion).
Complete coating separation at the interface is detected for all sets sprayed using LPIT at a traverse speed of 10mm/s, as shown in Figure 11(a-c). The coatings, irrespective of particle size and unrelatedly to the recorded bond strength, fail in complete adhesion. As shown in Figure 11 (a-c), the substrates surfaces after adhesion tests retained their mirror finish polish i.e. observable through the reflective surface feature, indicating that the recorded adhesion failures primarily involve metallic bonding and lack mechanical anchoring. Coatings sprayed at LPIT and at a traverse speed of 150mm/s display a similar complete coating separation from the substrate surface, with limited residual aluminum particles, for powder set 1. However, local adhesion fracture is observed for powder set 2-3, as seen in Figure 11e-f. Finally, localised irregular adhesion fracture is seen for coatings deposit with HPIT, as depicted in Figure 11g) and Figure 11h). Powder set 3, however, characterized with the lowest bond strength, failed in a mixed adhesion/cohesion process. This rupture nature is observed on the entire substrate surface, which excludes distinctive localized fracture developments.
Figure 11: Representative failure features after pull test of the substrate side only. For each case, the right image shows the actual state of the coated substrate surface after pull test while the left provides distinction between different zones on the same substrate side using a color code, which is defined in the legend. The resulting strength at failure for each shown case (and corresponding particle size set) is a) 40MPa (38-45µm), b) 68MPa (53-63 µm) and c) 74MPa (63-75 µm), d) 45MPa (38-45µm), e) 67MPa (53-63 µm) and f) 72MPa (63-75 µm), g) 70MPa (38-45µm), h) 65MPa (53-63 µm), i) 49MPa (63-75 µm). Dotted lines
delineate zones of protruding coating.
5.4 Bend-to-break tests and fractography
As shown in Figure 12a, coatings generated using LPIT sustain large deformations prior to crack initiation and eventual full propagation, suggesting high apparent ductility. Prior to failure, tested coatings had to be bent multiple times to initiate fracture. HPIT coatings, on the other hand, broke abruptly, as shown in Figure 12b-c, with limited crack deflection and at restricted curvature.
Figure 12: SE SEM images of coatings during the bend-to-break process using feedstock powder set 2 with a) LPIT deposits showing no sign of cracking during the first phase of the bend-to-break test and b-c) HPIT deposits. A fracture surface from the
HPIT coating is highlighted in image c).
particle network, enhanced particle to particle contact and fish scale particle-particle architectural arrangement and some level of intra-particle fracture. For the HPIT samples, the fracture surfaces exhibit a prevailing inter-particle crack propagation route, leading to a smooth path characteristic of the highly noticeable spherical particle geometry.
Figure 13: Fracture surfaces from the bend-to-break tests for coatings generated with low (left) and high (right) particle impact temperatures. Shown coatings correspond to (a-b) set 1, (c-d) set 2 and (e-f) set 3. Blue arrows point to zones of inter-particle
6 ANALYSIS AND DISCUSSION
The current section provides a detailed analysis of the numerical and experimental results to associate generated coating properties and characteristics to particle impact temperature and size. A deeper look into the numerical work offers a statistical view of particle impact characteristics, dependent on flow trajectory and size, necessary for successful deposition and improved adhesion.
6.1 Deposition Efficiency and Critical Velocity (VC)
The influence of particle impact temperature and size as well as substrate state on DE and VCare presented in the current sub-section.
6.1.1 Particle temperature influence
It is seen from Figure 6 and Figure 7 that the spray parameters and nozzle configurations used allowed reaching LPITs (around 50°C) and HPITs (above 200°C) for similar particle impact velocity, for each feedstock powder set. This increase in particle temperature facilitates dislocation motion such as climbing and cross-slip, enabling dislocation-based material softening, enhancing particle deformation, increasing local heating, with potentially larger interfacial regions reaching 0.5Tmelting due to the conversion of kinetic energy into heat during the impact process and improving oxide layer fracture and removal processes (Ref 36,37,65). Altogether, these effects increase the fresh metal surface contact available for bonding and decrease VC(Ref 37,39), which results in the increase of DE for high particle impact temperature cases, seen in Figure 8, for the three feedstock sets compared to the cases of LPIT.
Detailed analysis of the data from Figures 6 and 7 allows generating a statistical particle velocity distribution for each tested case, shown in Figure 14. To capture the actual powder size distribution, particles have been selected randomly from each size range following the measured number distribution percentage. A total of 10000 particles have, thus, been used for each analyzed powder set.
Figure 14: Model results of particle velocity distribution and cumulative sum at the nozzle exit for 10000 representative particles from a) set 1, b) set 2 and c) set 3. Top and bottom row refer to deposits generated with LPIT and HPIT respectively. In black:
particles traveling above the LPIT VC. In green: additional particles traveling at HPIT VC. In blue: particles travelling below
respective VC. VCare evaluated based on experimental DE measurements. Corresponding numerical VCand DEs are indicated for
each powder set.
The results show similar overall particle velocity distribution trends and average particle velocity between both particle impact temperatures for all three sets of powders. The VCvalues for each case have been obtained from the Figure 14 data by grouping fastest particles together until their amount percentage over the overall particle population matched the measured DE (Ref 36). The slowest particle velocity in these grouped particle population was chosen as the corresponding VC of the studied powder set. Figure 14 highlights, i.e. in black and green, all particles traveling faster than the critical velocity evaluated for each case, while Table 4 summarizes the obtained VC values. The increase of particle impact temperature results in a decrease of VC for each powder set, as suggested by theoretical models that predict a decrease in VCas particle impact temperature increases (Ref 66).
Table 4: VC for all three powder sets and both low and high particle impact temperature.
Powder size Set 1( = ) Set 2( = ) Set 3( = )
LPIT 637m/s 604m/s 582m/s
HPIT 593m/s 568m/s 561m/s
6.1.2 Particle size effect
The particle native oxide layer thickness and oxide content can influence VC and thus DE. The thicker the oxide layer, the more kinetic energy is required to break and remove this shell, reducing the energy available for particle and substrate plastic deformations that lead to bonding. Particle oxygen content was detected through inert gas fusion method for the current particle sets. Assuming that the oxygen content is solely associated to the surface oxide, it was found that this layer decreased from 15.4±3.3nm for powder set 1 to 10.2±2.8nm for particle set 3 (Ref 67), which can also be used to partially explain the VC observed reduction with particle size. If the oxygen content originates from oxygen inclusions present at grain boundaries, it is expected that the oxide-dispersion strengthening process during deformation will be of less consequence for larger particle size due to the lower oxide concentration in larger particle volumes, leading again to a lower VCas particle size increases. This size dependent influence on VC is more easily demonstrated for LPIT as the impact temperature remains low and almost constant for the three particle set, thus only the diameter is changed. It is observed that particle VCdecreases with increasing particle size.
Figure 8 shows that the measured DE of all coatings decreases with particle size. As particle size increases, Figure 14 shows that the velocity distribution shifts towards slower speeds, following approximately the relation ∝ ⁄ given between particle velocity vs particle diameter (Ref 67). This results in lower DE despite the reduction of VCassociated with larger particle size as the particle impact velocity decreases more rapidly than its VC.
6.1.3 Substrate surface state influence
The substrate surface roughness, which mostly affects the first layer of deposited material, shows no influence/trend on measured DE, as presented in Figure 8. If any, the effects, which would take place only at the interface between the first particle layer and substrate, are being suppressed by the overall averaging process involved in DE measurement. Analogously, the VCdetermined from Figure 14 is almost inclusively the VC amongst the CS aluminum particle layers, which also disregards the influence of substrate surface properties. However, due to the harder nature of the steel substrate in comparison to the CS aluminum, the VCvalues of the first impinging particles are expected to be lower than the reported numerical values in the current study (Ref 9,68).
Temperature
The substrate temperature in the current study has been indirectly varied by adjusting the gun traverse speed in the LPCS system to induce varying gas/substrate impact interaction times. Based on obtained results shown in Figure 8, the substrate temperature shows no significant influence on measured DE. This can be associated to the DE measurement averaging process and/or limited instant local surface temperature rise the change in gun traverse speed generates and/or restricted heat transfer processes it produces across the interface. As the most probable and substantial cause is related to the DE measurement process, actual local temperature effects can be present. If any, the effects of temperature rise, through gun traverse speed modifications, on VC are twofold. A temperature rise can enhance substrate deformation during impact, which can promote proper substrate oxide fracture and removal resulting in a decrease of VC. In addition, the increase in temperature and extended jet time from decreased gun traverse speed can also improve surface cleaning processes i.e. organic debris, permitting fresh-metal contact for eventual bonding. On the other hand, substrate surface temperature rise can likewise increase VCfrom possible substrate oxide scale growth during the cooling process within the atmospheric environment occurring once the hot supersonic nitrogen stream leaves the substrate surface. As the growth of an oxide scale has a direct measureable impact on adhesion, this possible influence of temperature will be verified and discussed in the next section.
6.2 Adhesion strength
While the DE and VC can simply be defined based on a binary ‘’successful vs unsuccessful’’ deposition criteria, the coating properties such as adhesion strength account for the variety of particle impact characteristics. This is particularly the case for the HPIT cases in which a large population of particles with different impact characteristics achieve successful deposition while only a limited collection does deposit in the case of LPIT as revealed by the lower DE. This breadth of particle impact characteristics are expected to affect the coating overall structure and adhesion.
The particle impact characteristics variance is presented in Figure 15, which illustrates the particle population at the nozzle exit reaching speeds above VC, from the particle streak results presented in section 4.2. One can observe that the particles spread for the LPIT case corresponds well with the experimental single spot sprays (nozzle not moving) included in Figure 15a and Figure 15c for set 1 and set 3 respectively. This dispersion confirms the departure of particle distribution from stream symmetry and attests skewed particle size dependent trajectory. In the HPIT cases, the particle spread includes a clear high particle concentration at the nozzle center and a gradual decrease in particle stream density following a Gaussian-like distribution, as most commonly observed in CS depositions (Ref 69). In addition
Figure 15: Particle spread colored based on local particle velocity (top) and temperature (bottom) for the low (left) and high (right) particle impact temperature deposits, and for a) set 1, b) set 2 and c) set3. Particle individual size, within each set, is illustrated by varying the representative dot dimensions. The powder injection in the LPCS is oriented from the negative-x axis towards the origin as demonstrated by the included arrows. Inserts of experimental LPCS spot spray deposits are incorporated to
6.2.1 Particle temperature effect
For a set particle diameter, VCcan vary significantly as the impact particle temperature can fluctuate from one particle to another based on their in-flight history. To relate particle impact characteristics to the inherent individual particle VC, the following expression is used for material impacting on the same material (Ref 70);
= − + 16 − 293− Eq. 16
where is the particle melting temperature, is the particle impact temperature, σ is the tensile strength of the particle material at 293K, is a particle size-dependent fitting parameter and is the specific heat of the particle material. To find the size-dependent dimensionless fitting parameter, , the LPIT characteristics have been utilized as their temperature has been found to be very similar for all size range. The term has been taken as the average particle exit temperature and VCas the numerically calculated VCof each powder set. The resulting particle size dependent fitting parameters are 0.56, 0.59 and 0.62 for powder sets 1, 2 and 3 respectively, which fits within the range anticipated during the development of Eq.14 (Ref 70).
Using these values of , the dimensionless parameter η=V/VCis used to qualitatively evaluate the extent at which each particle exceeds its inherent VCfor each deposited feedstock set and for both LPIT and HPIT cases. The results are outlined in Figure 16 using a box and whisker plot in which the quartile calculation excludes the median and upper outliers. For particles impacting on the same material, larger η values would lead to larger adhesion/cohesion strengths (Ref 70), but this is not always the case for the adhesion of dissimilar materials (Ref 71). In the current work, since all studied conditions generate a minor substrate deformation compared to the particle, the provided trends in Figure 16 are considered representative. However, no quantitative significance is given to values of η as the overall influence of substrate nature on deposition is disregarded in both the current calculated VCvalues and Eq.14.
Figure 16: Particle η=V/VC, calculatedfor all three sets of feedstock powder for varying particle in-flight temperature. The minimum and maximum value exclude outliers.
One can observe that for the same feedstock set and for both LPIT and HPIT cases, the average value of η is slightly larger for the latter case, as a result of the increased particle impact temperature. One should expect the HPIT cases to exhibit larger adhesion/cohesion strengths than their low particle temperature counterparts that were sprayed at the same impact velocity but lower η. Although only the effect on cohesion has been recorded through powder set 3 measured strength, it is expected that both powders set 1 and set 2 follow the trend despite the glue failure and consequently unknown actual adhesion strength.
However, this expected trend is not observed. This suggest that the adhesion strength might be governed by other factors than solely on those included in the η parameter. It is envisioned that the extensive in-situ hammering as a result of low DE for the LPIT cases must govern the adhesion/cohesion results for these three sets. Bouncing off particles provide significant in-situ hammering/shot peening to increase the deformation of deposited particles, improve the oxide film removal through shear and enhance interfacial fresh metal contact pressure of particles adhered to the substrate surface, all of which are considered factors contributing to adhesion. The results also suggest a particle impact temperature threshold under which impingement becomes the primary factor governing adhesion/cohesion strength.
6.2.2 Particle size effect
For the LPIT cases, an increase in bonding strength with an increase in particle size is observed and is associated primarily to the decrease of DE with particle size, which enhances the impingement effect as previously explained. In addition, the slower cooling rates associated with larger particles following deposition can lessen thermal stresses and shrinkage related local in-situ de-bonding processes, favoring developments and subsistence of atomic bonding (Ref 72). For the HPIT cases, the influence of particle size on adhesion is associated to both the particle size dependent impact temperature and velocity. As observed in Figure 15, a decrease in particle size leads to an important drop in temperature and velocity distribution, which together lower the particle population capable of exceeding velocities well above their VC, i.e. reduced η, and thus explaining the reduction in adhesion with particle size. Analogously, the inter-particle cohesion strength is also expected to decrease with decreasing η values, which is shown to occur in the current study as the coating fracture mode shifts from adhesion (set 1 and set 2) to a mixture of cohesion/adhesion (set 3) with increasing size, as shown in Figure 11 (g-h-i).
6.2.3 Substrate surface state influence
Roughness
The coating adhesion strength of LPIT cases on grit blasted surfaces, as presented in Figure 10, is associated to the substrate topography influence on particle deformation. The roughened surface restricts material flow localization, heat generation and contact pressure, which deprives the interface of processes required for the generation of strong metallic bonds (Ref 73). In addition, rough surface profiles can trap disrupted oxide film residues serving directly as a barrier to fresh-metal contact (Ref 73). Since the same adhesion trend is observed for the HPIT cases, it can be hypothesized that the η parameter values reached in the current study are insufficient to alter the contact processes. Provided that the adhesion values fall below 20MPa, the coating connection onto the substrate results predominantly, if not entirely, from mechanical anchoring (Ref 73).
Temperature
In the LPIT deposits, the powder set 1 and set 2 minor adhesion decline as the traverse speed is decreased to 10 mm/s, might be associated to an oxide scale growth process rendering direct fresh metal contact difficult. As discussed in section 6.1.3, the oxide growth can result from the substrate surface exposure to the environment after being heating by the impacting supersonic gas flow at low traverse speed. This oxide film influence is inclined to be more noticeable for smaller particle size as they travel at lower alongside an initially larger native oxide film. On the other hand, since the HPIT deposits have been generated at the highest gun traverse speed, i.e. 150mm/s, and that the observed wall jet radial flow and recirculating stagnation zone are found to be at much colder temperatures than in the LPCS system, it is evident that the substrate temperature effects, if any, are diminished. Consequently, all measured coating bonding strength outcomes reflect predominantly the exposed particle characteristics influence on adhesion, which is also in agreement with the previously proposed conclusions provided in section 6.2.1.
6.2.4 Crack propagation mechanisms
Although LPIT deposits sprayed at 10 mm/s and 150 mm/s undergo similar in-situ peening processes and reach overall comparable bonding/failure strengths, they undergo dissimilar fracture processes, as shown in Figure 11. Due to the low DE under which both coatings are deposited, general microstructural features such as pancake-like particle-particle deformation, presence of mechanical anchoring at particle junctions and intermingled particle splat contact area are expected to exist in both deposits. Neglecting impact associated recrystallisation feature dissimilarities, the different fracture processes can be linked to the dissimilar thermal history/in-situ annealing associated with gun traverse speed and to the different number of deposit layers utilized. Lack of a complete microstructural evaluation, however, restricts the confirmation of the exact impact related phenomena that lead to the dissimilar fracture surfaces in both LPIT depositions.
For the HPIT cases, the limited in-situ peening process inherent to the high DE restricts particle deformation as observed in Figure 9. The coating cohesion failure, recorded for powder set 3 and shown in Figure 11i confirms the significance of particle-particle boundary characteristics, associated to the η value under which deposition occurs, and the presence of preferable low energy crack propagation paths on coating strength and effective properties. Powder set 1 and set 2 exhibit increased particle-particle cohesion strength due to their depositions under larger η parameter, resulting in a localized coating fracture rather than a cohesive failure or full adhesion separation.
6.3 Bend-to-break tests
The improved apparent ductility of the LPIT coatings, observed in Figure 12a, can be attributed to the presence of crack propagation annihilation, crack deflection mechanisms and/or particle-particle fish scale structural effect (Ref 74) serving to distribute the load, mitigate stress concentration and provide pseudo-plasticity, i.e. deformation facilitated by particle boundary sliding (Ref 74,75). These mechanisms related to the particle microstructural arrangement resulting from the high level of in-situ peening, lead to the irregular fracture surface depicted in Figure 13.
For the HPIT coatings, despite the larger η values compared to the LPIT deposits, the reduced apparent ductility and brittle fracture occurring during the bend-to-break tests, as shown in Figure 12b-c, are
propagates along the easiest low-energy route, existing porosity and microcracks may all lead to premature fracture of the tested samples. The fracture surface of a fast growing and propagating crack, in a particle network, theoretically shows limited material deformation and fragmentation, original particle surface features and overall low coating bending ability, which is observed in the fracture surfaces of Figure 13.
7 CONCLUSIONS
The current work studied the influence of pure aluminum particle in-flight temperature, i.e. colder vs warmer particles, for a given particle size, on steel substrate cold spray deposition and coating properties, using both experimental and modeling results. The following conclusions are drawn:
For sprays characterized by colder particle impact temperature
1. The DE is low (below 10%) for all particle size ranges, as most particles do not experience sufficient deformation upon impact with the substrate to achieve bonding. The DE decreases with increasing particle size as the reduction of their impact velocity is not compensated by the decrease of their critical velocity.
2. The coating adhesion strength increases drastically with particle size, under constant depositions, as a result of the severe in-situ hammering processes induced by decreasing DE with particle size.
3. The in-situ shot-peening also lead to the formation of important fish scale effect, which provide the coating with pseudoplasticity and apparent ductility.
For sprays characterized by warmer particle impact temperature
1. The DE is large (above 60%) due to sufficient particle deformation upon impact with the substrate, promoted by the warmer particle impact temperature. The DE decreases with particle size as their decrease in impact velocity is not counterbalanced by their decline in critical velocity.
2. The coating adhesion/cohesion strength decreases with particle size and is governed by the non-dimensional parameter . Despite their intrinsically increasing VC, smaller particles reach much higher impact temperatures, which sufficiently decreases their VC, and much higher impact velocity from their lower mass. With increasing particle size and constant gas stagnation parameters, larger particle are inherently heated to lower temperatures, which are sufficient to increase DE but observed to be detrimental for cohesion processes.
3. Higher particle cohesion related to high values limit fish-scale like effects during deformation. However, the high level of defects (porosity, unbonded areas) lead to brittle-like fracture characterized by a straight crack trajectory.
8 ACKOWLEDGEMENTS
The authors would like to acknowledge the work of the technical officer’s team in Boucherville: K. Bricault, F. Belval, P. Dionne and C. Hoang.