Data Driven Manufacturing Risk Assessment for
Turbine Engine Programs
by
Sagar P. Yadama
Submitted to the Department of Mechanical Engineering and MIT
Sloan School of Management
in partial fulfillment of the requirements for the degree of
Master of Science in Mechanical Engineering
at the
MASSACHUSETTS INSTITUTE OF TECHNOLOGY
May 2020
c
○ Sagar Pandey Yadama 2020. All rights reserved.
The author hereby grants MIT permission to reproduce and distribute
publicly paper and electronic copies of this thesis document in whole or
in part in any medium now known or hereafter created.
Author . . . .
Department of Mechanical Engineering and MIT Sloan School of
Management
May 8, 2020
Certified by . . . .
David Hardt
Professor, Mechanical Engineering
Thesis Supervisor
Certified by . . . .
Roy E. Welsch
Professor, Operations Research
Thesis Supervisor
Accepted by . . . .
Maura Herson
Assistant Dean, MBA Program, Sloan School of Management
Accepted by . . . .
Nicolas Hadjiconstantinou
Chairman, Mechanical Engineering Graduate Committee
Data Driven Manufacturing Risk Assessment for Turbine
Engine Programs
by
Sagar P. Yadama
Submitted to the Department of Mechanical Engineering and MIT Sloan School of Management
on May 8, 2020, in partial fulfillment of the requirements for the degree of
Master of Science in Mechanical Engineering
Abstract
Waste and uncertainty can be managed at all levels of a production process from a program level down to a single step in a manufacturing cell, and is done by assess-ing risk. Risk is defined as uncertainty in the ability to deliver the final product of a manufacturing process. The standard method for evaluating risk in aerospace is Manufacturing Readiness Level (MRL). However, these methods were developed for previous generations of turbine engines, and do not represent the capabilities of a modern manufacturing environment. The MRL process for managing overall manu-facturing efficiency of an engine program is highly qualitative, and based on leveraging industry knowledge. The process requires experienced team members to implement, is highly time intensive, and is disconnected from the quantitative metrics that drive performance in the rest of the organization. In an effort to revamp the manufacturing risk assessment process for new turbine engine programs, Pratt & Whitney seeks to develop a standardized data driven risk assessment process to improve the accuracy and accessibility of risk management.
This thesis develops a data driven risk assessment process to provide quantitative validation for the legacy risk evaluation method. Cost, quality, and delivery opera-tions metrics are collected and analyzed to build a comprehensive measure of risk for each part in a turbine engine program that can be aggregated to determine total risk for the entire program. In three phases, this project addresses three key challenges faced by the risk management team while also building a comprehensive risk analysis process accessible to anyone in the production hierarchy.
Phase one addresses automated identification of operations critical parts in an engine program resulting in complexity reduction of over 80%. Phase two focuses on development of an automated risk visualization dashboard that collects critical operations metrics into a central source and computes a comprehensive risk value for each part in the engine program. Phase three is the construction of standard risk mitigation management tools to transform output of the risk dashboard into useful information for individual manufacturing teams. Ultimately, this research shows that
development of standard processes and tools for identifying, analyzing, and mitigating production risk using real time operations data significantly enhances the ability of management and manufacturing teams to understand and mitigate uncertainty in final engine delivery.
Thesis Supervisor: David Hardt
Title: Professor, Mechanical Engineering Thesis Supervisor: Roy E. Welsch
Acknowledgments
This thesis was developed from a six-month research fellowship done at Pratt & Whitney in East Hartford, CT. The support of the Operations organization and Manufacturing Readiness Level team made this experience highly productive and enjoyable. I truly appreciate the opportunity to apply teachings from LGO in such a dynamic environment with a dedicated team of talented engineers.
I want to thank the sponsor of this project and VP of Operational Excellence, Dave Parry, for constructing and championing this opportunity. To Praba Baptist for providing high level guidance and executive support to this project. To my supervisor, Jason Cote, for his diligent mentorship and for working with me in any capacity to make sure this project was a success. To the MRL team: Daisy Susaya, Sam Lagana, Michele Burnat, Keith Macht, Melissa Malasmas, and others for working closely with me to develop the outputs of this project. To Sean Fitzgerald and his team for providing excellent data analytics support and advice. To LaWanda Scott and others in the cost organization for meeting with me week after week to provide data and guidance. To Travis Gacewski and Kevin Thomas for their help in making the most of the internship process within Pratt & Whitney as well as their candid mentorship regarding life after LGO.
To my thesis advisors, David Hardt and Roy Welsch for their time meeting, visit-ing, and advising me in both thesis and life matters. To Thomas Roemer, Ted Equi, and the rest of the LGO staff for their unyielding support and help to ensure my success in this MS/MBA program. I am grateful for this opportunity to learn and apply operations analytics techniques in a rigorous manufacturing environment. To my fellow classmates in the LGO class of 2020 for their friendship and making the last two years some of the best years of my life. To my parents, Gautam Yadama and Shanta Pandey, and my sister, Aishwarya Yadama, for their consistent encour-agement, guidance, and advice. Finally, I would like to thank my girlfriend, Aditi Ramachandran, for her unwavering support and sacrifice to help me get to this point.
Contents
1 Introduction 17
1.1 Problem Statement and Motivation . . . 17
1.2 Hypothesis . . . 19
1.3 Research Methodology . . . 19
1.4 Scope and Limitations . . . 20
1.5 Thesis Outline . . . 20
2 Company Overview 23 2.1 Company Background . . . 23
2.2 Three Lens Analysis of the Operations Organization . . . 25
2.2.1 Strategic Design Lens . . . 25
2.2.2 Cultural Lens . . . 26
2.2.3 Political Lens . . . 27
3 Literature Review 29 3.1 Lean Manufacturing . . . 29
3.2 Readiness . . . 31
3.2.1 Technology Readiness Level . . . 31
3.2.2 Manufacturing Readiness Level . . . 32
3.3 Manufacturing Risk Assessment . . . 33
3.4 Learning Curve . . . 35
3.4.1 Calculating the Learning Curve . . . 35
3.5 Summary . . . 38
4 Project Context 39 4.1 Timeline of Quantitative Risk Assessment Implementation . . . 39
4.2 MRL Team . . . 40
4.2.1 Responsibilities and Value Proposition . . . 41
4.2.2 Current Major Efforts . . . 42
4.2.3 Engagement with this Project . . . 44
4.3 Key Hurdles in Qualitative Risk Assessment . . . 44
4.3.1 Hurdle 1: Which Parts to Assess? . . . 45
4.3.2 Hurdle 2: Data Collection and Comparison . . . 46
4.3.3 Hurdle 3: Risk Analysis and Implementation . . . 47
4.4 Integration with IT Systems . . . 48
5 Data Analysis and Methods 49 5.1 Phase 1: Operations Critical Bill of Materials . . . 49
5.1.1 BOM Data Sources . . . 50
5.1.2 Development of Ops-BOM Rules . . . 51
5.1.3 Automated Ops-BOM Tool . . . 56
5.2 Phase 2: Quantitative Risk Analysis . . . 56
5.2.1 Key Operations Metrics . . . 57
5.2.2 Connecting Data Sources . . . 58
5.2.3 Calculating Risk Impact . . . 59
5.3 Phase 3: Risk Mitigation . . . 63
6 Results and Discussion 65 6.1 Operations BOM . . . 66
6.2 Risk Assessment Dashboard . . . 69
6.3 Risk Mitigation Tool . . . 74
6.4 Future Work . . . 78
List of Figures
1-1 Root cause analysis for unreported risk on GTF program. Issues with manufacturing during first wave of GTF engines were documented and traced down to determine root cause in Operations organization. The colored boxes document common causes that contributed to program level setbacks. This thesis addresses lack of equal standard work quality across all processes, separation from performance metrics, and lack of a program level risk assessment. . . 18 3-1 Methodology for assessing leanness in the manufacturing process. Lean
manufacturing sub-groups are analyzed individually using quantitative performance metrics tailored to each sub-group. A leanness level is determined for each sub-group representing the amount of leanness contributed by that group. Leanness of each sub-group is aggregated to derive an overall leanness level of the whole process. . . 30 3-2 General risk management process vs. Integrative risk management
framework. Legacy risk management process shown on the left utilizes industry expertise in a linear process of identifying and assessing risk. Integrative framework is data driven and iterative. Output data feeds back into risk assessment model to drive continuous improvement. . . 34 3-3 Log-linear learning curves at various learning rates. At larger rates of
learning, the risk decreases more for each unit produced. The industry standard learning rate for aerospace is 85%, meaning each additional unit produced should incur 15% less risk than the last. . . 37
4-1 Issues and actions identified during the MRL reset effort. Four main ares of improvement were identified for the MRL team: standardization of risk assessment tools, integration of MRL into existing processes, development of MRL training, and enforcement of MRL requirements. This thesis addressed standardization of tools and integration of MRL with quantitative metrics. . . 42
4-2 Progression and advancement of generations of manufacturing assess-ment methods at Pratt & Whitney. Risk assessassess-ment methodology has historically evolved according to changing needs and capabilities at Pratt & Whitney. The Third Generation process developed by this thesis leverages new data collection and analysis capabilities to make risk assessments more quantitative and accessible. . . 43
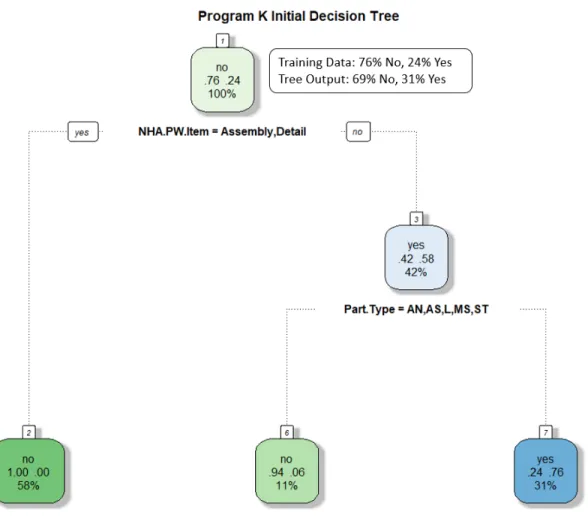
5-1 Program K decision tree for generation of Ops-BOM. The manually sorted training set identified 24% of the EBOM parts as critical for risk assessment. The automated attribute-based sorting method described by this tree resulted in capturing 31% of the EBOM. Two key attributes were identified: Item-Type of Next Higher Assembly and Part Type. . 53
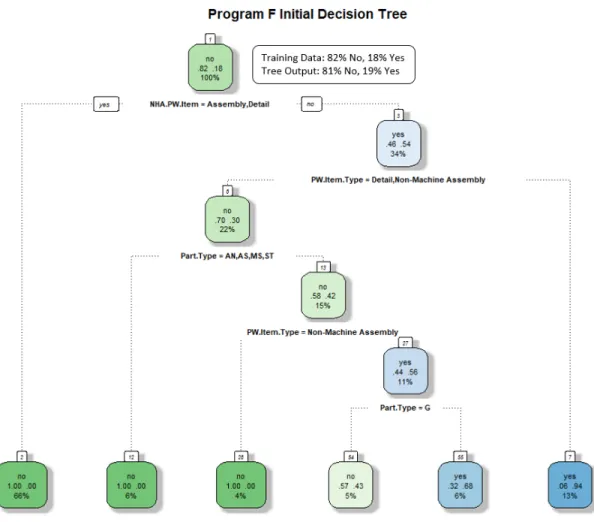
5-2 Program F decision tree for genereation of Ops-BOMM. The manually sorted training set identified 18% of the EBOM parts as critical for risk assessment. The automated attribute-based sorting method de-scribed by this tree resulting in capturing 19% of the EBOM. Three key attributes were identified: Item-Type of Next Higher Assembly, Item-Type of Subject Part, and Part-Type. . . 54
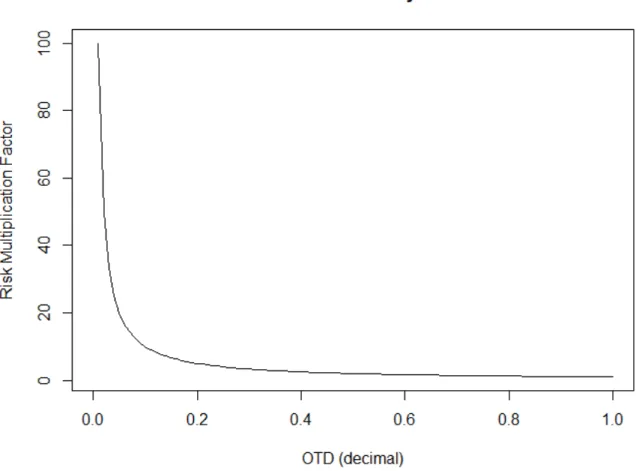
5-3 Information flow diagram of current system and the data driven risk analysis process. Cost, quality, and delivery metrics are currently con-sidered separately, and not integrated into MRL assessment process. Metrics are described in different units and hard to compare result-ing in high variability risk assessment results. The proposed solution is to integrate collection and analysis of operations metrics with each other and the MRL assessment to drive consistency and quantitative validation in the risk assessment process. . . 60 5-4 Inverse relationship between risk and OTD with delivery as a
nor-malization variable. As OTD approaches 0, Risk approaches infinity. Simple normalization of OTD yields extreme results at boundary values. 62
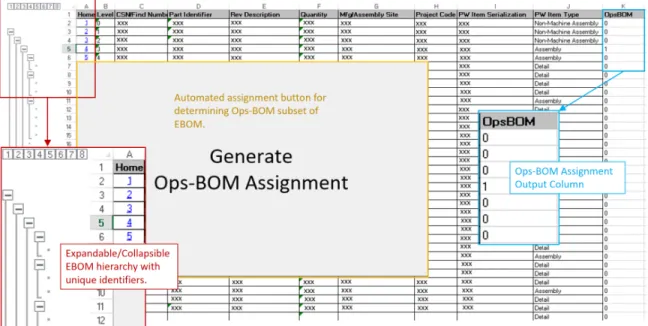
6-1 Automated tool interface for generating Ops-BOM. EBOM hierarchy is represented using collapsible and expandable rows. An assignment button automatically generates the right-most column indicating which parts have been selected for the Ops-BOM. "1" indicates selection while "0" indicates omission from the Ops-BOM. . . 66 6-2 Tabular output of Ops-BOM tool. All Ops-BOM selected parts are
collated into a single display. EBOM unique IDs are carried over in the left-most column to maintain ability to drill down into sub-assemblies and details. . . 67 6-3 Progression of reduction of BOM after implementation of each rule in
Program K. After implementing all four rules, the resulting Ops-BOM is 84% smaller than the original EBOM. . . 68 6-4 Progression of reduction of BOM after implementation of each rule in
Program F. After implementing all four rules, the resulting Ops-BOM is 88% smaller than the original EBOM. . . 70
6-5 Output of Risk Assessment Dashboard. Ops-BOM parts are displayed alongside cost, quality, and delivery metrics. These metrics are used to calculate incurred risk displayed in the right-most column. Ops-BOM parts can be expanded to drill down into sub-assembly data. . . 71 6-6 Program K Pareto chart of risk contribution for 20 riskiest parts. The
majority of risk in the program is incurred by the top part. This accurately reflects historical performance, and exposes high risk that was previously underrepresented in the legacy risk assessment process. 72 6-7 Program F Pareto chart of risk contribution for 20 riskiest parts.
Sim-ilar to Program K, this Pareto chart shows majority of risk incurred by the highest risk part. The high quantitative risk value indicates immediate action necessary to mitigate issues with final engine delivery. 73 6-8 Progress of fully automated risk dashboard. Final risk dashboard is
integrated with all data sources allowing for real-time data updates. Connection to part attribute data adds ability to create and modify groups of parts. Shown in red is a Risk Pareto of a custom created group of parts. Shown in green is a Risk Pareto of the full program Ops-BOM. . . 74 6-9 User interface for generation of the theoretical learning curve. Variable
learning curve parameters are displayed in tan colored cells. Parame-ters are laid out in a context aligned to performance goals of manufac-turing teams for ease of use. . . 75 6-10 Action plan input including cost impact, timeline, and unit
incorpo-rated. This sample action plan shows interface that manufacturing management can use to plan and track improvement efforts on high risk parts. Ownership, timeline, and unit incorporation all provide visibility and accountability in implementation of the risk mitigation effort. . . 76
6-11 Final risk mitigation curve output with all four benchmarks repre-sented. Comparison of the learning curve, program targets, action plan, and actual data gives a comprehensive understanding of risk mit-igation progress. Action plan and actuals can be benchmarked against risk reduction due to standard learning, and targets can be continu-ously re-evaluated based on current state. . . 77 7-1 Information flow diagram depicting inputs and outputs of Quantitative
Risk Assessment process. Shows movement of data from independent sources to Ops-BOM and final dashboard as well as final validation interaction with current MRL process. . . 80
List of Tables
Chapter 1
Introduction
This thesis seeks to make manufacturing risk analysis more efficient, accurate, and accessible by leveraging recent advances in real time data collection and automation. In this context, risk is defined as uncertainty in the ability of a manufacturing pro-cess or program to deliver the final product. Current risk assessments rely heavily on industry experience and exhaustive qualitative checklists. With the advent of op-erations data collection infrastructure in the form of SAP and Business Warehouse among others, this project explores how to incorporate quantitative validation into the risk assessment process. Available data sources are evaluated, identifying key metrics used to develop a semi-automated process by which anyone in the production hierarchy can gain an understanding of risk prioritization at a part level for turbine engine programs. This first chapter focuses on presenting the problem statement, hypothesis, research methodology, scope, and outline of the rest of this document.
1.1
Problem Statement and Motivation
Due to advancements in turbine engine technology, Pratt & Whitney is experiencing an increase in demand for new engines. In the past, Pratt & Whitney operated in a high margin industry with steady or contracting demand. With the advent of innovative turbine technologies including the Geared Turbofan Engine (GTF) and a surge in demand, Pratt & Whitney is evaluating how to maximize production capacity
and reduce systematic risk.
Initial production of the GTF faced unforeseen challenges and risks in the manu-facturing processes. Integral modules of the GTF reported high rates of quality issues resulting in severely reduced engine throughput and decreased capacity to meet grow-ing demand. The aerospace industry standard risk assessment system is Manufac-turing Readiness Level (MRL). MRL was championed by the United States Depart-ment of Defense (DoD) and subsequently integrated into aerospace manufacturers themselves. The MRL approach is driven by assessments, which must be carefully controlled to provide useful output [14]. The legacy MRL system at Pratt & Whitney was unable to adequately identify and mitigate risk during production of GTF. The Operations Organization conducted a root cause analysis demonstrated in Figure 1-1 to identify potential failures in the legacy MRL process.
Figure 1-1: Root cause analysis for unreported risk on GTF program. Issues with manufacturing during first wave of GTF engines were documented and traced down to determine root cause in Operations organization. The colored boxes document common causes that contributed to program level setbacks. This thesis addresses lack of equal standard work quality across all processes, separation from performance metrics, and lack of a program level risk assessment.
The MRL team was able to identify several root cause issues that lead to subop-timal manufacturing processes passing through readiness milestones during risk
as-sessments. Three main root causes will be addressed by the research in this project: inadequate standardization of processes, segregation of risk assessment from quantita-tive performance metrics, and inability to aggregate risk at a program level. Pratt & Whitney is investing in a redefinition of the MRL and manufacturing risk assessment processes to more accurately and quickly identify high risk areas in future turbine programs.
1.2
Hypothesis
This thesis hypothesizes that standard processes and tools for identifying, analyzing, and mitigating production risk using real time operations data significantly enhances the ability of management and manufacturing teams to understand and react to operations inefficiencies. This project is focused on reducing risk assessment cycle-time, complexity, and inaccuracy, as well as demonstrating how teams throughout the production hierarchy can incorporate risk analysis to drive decision making.
1.3
Research Methodology
Research for this thesis came from several different sources. Interviews with mem-bers of the operations organization shed light on customer needs throughout the production hierarchy. Cost, quality, and delivery operations data were collected and analyzed to provide insight into current risk management processes and to imple-ment a quantitative risk model into the final dashboard. This risk analysis dashboard was supplemented by risk mitigation tools to manage risk reduction efforts, provide real time performance, and benchmark against the calculated optimal learning rate. The rest of this thesis will evaluate the process of implementing the quantitative risk analysis and mitigation process and discuss the results.
1.4
Scope and Limitations
Part of Pratt & Whitney’s effort to strengthen the MRL process is administrative and out of the scope of this project. Figure 1-1 shows two major issues to be main-taining MRL process rigor, and integrating MRL in the engineering design process. This project will focus specifically on integration of operations metrics into the risk assessment process and development of standard tools for risk analysis and mitiga-tion. The key operations metric fields used to test the hypothesis were cost, quality, and delivery. Upon validation of the hypothesis, Pratt & Whitney intends to expand the processes developed to encompass all engine programs and incorporate additional metrics as more operations data becomes available. The risk assessment processes can be broken down into three distinct phases:
∙ Identification of Operations Critical Bill of Materials – an automated process by which each program can develop a comprehensive list of parts critical to understanding aggregated production risk of the entire engine.
∙ Production Risk Analysis – the collection of key operations metrics into a data dashboard and method of combining these metrics into a single value represent-ing the production risk of each operations critical part in an engine. This phase also includes analysis and visualization of risk at a part level to aid in resource prioritization and enhancing understanding of program level risk exposure. ∙ Risk Mitigation Implementation – standard tools and processes for
implement-ing risk mitigation efforts once parts contributimplement-ing critically high production risk to the engine program are identified.
1.5
Thesis Outline
Chapter 2 provides an overview of Pratt & Whitney. Specifically, this chapter exam-ines the Operations Organization and the MRL team from a political, cultural, and strategic design lens.
Chapter 3 provides an overview of literature regarding current research in manu-facturing risk assessments from a variety of industries, and the use of different oper-ations metrics to generate a singular risk value.
Chapter 4 discusses the context of this project including administrative prepara-tion from Pratt & Whitney, the MRL team’s current objective within the Operaprepara-tions Organization, and this project’s role in furthering that objective.
Chapter 5 lays out the three main phases of this project. This chapter focuses on data collection, and methods of analyzing data to overcome each of the three hurdles targeted by each phase.
Chapter 6 provides a discussion of the results of all three phases, and an evaluation of the overall risk assessment process developed over the course of this thesis.
Chapter 7 outlines future recommendations for continuing this project and dis-cusses lessons learned during development of the final quantitative, semi-automated, risk assessment process.
Chapter 2
Company Overview
This chapter gives background information from Pratt & Whitney motivating the objective of the Operations Organization, MRL team, and this thesis. This chapter discusses how the introduction of new technologies such as the GTF program line and resulting demand increase played a significant role in the current direction of Pratt & Whitney Operations. Moreover, this chapter conducts a three-lens analysis of the Pratt & Whitney Operations Organization focusing on the role of the MRL team. In depth organizational analysis is important to understanding the constraints in the risk assessment process, and significantly shaped the implementation of this thesis.
2.1
Company Background
Pratt & Whitney became a major player in the aerospace industry in the 1920s when Frederick Rentschler helped pivot Pratt & Whitney into aircraft engine manufacturing to produce a novel air-cooled engine of Rentschler’s design [9]. Since then, Pratt & Whitney has had major success with research and development and has been a leader in aerospace innovation. With steep capital investments required for new aerospace technologies, Pratt & Whitney programs have long development lifecycles with variable demand. The operations organization must manage production rates of all programs to meet demand based on the lifecycle of the individual program. This means the operations organization requires precise understanding of production
risk to effectively meet demand. With new commercial and military technologies providing significant performance advancements to Pratt & Whitney turbine engines, demand forecasts are high resulting in rapid increase in production rate.
Over the last 30 years, Pratt & Whitney has invested $10 Billion in the develop-ment of the Geared Turbofan Technology (GTF). While a conventional turbine engine has the fan and turbine spin at a single speed, GTF introduces a gear that allows the two sections of the engine to spin at custom speeds. Using the geared turbofan technology, engines can be designed to capture higher fuel efficiency by allowing the fan to expand and spin slower than the turbine. Continuing the spirit in which the company began, Pratt & Whitney has been able to offer a leap in performance due to novel turbine technology [4]. The GTF engine provides a reduction in commercial aircraft fuel burn of more than 16 percent, reduction of regulated emissions of more than 50 percent, and 50% noise reduction [1].
In 2016 Pratt & Whitney had orders from Airbus, Bombardier, Embraer and Mit-subishi for 7,000 engines valued at more than $18 billion. Forecasting further increase in demand, Pratt & Whitney ramped up production of the GTF aiming to double by 2020 [12]. With performance enhancing technological innovations in the GTF program, production continues to ramp up with an increased need to mitigate risk in the form of cost, quality, or delivery deficiencies within the current manufactur-ing processes. Although the initial wave of GTF production was largely successful, the program faced major challenges regarding manufacturing processes that passed through legacy MRL assessments but failed to maintain cost, quality, and delivery performance metrics. Due to manufacturing risk being passed down the production chain, certain parts of the GTF had lower than average final yield rates. Had risk assessments been tied to performance metrics, perhaps quality issues further up the production chain might have been mitigated to maintain high production capacity [12].
The operations organization is responsible for ramping up production rate, and the MRL team manages the method by which each module center assesses and tracks their manufacturing capability in the form of manufacturing readiness. Readiness
and risk share an inverse relationship such that processes with higher manufacturing risk are rated lower in readiness. This thesis will focus on implementing a process of assessing manufacturing risk for each part of a turbine engine program tied di-rectly to operations metrics meant to measure performance. Using real time data, hidden production costs were uncovered and aggregated to develop a comprehensive understanding of risk for a turbine engine program.
2.2
Three Lens Analysis of the Operations
Organi-zation
The MRL team is located at Pratt & Whitney headquarters in East Hartford, CT. However, customers of MRL output exist all over the company including the Colum-bus Forge Disk (CFD) plant in ColumColum-bus, GA and the Pratt & Whitney plant in North Burwick, ME. During this time of change and redefinition of the risk assess-ment process, the MRL team went through a strategic, cultural, and political trans-formation to more effectively execute to a new standard, and support the sharp ramp in production. The following analysis will examine the organization of the MRL team during this project from three different lenses to later provide insight into how the results from this thesis can most effectively be implemented at Pratt & Whitney.
2.2.1
Strategic Design Lens
This project was an effort conducted in conjunction with the MRL team within the Operations organization. Pratt & Whitney employs a matrix structure to organize functions and programs. The MRL team is part of the central Operations organi-zation that does not have ownership over a single program or section of the engine. The MRL team supports both commercial and military programs, and maintains ownership of standard processes utilized by individual programs. Module centers have ownership over certain sections of the turbine engine, and are the end users of the standardized risk mitigation tools developed by this thesis. Risk assessments
are carried out by the MRL team, but the responsibility of implementing improve-ments and meeting production rate falls to the individual module centers. Therefore, strategically aligning incentives between the module centers and the MRL team by integrating performance metrics with risk analysis maximizes effectiveness of the risk assessment process.
This thesis seeks to provide a comprehensive risk assessment process to increase the ease of handoff from MRL team to module center. The MRL team is intended to act as a support group helping to enable accurate and productive usage of standard risk assessment processes across all production facilities within Pratt & Whitney. Incorporating the needs of the module centers as well as the MRL team was integral to developing a set of risk analysis tools to support the entire production process.
2.2.2
Cultural Lens
Pratt & Whitney is a large manufacturer in the aerospace industry, and has been a large player in this space for almost 100 years. The culture at Pratt & Whitney is shaped largely by the aerospace industry and the lifecycle of Pratt & Whitney’s major programs. Existing in the aerospace industry and working with both commercial and military contracts breeds a conservative culture of slow and deliberate change. Pratt & Whitney takes a lot of pride in its support of the military, and understands the high stakes in which it operates. Therefore, accountability in systems and processes is high such that all are owned and regulated by teams throughout the enterprise. Every bit of data is restricted and requires permission to access from the owner of the source folder.
The production and technology lifecycle of turbine engines at Pratt & Whitney contributes significantly to the culture at the company. Currently, Pratt & Whitney is in a period of high growth after completing research and development of the GTF and finally ramping up production. With that comes increases in hiring, and growth in entry level positions as new programs are formed to fulfill contracts. The workforce at Pratt & Whitney East Hartford is getting younger, and is transitioning from a time of internal technology research to that of full scale production. Introduction of a younger
workforce into existing teams is also driving the push toward data driven solutions that don’t require years of industry knowledge to provide insight. However, the conservative nature of changing processes in an aerospace company impedes the rush to provide data driven solutions to every problem. This thesis provided a method by which risk could be analyzed and mitigated using standard metrics based tools. The developed process is initially being used as a validation tool alongside the qualitative MRL assessment. Building trust in new tools and processes is important in a company with such a high impact product.
2.2.3
Political Lens
The champion of this project and person with the most political capital involved with this effort is the VP of Operational Excellence. He transitioned to Pratt & Whitney in 2018 from the automotive industry, which is the manufacturing industry leader in production efficiency. With the projected increase in demand due to the GTF, Pratt & Whitney would be operating in a similar environment to an automotive company in which throughput efficiency would be the driving performance metric. The mandate of the VP of Operational Excellence is to expand capacity as cost effectively as possible and get Pratt & Whitney ready to meet the influx of demand.
In order to effectively manage overall capacity and predict production rates, the Operations organization must effectively assess the readiness of their separate module centers to satisfactorily produce different sections of the engine. While the Opera-tions organization owns the process for assessing the readiness of the module centers, the module centers are comprised of manufacturing teams responsible for meeting performance metrics and submitting to MRL assessments. The two organizations have competing incentives as the module centers view the MRL assessments as ob-stacles not tied directly to meeting performance milestones. Part of this effort was to help align incentives between the manufacturing teams and the process management teams.
Chapter 3
Literature Review
Assessing manufacturing risk based on operations metrics has a great deal of litera-ture, and most of the research has been conducted within the fundamental topic of Lean Manufacturing. In order to discuss risk calculation methods, the initial concept of continuous evidence based process improvement in Lean Manufacturing must be explored. This chapter also discusses research regarding readiness level beginning with Technology Readiness Level, and focusing on Manufacturing Readiness Level. Finally, literature on different manufacturing risk frameworks, and their use of real time data will provide an insight into how a quantitative risk assessment could benefit Pratt & Whitney.
3.1
Lean Manufacturing
As information technology applications become more powerful in manufacturing, com-panies in all manufacturing based industries strive to harness data and analysis tech-niques to reduce cost and maximize capacity. The core philosophy of lean manu-facturing is the production of goods with less of every resource including less waste, human effort, manufacturing space, and investment in tools. Lean manufacturing is focused on reducing waste in the manufacturing process, beginning with the 7 wastes of the Toyota Production System. These 7 wastes are overproduction, excess inven-tory, waiting, transportation, unnecessary motion, over-processing, and defects [13].
The focus of lean manufacturing is to uncover hidden costs in the manufacturing process, and continuously drive manufacturing efficiency.
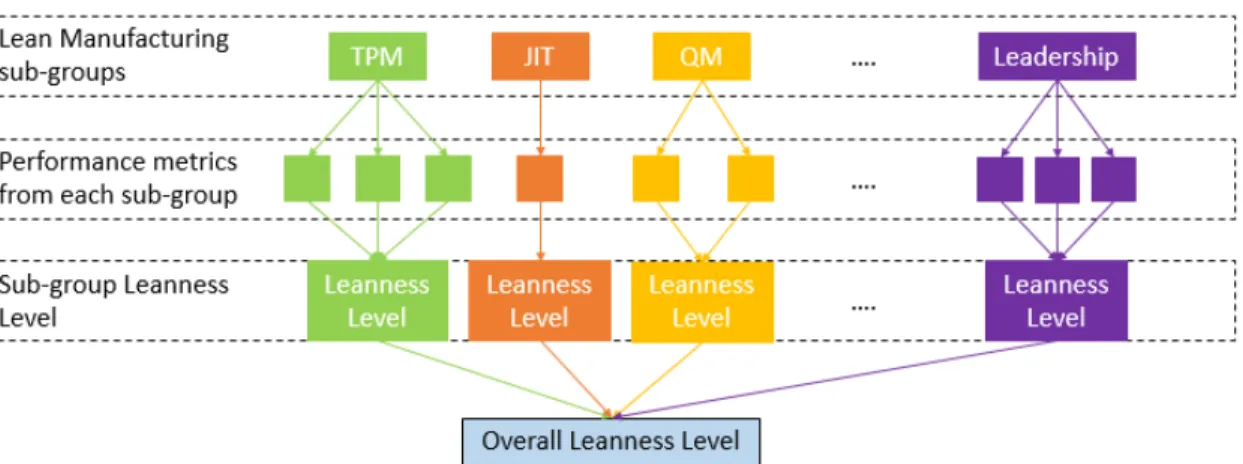
The method by which lean manufacturing has been managed is the predecessor to the later technology readiness level and manufacturing readiness level assessments. In “Leanness Assessment Tools and Frameworks”, Oleghe and Salonitis discuss the concept of “Leanness” in manufacturing organizations. Essentially, “Leanness” is the measure of the performance of lean manufacturing processes [3]. This metric is an aggregation of all contributing factors depending on the specific scenario. The fol-lowing example methodology in Figure 3-1 specifies three other sub-groups of Lean Manufacturing: Just in Time (JIT) management, Quality Management (QM), and Total Productive Maintenance (TPM). Figure 3-1 shows a hierarchical structure with the methodological steps for assessing “Leanness” in such a manufacturing process [3].
Figure 3-1: Methodology for assessing leanness in the manufacturing process. Lean manufacturing sub-groups are analyzed individually using quantitative performance metrics tailored to each sub-group. A leanness level is determined for each sub-group representing the amount of leanness contributed by that group. Leanness of each sub-group is aggregated to derive an overall leanness level of the whole process.
3.2
Readiness
Readiness is a term introduced by NASA in the 1960s in the form of a “flight readi-ness review” as a way of codifying pre-flight checklist rituals meant to determine if a flight vehicle was fit to fly. During the Apollo program, NASA was faced with the challenge of designing systems utilizing technology still in development. In response, NASA created the “technology readiness review”, a process meant to evaluate emerg-ing technologies and provide a comprehensive value for their development progress. From there, the concept of readiness spread to manufacturing, logistics, and many other disciplines [6].
3.2.1
Technology Readiness Level
Technology Readiness Level (TRL) was developed by NASA as a method of evaluating emerging technologies for use in solutions to space challenges during the late 1960s and early 1970s. The purpose of introducing a maturity assessment was to have a common scale by which to compare drastically different technologies with different benefits and detriments. Moreover, TRL was easy to understand for all organizations involved in the development of a technically complicated product allowing the manufacturing companies to easily communicate with investors, customers, and other stakeholders [5]. The nine TRL levels can be divided into three distinct phases:
∙ TRL 1-3: Early conceptual development generally conducted in university or corporate research laboratory.
∙ TRL 4-6: Medium maturity technology generally involving early prototyping, but still primarily conducted in a laboratory research environment.
∙ TRL 7-9: Focused on final maturity of technology to be transitioned from a research environment to a production environment.
While TRL was integral to NASA’s technology development and evaluation pro-cess, the system suffered from shortcomings related to the communication and infor-mation capabilities of the time. The TRL system suffered from the “Valley of Death”
concept which demonstrated that many technologies stagnated in development dur-ing the handoff from R&D to production. While TRL focused on evaluatdur-ing the core technology, there was no criteria regarding scalability of the technology and readiness from a manufacturing standpoint [5].
3.2.2
Manufacturing Readiness Level
Due to the success of NASA’s TRL framework, offshoots in disciplines other than technology development gained traction. Perhaps the most important offshoot is manufacturing readiness, which can be used to describe new manufacturing tech-nologies or manufacturing new products using known manufacturing techniques [5]. Similar to TRL, MRL is a level based framework that evaluates an entire manufactur-ing process based on a checklist customized to provide insight into the specific process being assessed. Table 3.1 displays the overarching definitions of each readiness level as specified by Department of Defense Instruction (DoDI) 5000.02 [5]. Although DoDI 5000.02 provides high level guidelines for MRL states, the detailed assessment method is generally developed internally specific to the application in question. Generally, each level is paired with an in depth checklist that must be fulfilled before a man-ufacturing process can pass on to the next level. Checklists can contain qualitative and quantitative questions, however, the end result must be an integer value on the MRL scale.
The problems with MRL stem from the founding principle of an assessment based management system. The readiness level system was developed by customers to a manufacturing process who required a simple ten-point scale system to easily un-derstand the progress of a complex system. Ultimately, the output of all MRL assessments is qualitative. While quantitative information can be used as a crite-rion between levels, the levels themselves have no quantitative meaning. Relying on a qualitative system to assess a manufacturing process held to quantitative performance standards may not provide the most useful measure of readiness.
Table 3.1: DODI specifications for all 10 manufacturing readiness levels.
3.3
Manufacturing Risk Assessment
Manufacturing risk has been studied in many industries with a particular interest in assessment of how much risk exists in a process. Several frameworks have been developed to assess manufacturing risk using a variety of metrics and scales. In “Process-oriented risk assessment methodology for manufacturing process evaluation”, Shah builds a risk measurement model based on the probability and consequence of a risk event among other factors. The paper concludes by presenting a process-oriented risk assessment methodology to rank manufacturing processes [8].
Assessing manufacturing risk stems from the desire to reduce final delivery uncer-tainty in a manufacturing process. Cost increases, quality issues, and manufacturing slowdowns all decrease the ability of a manufacturing process to produce the final product at the required rate [8]. Ultimately, effective risk management leads to max-imizing value from each manufacturing process.
manufacturing processes defines a framework for assessing risk. The typical risk management lifecycle follows the following steps: Risk identification, Risk assessment, Risk mitigation action, and Risk monitoring. Accurate risk assessment is integral to management of risk otherwise mitigation efforts will not produce the desired effect. Figure 3-2 details the integrated framework next to a general risk management process as proposed by Neghab in “An integrated approach for risk-assessment analysis in a manufacturing process using FMEA and DES” [7].
Figure 3-2: General risk management process vs. Integrative risk management frame-work. Legacy risk management process shown on the left utilizes industry expertise in a linear process of identifying and assessing risk. Integrative framework is data driven and iterative. Output data feeds back into risk assessment model to drive continuous improvement.
The general construction of the integrated risk assessment framework combined with the fundamental assessment method as given by the assessment for “Leanness” shown in Figure 3-1, will become the basis for the quantitative manufacturing risk assessment process developed by this thesis for Pratt & Whitney. While Figure 3-1 demonstrated the breakdown approach to aggregating sub-assessments into a com-prehensive value for a large system, Figure 3-2 deals with integrating quantitative methods into a qualitative assessment process. Modelling, measurement, and miti-gation of risk can all be driven by data to improve assessment accuracy and increase the parallel nature of the processes rather than the traditional serial approach.
3.4
Learning Curve
Learning in operations can be defined as the process of becoming more efficient by gaining experience, skills, and proficiency through the lifecycle of a process. Since learning occurs over a period of time, the process can be represented with a curve [11]. In operations and manufacturing, the time variable is often in the form of production milestones. Since learning is a measure of efficiency growth, presumably gained from repetition of the manufacturing process, it makes sense to measure efficiency as a function of units produced.
Learning curve theory was developed in aerospace in which T. P. Wright first observed that the average cost of producing a two-seater airplane decreased at a constant rate each time the production quantity doubled [11]. The original log-linear curve proposed by Wright has been modified in several ways to fit applications in many different industries.
3.4.1
Calculating the Learning Curve
Several methods of implementing a learning curve exist. The original curve, still considered the industry standard method in aerospace, is a log-linear relationship between cost and time. Every doubling in time should result in a constant rate of cost decrease. The log-linear relationship captures the idea that early learnings and improvements produce large initial gains, but as the process approaches the ideal state, each additional unit provides marginally decreasing learnings. The original learning curve is defined as follows,
𝑚𝑢 = 𝑎𝑢𝑏 (3.1)
where,
𝑚𝑢 is marginal cost or risk associated with 𝑢𝑡ℎ unit,
𝑢 is total quantity of units produce,
𝑏 is the learning index defined by 𝑏 = 𝑙𝑜𝑔2𝐿, and
𝐿 is the learning rate of the process.
This specific log-linear equation with 𝑚𝑢 describing marginal cost was developed
by James Crawford after observing similar learning in airframe production at Lock-heed [2]. While 𝑚𝑢, 𝑎, and 𝑢 are factors associated with the process itself, extensive
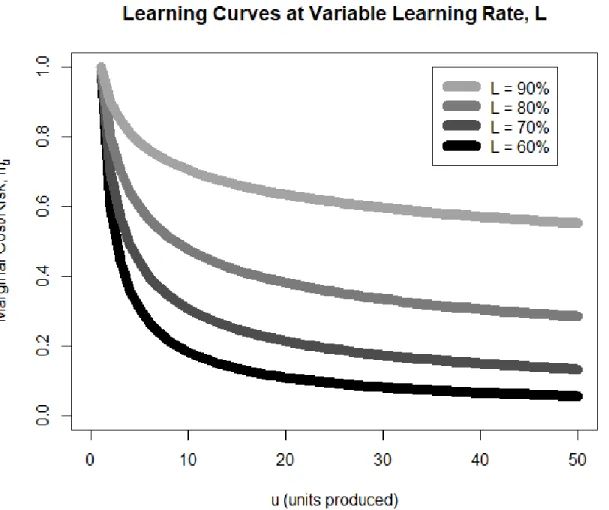
research has been conducted on learning factors, 𝑏 and 𝐿 resulting in standard values for various industries with aerospace standardized at an 85% learning rate, 𝐿 [10]. Figure 3-3 shows several sample learning curves built using Equation 3.1 with various learning rates, 𝐿.
As 𝐿 decreases in magnitude, more learning occurs per unit produced. A 90% learning rate, 𝐿 means that each subsequent unit will have 90% of the cost of the previous unit. Essentially, costs should decrease by 1 minus L or 10% for each unit. Therefore, in Figure 3-3 we can see that 𝐿 = 60% shows a roughly 80% reduction in cost or risk over the first 10 units produced whereas 𝐿 = 70% required 30 units of production to achieve the same reduction in cost.
3.4.2
Use of the Learning Curve
Learning curves have a wide variety of uses in manufacturing applications. Primar-ily, learning curves are used as a theoretical benchmark to track cost reduction in manufacturing processes over the lifecycle of a production program. However, learn-ing curve methodology is applicable to a wide range of scopes within manufacturlearn-ing processes. Learning curves can be used both as high level management tools for an entire program or for more granular analysis such as measuring expected yield from a single manufacturing cell [11].
Moreover, each parameter in the learning curve can be examined to understand the state of the subject process. For example, learning analysis can be implemented such that the output is marginal cost or risk for a target production unit given an industry
Figure 3-3: Log-linear learning curves at various learning rates. At larger rates of learning, the risk decreases more for each unit produced. The industry standard learning rate for aerospace is 85%, meaning each additional unit produced should incur 15% less risk than the last.
standard learning rate. However, the equation can also be altered to output required learning rate given a starting cost and target cost for a target unit. This way the learning curve can be used to benchmark a subject process against industry standard learning as well as derive optimal learning rate for a certain desired beginning and end state.
This thesis implements the learning curve framework as the basis for standardized risk mitigation tools in the final steps of the quantitative risk assessment process. Once risk is evaluated on a part basis, risk tracking and mitigation is done against a learning curve to provide a benchmark comparison for actual results.
3.5
Summary
Lean manufacturing, readiness, and manufacturing risk been researched extensively, providing a solid foundation by which to explore further. Several frameworks for evaluating manufacturing processes ranging from purely qualitative to highly data driven. As data integration in manufacturing processes increases, the methods by which manufacturing risk can be assessed can become more powerful. This thesis utilizes the frameworks and learnings of past research in manufacturing risk assess-ments, to develop a quantitative process for Pratt & Whitney to improve accuracy and support mitigation efforts.
Chapter 4
Project Context
The Manufacturing Readiness Level (MRL) team set the groundwork for a project that would last and had a plan for integration of results into core Pratt & Whitney systems. This project specifically addresses three main challenges the MRL team currently faces with the qualitative risk assessment process: determining which parts to assess, collecting and comparing operations data, and mitigating identified risk. This chapter discusses the role of the MRL team and the context in which this project fits within the operations organization.
4.1
Timeline of Quantitative Risk Assessment
Im-plementation
In the beginning of 2019, the MRL team was tasked with redefining the process by which manufacturing readiness level would be assessed at Pratt & Whitney. The MRL team started constructing the infrastructure needed to test the hypothesis of this thesis, that by standardizing tools in the risk assessment and mitigation pro-cesses, end users would be able to react more quickly to operations problems. While standardization of processes and a redefinition of the qualitative assessment began, the MRL team did not have capacity to explore quantitatively driven risk processes, and their integration with the current risk assessment process. Data was included as
part of the qualitative assessment process. An operations data lake was developed in a data visualization and integration system called QLIK, providing access to specific dashboards containing operations metrics.
This project began in June 2019, and kicked off the MRL team’s effort to evaluate metrics and build a quantitative model for assessing risk to be used alongside the industry standard MRL assessment. The MRL team began by exploring three key operations metrics: cost, quality, and delivery. Although three key metrics were iden-tified, the initial research of this thesis focused heavily on all different permutations of cost, quality, and delivery and each one’s role in determining a final production risk value. Metrics came from data sources across the enterprise, all under different access restrictions. The initial effort was to connect relevant data from different parts of the Pratt & Whitney data network to the final tool. In parallel, the MRL team had capacity constraints regarding the number of parts that could be analyzed for each given engine program. This project developed an automated process for determining an operations critical bill of materials based off research into previous programs, and interviews with industry experts in the operations organization.
The final step was to develop standard tools for mitigating risk once discovered. As the MRL team had already built standardized tool infrastructure for managing readiness levels, this project drove development of standard tools utilizing the output of the quantitative risk assessment. Detailed in this chapter is the role of the MRL team in the operations organization, and the specific challenges this project is meant to address in their newly structured manufacturing readiness level assessment process.
4.2
MRL Team
The Manufacturing Readiness Level (MRL) team exists as a support entity in the central Operations organization. Manufacturing teams throughout Pratt & Whitney interface with the MRL team to validate their processes to certain readiness levels at different stages in the lifecycle of a program. MRL is a device that upper management uses to get a high level perspective of risk distribution throughout an engine program.
Moreover, MRL is used as an easy to understand method of communicating program progress to customers. The MRL team owns the processes used to determine MRL for a manufacturing process, and continuously seeks to make the process more accurate and easier to use.
4.2.1
Responsibilities and Value Proposition
Historically, the MRL team has played a support role to the individual manufacturing teams when it comes to readiness. The MRL team provides frameworks and checklists for conducting readiness level assessments, and the module centers that own the engine sections are responsible for managing manufacturing processes to pass certain levels at certain milestones in the production program.
Although module centers are accountable for their own performance, the MRL team is held accountable for program level performance issues due to inaccuracies in MRL assessments. Early on in the GTF program, module centers were able to waive certain MRL requirements in an effort to ramp production. Moreover, the legacy MRL assessment processes were not standardized resulting in a wide variety of interpretations of the same checklist requirements. The GTF program faced manufac-turing challenges due to propagation of risk through the production process until the risk was demonstrated when production rate goals could not be achieved. The Oper-ations organization placed an emphasis on compliance with MRL team processes, and tasked the MRL team with renovating the MRL assessment process with standard tools and automated processes. Development of enterprise wide, proficiency based standard work was key to aligning the performance metrics of manufacturing teams with MRL assessment output and increasing the accessibility of risk assessments to every stakeholder in the organization. While legacy assessments focused on evalua-tion, proficiency based standard work would be action oriented with activity based assessments directly driving risk mitigation efforts.
Figure 4-1: Issues and actions identified during the MRL reset effort. Four main ares of improvement were identified for the MRL team: standardization of risk assessment tools, integration of MRL into existing processes, development of MRL training, and enforcement of MRL requirements. This thesis addressed standardization of tools and integration of MRL with quantitative metrics.
4.2.2
Current Major Efforts
To execute on its new mandate, the MRL team began by identifying four major areas for improvement: lack of standardized MRL assessment tools, lack of MRL integration into existing processes, no formal MRL training, and a large amount of MRL process noncompliance as shown in Figure 4-1.
Lack of standardized MRL assessment tools in the legacy MRL process allowed for different teams to interpret qualitative judgements differently. Furthermore, con-fusion regarding specific methods of assessing MRL among the manufacturing teams required substantial support from the MRL team. In some cases, risk was inadver-tently passed down the production chain due to optimistic qualitative judgements artificially advancing the readiness level of several processes. Integrating MRL into existing processes controls for incorrect advancement through the MRL process as MRL assessments can be validated against performance metrics. This thesis focuses on addressing these first two root issues by developing a standard framework for manufacturing risk analysis heavily driven by real time operations data.
Figure 4-2: Progression and advancement of generations of manufacturing assessment methods at Pratt & Whitney. Risk assessment methodology has historically evolved according to changing needs and capabilities at Pratt & Whitney. The Third Gen-eration process developed by this thesis leverages new data collection and analysis capabilities to make risk assessments more quantitative and accessible.
development of activity-based standard tools to improve the MRL assessment process. This represents a new generation of MRL assessment beyond the legacy MRL method of using a general DoD questionnaire. Figure 4-2 shows the generational progression of the MRL process at Pratt & Whitney.
Initially, the G1-Review was focused on third party review rather than self-assessment and continuous improvement. Historically, MRL self-assessments have been broken up into individual “threads” that represent sub-groups at which granular MRL assessments are made. The second generation MRL assessment process transitioned from an internal review-based system to a comprehensive questionnaire developed by the DoD. Although this process improved on the first generation assessment, the second generation required large amounts of time to evaluate all 400+ questions. Additionally, this process did not help integration between disciplines, and criteria interpretation remained variable.
Following the initial challenges of the GTF program, the MRL team launched the third generation of risk assessments pivoting to an activity based MRL system. Devel-opment for this system began in the beginning of 2019. The activity based MRL
sys-tem is based off over 15 different threads that each will have its own standard process for evaluating MRL. Similar to the “Leanness” framework examined in the literature review [3], each thread is evaluated for MRL independently. Finally, the MRL scores of all the threads are combined into a single MRL score resulting from the individual activities done at the thread level. Threads are focused on specific challenges asso-ciated with each manufacturing process. Examples include sourcing strategy thread such that at higher MRLs sourcing agreements are in place and production ready, and a yield curve thread which advances MRL based on certain manufacturing yield milestones.
The results of this thesis were part of the effort to revamp MRL to generation three including standardized tools for risk mitigation and integration of performance metrics into the risk assessment process. This thesis works in tandem with the qualitative MRL process to provide a quantitative risk assessment process able to validate MRL results, and eventually be fully integrated with the MRL process.
4.2.3
Engagement with this Project
The MRL team is championing this project as part of the overall effort to redefine manufacturing risk analysis in the Operations organization. In addition to standard-izing tools, the MRL team is working on integrating operations metrics and real time data into the risk analysis process. Currently MRL determinations are made via qual-itative checklists occasionally using quantqual-itative thresholds to check different boxes. This thesis provides a risk measurement from purely quantitative manipulation of metrics producing a data driven measure of risk that can be compared against MRL analysis to truly evaluate readiness of manufacturing processes.
4.3
Key Hurdles in Qualitative Risk Assessment
In addition to researching methods of developing an accompanying quantitative method of risk assessment, this project aims to assuage three specific hurdles the MRL team faces with the current risk assessment process: part selection for assessments, data
collection and comparison, and standard methods of managing risk mitigation efforts.
4.3.1
Hurdle 1: Which Parts to Assess?
The qualitative MRL process takes a significant amount of labor. The second gener-ation process was a DoD questionnaire of over 400 questions. Each question required intimate knowledge of the manufacturing process, such as input sourcing strategy, cost data, and tooling timeline. The third generation activity based assessment is also quite time intensive. The standard tools reduce risk of error, but acquiring the necessary data and status information requires interfacing with several different sys-tems and significant amounts of processing time. Since MRL is generally done at a part level, this means that conducting an MRL assessment for each part in a pro-gram generally takes 40 hours of total labor. Since turbine engine propro-grams contain anywhere between 7500 and 9000 parts, it would be unreasonable to expect all parts to go through the MRL assessment process. MRL assessments are done regularly through the lifecycle of a program, so each part would have to be assessed several times.
The Operations organization attempted to address this issue by creating a process called the Manufacturing Critical Parts List (MCPL). The intent of the MCPL was to define a standard process by which a list of parts critical to the readiness of an engine program can be generated from the full bill of materials (BOM). The MCPL process was able to identify key parts in engine programs that require special attention. However, the process was still qualitative and the generation of the MCPL focused solely on the chosen parts. Since the process relied mostly on manual judgements of qualitative and quantitative criteria, once separated from the global BOM, the MCPL was unable to provide insight into omitted assemblies that might pose unexpected risks.
Rather than completely narrow the scope of MRL assessments by selecting a subset of parts, this project conducted interviews with different stakeholders, and developed an automated process by which each pick level part was collected into an Operations Bill of Materials (Ops-BOM). To maintain visibility into every part in an
engine program, the Ops-BOM is displayed at the pick level part, but has the ability to expand and collapse subassemblies so each part can be accessed if needed. With the global BOM hierarchy contained within the Ops-BOM, the MRL team interacts with the engine through a manageable list of critical parts, but does not lose visibility into the rest of the engine should an unexpected risk occur.
4.3.2
Hurdle 2: Data Collection and Comparison
While metrics and quantitative inputs have always been an integral part of the MRL process, these metrics are often compared against thresholds to make a qualitative judgement of readiness level. Moreover, metrics are collected independently of each other and are often curated by different teams adjacent to the Operations organiza-tion.
Operations data exists in several sources around the enterprise. Due to the sensi-tivity of this data, access requires application and justification. However, the Pratt & Whitney IT system is such that custom data dashboards can be developed to display information from different sources in one central location. This project worked with different stakeholders to identify critical metrics required to compute risk of each part in an engine program. Working alongside an IT analytics team, the process of connecting each data source to a central dashboard was set in motion.
While identifying and connecting data was able to assist the MRL team in access-ing information for risk assessments, a quantitative model must utilize these metrics as quantitative inputs to output a single value for risk incurred to Pratt & Whit-ney. In a way, the qualitative MRL process uses industry experts to compare data from different fields to make a final assessment. However, in the spirit of standard processes that remove subjective judgement from contention, operations metrics with different units, measured in different ways had to be converted to common units and combined in some manner. This research focused on three key metrics: cost, quality, and delivery. To deliver a final risk impact value for a part, the resulting methodology must be able to compare dollars, defect rate, and on-time-delivery percentage.
be aggregated in any part group including the full engine. Conducting a qualitative MRL assessment requires a custom detailed process for each part. Metrics and data are judged based on the specific part being assessed. The final MRL value is not easily comparable to another part that might have had a different team of people conducting the assessment. Moreover, aggregating the part readiness to judge readiness for the entire engine program is exceptionally difficult. The quantitative risk output proposed by this thesis supports aggregation and division as all metrics come from the same central sources and have been normalized in the same way.
As data is becoming more accessible at Pratt & Whitney, the MRL team seeks to integrate real time data with standard MRL processes. Not only does creating a central data repository allow quicker qualitative assessments, it provides opportunity to develop automated numerical methods of calculating risk that can be compared and validated via the traditional MRL process.
4.3.3
Hurdle 3: Risk Analysis and Implementation
Following the MRL assessment process, the MRL team also supports manufacturing teams with risk mitigation. If the MRL is lower than it should be, the manufacturing team determines which threads are having the biggest impact, and works on devel-oping a solution. For example, if the Yield curve MRL is bringing down the overall assessment, the manufacturing team will conduct detailed research into why yield is lower than expected. The MRL team often faces challenges with supporting MRL advancement when manufacturing teams are also evaluated with separate operations performance metrics. Standard MRL tools tend to be checklists with qualitative questions that help characterize the state of the process from different perspectives. However, since MRL assessments are state-based, and manufacturing systems are dynamic, certain risks may be overemphasized while others may be hidden when evaluating with a checklist.
As part of the quantitative risk assessment process, this thesis develops a method-ology for standard dynamic tools that aid in risk mitigation efforts. Once risk is identified, these tools offer a management framework that can be implemented by
anyone in the production hierarchy. For example, mitigation of overall risk at the part or engine level is managed by allowing manufacturing teams to track theoretical risk, actual risk, and mitigation action plan within one tool. Due to the automated nature of the quantitative risk assessment system, risk can be recalculated after each iteration or set of iterations of the manufacturing process to dynamically track how expected improvements in the process compare with actual results.
4.4
Integration with IT Systems
While the quantitative risk assessment process was being developed, an IT analyt-ics team was working alongside to incorporate design and analysis decisions into a final QLIK dashboard within the Pratt & Whitney operations data lake. QLIK is the data analytics and integration system by which employees can access real time data connected to continuously updated central data sources. This project focused on researching relevant metrics and developing methods for building an operations critical list of parts, assessing risk using key operations metrics, and implementing standard tools by which operations risk can be mitigated. Each week, the results from this research drove development of the centralized QLIK dashboard including selec-tion of operaselec-tions critical parts, key operaselec-tions metrics, and method of calculating comprehensive risk value. This ongoing development was important in implementing the results of this project within established Pratt & Whitney systems, immediately providing value to the operations organization.
Chapter 5
Data Analysis and Methods
This chapter discusses the three phases of this project spanning the entire lifecycle of engine program risk assessment. Each phase targets a different hurdle in the cur-rent risk assessment process, and all together create a standardized semi-automated process for managing risk for a turbine engine program.
5.1
Phase 1: Operations Critical Bill of Materials
As discussed in Section 4.3.1, the first phase of the quantitative risk assessment methodology proposed by this thesis is to develop a list of parts, called the Ops-BOM at which risk is assessed and reported. This list of parts should be representative of the entire engine, and maintain hierarchical links with the global BOM so any other part of interest can be accessed if needed.
An initial effort to develop a similar list called the Manufacturing Critical Part List (MCPL) fell short due to underrepresentation of parts that were later determined to have been critical. While the MCPL was a robust process for determining the vast majority of critical parts, its reliance on qualitative differentiation factors for sorting parts into the MCPL meant that generation of the MCPL could not be automated, and creation of the MCPL did not preserve the connections between MCPL parts and the rest of the global BOM. Once a part was removed from the MCPL, MRL visibility into that part would be severely reduced. The Ops-BOM process improved
on the MCPL by implementing the selection bases to align with digital information available in the raw global BOM, thereby significantly reducing time to generate the Ops-BOM while also preserving visibility into every part in the engine.
5.1.1
BOM Data Sources
Generating a bill of materials in Pratt & Whitney is not as trivial as looking up a part list to a certain engine configuration. Teams from around the company used specialized bills of materials to fit their own needs. The cost, MRL, industrial engi-neering, and manufacturing teams all use different BOMs. This section will discuss the different BOMs relevant to the creation of the Ops-BOM as well as other sources of data needed to build the final automated process.
Most BOMs throughout the enterprise are generated as a subset of some global BOM that contains every part in an engine. This global BOM is called an Engineering BOM or EBOM. The EBOM is a comprehensive list of parts in any engine program. Each program has a unique EBOM. The process by which this phase of the project generated an Ops-BOM was by using a set of rules to choose a subset of parts within the EBOM. However, the EBOM also contains information related to part hierarchy such as next-higher-assembly and subassembly data. While only a subset of parts were chosen to be displayed in the Ops-BOM, the hierarchical connections from those parts to the rest of the EBOM were kept intact.
Although the EBOM is a comprehensive list of finished parts in an engine, a different BOM called the MBOM exists for manufacturing teams. During the man-ufacturing process of such a complex product, intermediate parts are created and passed on between manufacturing teams. For example, a final disk in the engine may have gone through several manufacturing processes such as forging and machining before reaching its final state. Along the way, the manufacturing teams must assign some label to the semi-finished part in order to track its progress through the produc-tion chain. While the EBOM documents the final forged and machined part number, the MBOM tracks intermediate states in between forging and machining steps along with raw materials needed for manufacturing teams to operate successfully. Since this

![Figure 3-2 details the integrated framework next to a general risk management process as proposed by Neghab in “An integrated approach for risk-assessment analysis in a manufacturing process using FMEA and DES” [7].](https://thumb-eu.123doks.com/thumbv2/123doknet/14537574.534953/34.918.140.778.380.611/integrated-framework-management-proposed-integrated-approach-assessment-manufacturing.webp)