HAL Id: insu-01989926
https://hal-insu.archives-ouvertes.fr/insu-01989926
Submitted on 13 Jul 2019HAL is a multi-disciplinary open access archive for the deposit and dissemination of sci-entific research documents, whether they are pub-lished or not. The documents may come from teaching and research institutions in France or abroad, or from public or private research centers.
L’archive ouverte pluridisciplinaire HAL, est destinée au dépôt et à la diffusion de documents scientifiques de niveau recherche, publiés ou non, émanant des établissements d’enseignement et de recherche français ou étrangers, des laboratoires publics ou privés.
A high-altitude long-range aircraft configured as a cloud
observatory: The NARVAL expeditions
Bjorn Stevens, Felix Ament, Sandrine Bony, Susanne Crewell, Florian Ewald,
Silke Gross, Akio Hansen, Lutz Hirsch, Marek Jacob, Tobias Kölling, et al.
To cite this version:
Bjorn Stevens, Felix Ament, Sandrine Bony, Susanne Crewell, Florian Ewald, et al.. A high-altitude long-range aircraft configured as a cloud observatory: The NARVAL expeditions. Bulletin of the American Meteorological Society, American Meteorological Society, 2019, 100 (6), pp.1061-1077. �10.1175/BAMS-D-18-0198.1�. �insu-01989926�
Using dropsondes and advanced remote sensing instrumentation, the German High-Altitude Long-Range Research Aircraft (HALO) is
configured for use as an airborne cloud observatory.
A HIGH-ALTITUDE LONG-RANGE
AIRCRAFT CONFIGURED AS A
CLOUD OBSERVATORY
The NARVAL Expeditions
Bjorn StevenS, Felix Ament, SAndrine Bony, SuSAnne Crewell, FloriAn ewAld, Silke GroSS,
Akio HAnSen, lutz HirSCH, mArek jACoB, toBiAS köllinG, Heike konow, BernHArd mAyer,
mAnFred wendiSCH, mArtin wirtH, kevin wolF, StepHAn BAkAn, mAttHiAS BAuer-pFundStein,
mAttHiAS BrueCk, julien delAnoë, André eHrliCH, dAvid FArrell, mArvin Forde, Felix Gödde,
HAnS GroB, mArtin HAGen, evelyn jäkel, FriedHelm jAnSen, CHriStiAn klepp, mArCuS klinGeBiel,
mArio meCH, GerHArd peterS, mArkuS rApp, AlliSon A. winG, And toBiAS zinner
T
he application of aircraft to sample the atmo- sphere continues a long tradition—one dignified by luminaries such as Pascal and Humboldt—of humans reaching into the atmosphere to measure its properties. Today’s research aircraft are able to carry large payloads over large distances and to a great altitude, taking them from their early beginnings as airborne observatories (e.g., Anderson 1931; Malkus et al. 1961), and transforming them into sophisti-cated laboratories (e.g., Wofsy et al. 2011; Wendisch et al. 2016). Measurements made in such laboratories have helped to characterize the distribution of water condensate, particulate matter, and trace gases in the troposphere and lower stratosphere.Today, satellites (Stephens et al. 2002; Illingworth et al. 2015) and ground stations (Ackerman and Stokes 2003; Illingworth et al. 2007; Stevens et al. 2016) re-motely sense quantities that used to require measure-ments in situ, by airborne laboratories. These modern ground- and space-based observatories have many advantages, but are limited to sampling what passes
by, which makes their measurements challenging to contextualize. Remote sensing instrumentation is, however, also well suited for airborne applications. For instance, airborne radars have been used exten-sively for research purposes for decades (e.g., Mapes and Houze 1995), and aircraft have long served as platforms for prototyping and validating satellite measurements. But the use of research aircraft as flying laboratories—designed to sample the flow in situ—continues to dominate their application. Here we articulate a different vision, one in which modern remote sensing techniques help reestablish airborne platforms as sophisticated flying observatories. By combining the mobility of a research aircraft with simple autonomous sensors (dropsondes) and ad-vanced remote sensing, we show how such platforms make it possible, for the first time, to simultaneously observe the large-scale and constituent properties of the atmosphere in space and time, and in otherwise difficult to access locations. This capability enables a new look at atmospheric processes, and gives a
1061
JUNE 2019 AMERICAN METEOROLOGICAL SOCIETY |
modern twist to the century-old application of air-craft in atmospheric research.
The idea of using a research aircraft as a platform for autonomous and remote sensing emerged with the procurement of a Gulfstream 550 for the use of the German atmospheric science research commu-nity. Together with its sister aircraft, the National Science Foundation–National Center for Atmo-spheric Research (NSF–NCAR) High-Performance Instrumented Airborne Platform for Environmental Research (Cooper et al. 1989; Laursen et al. 2006), the German Gulfstream 550 (G550) distinguishes itself from many research aircraft available for use today by its ability to fly at high (15 km) altitude, for long distances (8,000 km), all the while carrying a large payload. These qualities are reflected in its name: High-Altitude Long-Range Research Aircraft (HALO), an acronym constructed to emphasize its high-altitude and long-range capabilities. In addition to the traditional use of the aircraft, to characterize clouds and the chemical state of the atmosphere, a configuration was proposed to facilitate HALO’s use to validate new high-tech satellite remote sensing applications. With the growing appreciation of the capability of low-tech parachute-borne dropsondes to constrain the large-scale state of the atmosphere, a more comprehensive vision for the use of HALO developed. The purpose of this article is to describe
the realization of this vision through the course of the Next-Generation Aircraft Remote Sensing for Validation (NARVAL)1 expeditions.
H A LO CO N F I G U R E D A S A C LO U D
OBSERVATORY. Configured as a cloud
observa-tory, HALO uses complementary active and passive sensors to measure radiant energy across the elec-tromagnetic spectrum. Combined with in situ mea-surements from dropsondes, these sensors enable a characterization of the thermodynamic (temperature and water vapor), dynamic (large-scale winds and vertical velocity), and particulate (hydrometeors, clouds, and aerosols) state of the atmosphere over the area of flight operations. Figure 1 illustrates this configuration of HALO. All instruments, except for the broadband radiometers and infrared imager discussed at the end of this article, have been used in at least one of the NARVAL expeditions.
In the microwave part of the electromagnetic spectrum, three downward-looking radiometer modules passively measure the microwave emissions of Earth’s atmosphere in 26 channels probing two water vapor and two oxygen absorption features, as well as window channels (Table 1). The configuration of radiometers was initially chosen to mimic those found aboard, or planned for, major European satel-lites, such as the Meteorological Operational satellites (MetOp), as well as microwave measurements made by the Special Sensor Microwave Imager (SSM/I), Global Precipitation Measurement (GPM) Microwave Imager (GMI), Advanced Microwave Sounding Unit A and B (AMSU-A,B), and Advanced Microwave Scanning Radiometer (AMSR).2 The radiometer
modules (see Fig. 1, position a) are nadir staring, with beam widths of 2.7° to 5.0° and a sampling rate of about 1 s. This implies a surface footprint from HALO typically less than 1.0 km, and at most 1.5 km. The channels provide the capability of distinguishing contributions from different condensate phases of water, and providing their path integrals. In addition,
AFFILIATIONS: StevenS, HirSCH, BAkAn, BrueCk, jAnSen, And
klinGeBiel—Max Planck Institute for Meteorology, Hamburg,
Germany; HAnSen, Ament, konow, And klepp—Universität
Hamburg, Hamburg, Germany; Bony—Sorbonne University,
LMD/IPSL, CNRS, Paris, France; Crewell, jACoB, And meCH—
University of Cologne, Cologne, Germany; ewAld, GroSS, wirtH,
HAGen, And rApp—Institute for Physics of the Atmosphere, (DLR)
Oberpfaffenhofen, Germany; köllinG, mAyer, Gödde, GroB, And
zinner—Ludwig-Maximilians University of Munich, Munich,
Germany; wendiSCH, wolF, eHrliCH, And jäkel—University of
Leipzig, Leipzig, Germany; BAuer-pFundSteinAnd peterS—Metek
GmbH, Elmshorn, Germany; delAnoë—LATMOS/IPSL/UVSQ/
CNRS, Guyancourt, and Sorbonne University, Paris, France; FArrellAnd Forde—Caribbean Institute for Meteorology
and Hydrology, Bridgetown, Barbados; winG—Florida State
University, Tallahassee, Florida
CORRESPONDING AUTHOR: Bjorn Stevens, [email protected]
The abstract for this article can be found in this issue, following the table of contents.
DOI:10.1175/BAMS-D-18-0198.1
In final form 17 December 2018 ©2019 American Meteorological Society
For information regarding reuse of this content and general copyright information, consult the AMS Copyright Policy.
1 NARVAL initially stood for North Atlantic Rainfall
Validation. This name was motivated by HALO’s distinctive nose boom, which is reminiscent of the narwhal, a toothed whale that frequents waters over which the original mission intended to fly. Later NARVAL was redefined to stand for Next-Generation Advanced Remote Sensing for Validation studies. Today it stands as a metaphor for a yet broader concept.
2 MetOp is operated by the European Organisation for the
Exploitation of Meteorological Satellites. AMSU-A,B fly on a variety of satellites. AMSR has flown on three satellites.
the bandpass channels yield sensitivity to different depths within the atmosphere and, thereby, provide profiling capabilities (Schnitt et al. 2017).
An active nadir-pointing microwave cloud and precipitation radar (Fig. 1, position c) complements the passive microwave measurements. The radar measures in the water vapor window at a frequency of 35.5 GHz (Ka band). This system, similar to cloud radars operated on the Barbados Cloud Observatory since 2010 (Stevens et al. 2016), is operated with a 200-ns pulse length and a pulse repetition frequency of 5 kHz. Two receivers provide co- and cross-polarization reflectivity measurements. The output parameters are the first two moments of the Doppler spectrum, which include the reflectivity and the reflectivity-weighted Doppler velocity. In addition, the linear-depolarization ratio provides information about the target shape. The radar uses a monostatic, pulsed magnetron that enables it to precisely capture
strong gradients in the reflectivity, which is impor-tant to avoid problems with ground reflection. The high-power (30-kW peak) and relatively large, for an airborne system, (1 m) Cassegrain antenna gives it a higher-than-average sensitivity (–30.7 dBZ at 5 km) as compared to lower-powered W-band (90 GHz) airborne systems (Ewald et al. 2019). Radiation in the Ka band also attenuates less than in the W band, so that Ka-band radars can better penetrate columns with heavy precipitation.3
In the visible and near-infrared portion of the spectrum, two types of instruments provide passive
Fig. 1. Cross section of HALO configured as a cloud observatory. Detail shows two positions with major
instru-mentation in the belly pod and in the tail section. SMART and specMACS are both passive instruments making measurements with high spectral resolution at visible and near-infrared wavelengths.
Table 1. Frequencies measured by downward-looking radiometer modules within
HAMP. Indicated are the major constituent lines sampled and the retrievals to which the particular measurements most contribute.
Wavelengths Atmospheric properties
Seven H2O (22.24 to 31.24 GHz) channels Water vapor, LWP
Seven O2 (50.30 to 58.00 GHz) channels Temperature and LWP
One window (90.00 GHz) channel Water (ice/liquid) condensate path Four bandpass channels around 118.75-GHz O2 line Temperature profiling
Seven bandpass channels around 183.31-GHz H2O line Water vapor profiling and ice
3 See Mech et al. (2014) for further technical details of the
microwave suite of sensors—collectively referred to as the HALO Microwave Package (HAMP)—and Ewald et al. (2019) for the technical characterization and calibration of the radar based on flight tests. Mech et al. also include a photograph of the system as implemented on HALO.
1063
JUNE 2019 AMERICAN METEOROLOGICAL SOCIETY |
measurements. The Spectral Modular Airborne Radiation Measurement System (SMART; Wendisch et al. 2001, 2016) measures spectral irradiances (and radiances) from two implementations. One is a zenith-oriented sensor, which measures downwelling irradiances, from position e in Fig. 1. At position f, a second, nadir-staring SMART measures both radi-ances and irradiradi-ances upwelling toward the aircraft from below. SMART measurements in the visible and near-infrared (300 to 1,000 nm) wavelength range have a 2- to 3-nm spectral resolution [full width half maximum (FWHM)]. Measurements in the short-wave infrared span the range from 1,000 to 2,200 nm, with a 10- to 15-nm spectral resolution (FWHM). Radiance and irradiance data collected by SMART help quantify the presence and microphysical state of clouds. Upwelling radiances can also inform retriev-als of surface properties. These are obtained from a telescope with an opening angle of about 2°, and its time resolution varies between 0.5 and 4 s, giving it an along-path resolution of 150 m at a range of 15 km.
The spectrometer of the Munich Aerosol Cloud Scanner (specMACS; Ewald et al. 2016) is the sec-ond type of passive instrument operating in the near-infrared and visible portion of the spectrum. SpecMACS consists of two camera systems, one in the visible/near-infrared (400 to 1,000 nm), and another in the shortwave infrared (1,000 to 2,500 nm). The systems produce a spectrally resolved line image with 1,312 pixels covering a 32.7° field of view in the visible/near-infrared, and with 320 pixels covering a 35.5° field of view in the shortwave infrared. The resolution of the instrument is limited by the field of view associated with individual pix-els of the sensor, which in the shortwave infrared range is about 2 mrad. This allows the instrument to resolve 30-m surface features along a line of 8.7 km at a flight altitude of 15 km. During the first NARVAL (NARVAL1), specMACS had not yet been incorporated into the HALO payload, and instead an alternative instrument for performing differential optical absorption spectroscopy was operated from the rear of the fuselage.
Active remote sensing in the same frequency range is provided by the multiwavelength water vapor dif-ferential absorption lidar (WALES; Wirth et al. 2009). WALES operates at four wavelengths near 935 nm to measure water vapor mixing ratio profiles cover-ing the whole atmosphere below the aircraft, and is located between the two components of HAMP in position b (Fig. 1). At typical flight speeds it has a resolution of 200 m in the vertical and 6 km in the horizontal. The system also contains additional
aerosol channels at 532 and 1,064 nm with depolar-ization. WALES uses a high-spectral-resolution tech-nique, which distinguishes molecular from particle backscatter, to make direct extinction measurements with a resolution of 15 m in the vertical and 200 m in the horizontal. A detailed description of the WALES system is provided by Wirth et al. (2009).
The remote sensing systems are complemented by a dropsonde capability, whereby HALO is equipped to launch Vaisala RD-94 sondes using an “Airborne Vertical Atmospheric Profiling System” (Hock and Franklin 1999). As reported by Wang et al. (2015), the sondes measure temperature with an accuracy of 0.2°C, humidity with an accuracy of 2% RH, and pressure with an accuracy of 0.4 hPa. Winds are derived from GPS measurements with an estimated accuracy of 0.1 m s–1. During the NARVAL campaigns
the receiver could track four sondes simultaneously. For the measured descent time of about 750 s from a drop altitude of 9.5 km, the capability of the receiver allows a sonde to be launched roughly every three and a half minutes.
THE NARVAL EXPEDITIONS. The cloud
ob-servatory configuration of HALO has mostly been developed and evaluated through two NARVAL expeditions. NARVAL1 consisted of 15 research flights: 8 during December 2013 over the winter trades of the tropical North Atlantic and 7 during January 2014 over the storm tracks of the extratropi-cal North Atlantic. The second NARVAL (NARVAL2) consisted of 10 research flights during August 2016 in and around the western extension of the Atlantic intertropical convergence zone (Fig. 2). Shortly after NARVAL2, HALO (with the NARVAL payload) took part in the North Atlantic Waveguide Downstream Experiment (NAWDEX) mission, flying again over the extratropical storm-track region of the North Atlantic (Schäfler et al. 2018). The tropical flights were motivated by the desire to provide spatial con-text for ongoing ground-based measurements at the Barbados Cloud Observatory, which was established to test cloud-feedback hypotheses (Stevens et al. 2016). The capabilities of HALO as a cloud observatory are highlighted through a presentation of the sixth re-search flight (RF06) of NARVAL2 because in addition to the extensive complement of remote sensing, which was common to all NARVAL flights, it was one of two flights which extensively explored new methods of measuring large-scale vertical velocity using a high density of dropsonde measurements.
A synopsis of all NARVAL flights is provided in Table 2, and the location of dropsonde measurements
among the different cam-paigns is show in Fig. 2. The relative proximity of many of the NARVAL2 flights to the ITCZ, as compared to the NARVAL1 tropical flights, is evident. Over the 25 flights composing NARVAL1 and NARVAL2, 329 d ropsondes were launched, and 15 A-Train underpasses were flown in a variety of conditions. Further details for spe-cific flights are provided by Klepp et al. (2015), for NARVAL1, and from flight reports for NARVAL2. CHAR ACTERIZING
CLOUDS . An
under-standing of how clouds
in-teract with their environment requires an ability to quantify how water condensate is distributed through the atmosphere, and to measure the dynamic and thermodynamic properties of the atmosphere in which the clouds are embedded. This is necessary to both test hypotheses as to how clouds are controlled by their environment (Bony et al. 2017) and to evaluate a new generation of models that begin to resolve cloud-scale circulations over large domains and in realistic cir-cumstances (Miyamoto et al. 2013; Klocke et al. 2017). Critical observational tests of these models are rare (cf. Stevens and Lenschow 2001). Despite numerous measurement campaigns, the quantification of strato-cumulus entrainment from the Second Dynamics and Chemistry of the Marine Stratocumulus field study (DYCOMS II) measurements (Stevens et al. 2003, 2005) is the only example of such a test of which we are aware.
Cloud condensate. An unambiguous measure of a
cloudiness, and something a cloud observatory should be able to quantify, is the amount of water conden-sate in the atmosphere. In the lower atmosphere this is measured by the liquid water path (LWP). Liquid water from clouds and precipitation emit a warm signal in contrast to the radiatively cold ocean in the microwave part of the electromagnetic spectrum. With such a clear signal, satellite microwave mea-surements (made now for 30 years) provide the only real climatological information on LWP. Recently, Elsaesser et al. (2017) published the first multisensor climatology of LWP. However, with footprints of a few
Fig. 2. Distribution of sonde launches for NARVAL1 (Dec 2013, Jan 2014)
and NARVAL2 (Aug 2016) flights. Shaded is the position of the ITCZ and the storm-track region (blue) in Dec 2013 and the ITCZ (red) in Aug 2016. The ITCZ is defined to be regions with precipitation greater than 9 mm day–1, the
storm tracks by the regions with precipitation greater than 6 mm day–1. The
boundaries of these regions are smoothed before plotting.
tens of kilometers, satellite retrievals are susceptible to beamfilling issues and assumptions in the parti-tioning between cloud and rainwater (Seethala and Horváth 2010; Greenwald et al. 2018), which combine uncertainties arising from a poorly constrained back-ground and make the retrievals uncertain.
The relatively narrow field of view of the passive and active microwave (HAMP) instruments, which can even be screened for any fractional cloud cover using high-resolution imagery by specMACS, makes them well suited to retrieve distributions of cloud con-densate. This advantage of the HALO measurements, as compared to satellite remote sensing, is illustrated by Fig. 3. It shows retrievals from the HALO-borne microwave radiometers for two flight segments during RF06. These coincide with AMSR2 (Figs. 3a,b) and GMI (Figs. 3c,d) overpasses. The figure presents, in plan view, the satellite-retrieved LWP fields (Figs. 3a,c), and compares these to the HALO retrievals along the flight track (Figs. 3b,d). The HALO measurements demonstrate the ability of HAMP to detect very low (50 g m–2) LWP, even detecting clouds that are only
barely detected by the radar (e.g., around 1640 UTC in Fig. 3b). By using the lidar signal to identify clear skies, a determination of the noise characteristics of HAMP allows for more precise estimates of cloud water. This helps bound retrievals of LWP from clouds whose signal is too small to rise above the background microwave noise, yet which are still reliably detected by optical instruments. In the cases when drizzle or rain is present (e.g., at 1930 UTC in Fig. 3d), it will
1065
JUNE 2019 AMERICAN METEOROLOGICAL SOCIETY |
be measured by the radar. This makes it possible to establish the relative contribution of the rainwater to the total retrieved LWP (Schnitt et al. 2017).
The type of multisensor synergy employed in HALO has also been used for spaceborne instruments. Greenwald et al. (2018) estimate the various uncertain-ty factors for microwave satellite LWP, using Moderate Resolution Imaging Spectroradiometer (MODIS) as ground truth and CloudSat to identify precipitation. Over the tropical oceans they found the net bias, in some cases, to be more than 50% of the mean LWP.
The much finer-scale NARVAL measurements, which include a MODIS-type LWP retrieval (as discussed below), allow a more in-depth investigation of these uncertainties. Even at these finer scales, however, cloud inhomogeneities often violate the assumptions used in many retrievals (see the sidebar “Cloud geo-metric effects on microphysical retrievals”), but here at least, the ability to view a cloud through many lenses offers opportunities to selectively perform the retriev-als on clouds, or cloud segments, that best satisfy the assumptions of the underlying retrievals.
Fig. 3. Exemplary LWP time series of about 10 min illustrating the intermittent nature of the typical liquid
clouds encountered during NARVAL2, RF06. (a),(c) The flight track superimposed on the large-scale LWP field as derived from microwave measurements associated with satellite overpasses separated in time by about 4.5 h. (b),(d) The aircraft-derived LWP for the flight segments shown in (a) and (c), respectively. Two satellite products are shown for reference, one from the GMI, the other from the Multisensor Advanced Climatology of Liquid Water Path (MAC-LWP; Elsaesser et al. 2017). Cloud radar profiles shown classify the AMSR-E underflight in (b) as nonprecipitating while the GMI underflight in (d) includes several rain shafts. Note that due to the time difference to GMI the system is shifted in space. The time period between 1642 and 1645 UTC is highlighted in (b) as it is discussed in subsequent analysis.
CLOUD GEOMETRIC EFFECTS ON MICROPHYSICAL RETRIEVALS
R
etrievals of cloud optical and micro-physical properties from reflected radiances (Nakajima and King 1990) are designed for horizontally uniform un-bounded clouds, and for a good reason: cloud boundaries, and inhomogeneity more generally, bias retrievals in ways that are difficult to correct. So how big does an otherwise homogeneous cloud have to be for its microphysical prop-erties to be accurately retrieved using the methods described in the text? To answer this question, we performed a simple numerical experiment using a radiative transfer code that quantifies three-dimensional effects, the Monte Carlo code for the physically correct tracing of photons in cloudy atmo-spheres (MYSTIC; Mayer 2009). We consider virtual observations of an idealized cylindrical cloud of diameter d and vertical extent 500 m (Fig. SB1, top). Cloud microphysical properties were chosen as typical for trade wind cumulus clouds, and assumed to be uniform throughout the cloud.Even before performing any retrieval, a simple comparison of the reflected radiation with that expected for a plane-parallel cloud (black lines) reveals large biases near cloud edges—which for a small cloud is everywhere. In the example, with high sun (0° solar zenith angle) these biases arise because of the loss of radiation through the cloud sides, which causes reflectivity deficits that (for clouds on the kilome-ter scale) reach well into the center of the cloud. At lower sun angles photons can be scattered into the field of view causing the clouds to appear brighter than they would otherwise be expected to be. To quantify these geometric effects, a simple two wavelengths (0.8 and 2.1 µm) retrieval was developed, consist-ing of a dense lookup table of radiance pairs as a function of
ql and re. By design the retrieval
works perfectly for homoge-neous, unbounded, plane-parallel clouds. Here we show what happens for bounded clouds, whereby geometric effects from cloud edges lead to large biases that extend well into the cloud. For the case of the 1-km cloud, even at the center of the cloud these geometric effects lead to
a substantial underestimation of ql. Retrievals of re are less impacted, which
is beneficial for Nd as it is proportional
to re–3. Even so, Nd is substantially
un-derestimated across the entirety of the cloud for small clouds at high noon.
At the ends of the day geometric effects become even more challenging for retrievals. Repeating the calcula-tions for a lower (60°) sun angle shows that errors no longer compensate. On the sunward side of the cloud ql is overestimated while re is
underestimat-ed. Errors of the opposite sense are evident on the dark side of the cloud. Because these effects are nonlinear they can still be quite large even when averaged across the cloud. This simple
example shows that to determine meaningful values for Nd it is necessary
to concentrate on the centers of the larger clouds, where “large” means considerably larger than 1 km. Even then, it is important to mind the gaps and stay well away from cloud edges. To be able to do that, high-resolution, two-dimensional images are required, as provided by specMACS (Fig. 5). Such images can help assess the magnitude of the 3D effects for each individual case, taking into account sun and cloud geometry, and including information from instruments which are less af-fected by 3D radiative transfer, such as the microwave radiometer and the active instruments.
Fig. SB1. Simulated retrieval for an idealized 1- and 4-km-diameter
cylindri-cal cloud. Retrievals are presented for two sun incidence angles, on a scylindri-cale normalized by the cloud diameter. For both clouds the depth is the same and cloud microphysical properties are idealized as following monodisperse droplet distribution with ql = 0.35 gm–3 and Nd = 84 cm–3. The idealizations help
An example of the synergies between radar and lidar (see the sidebar “Synergistic use of radar and lidar to derive ice cloud microphysical properties”) is the use of radar and lidar to perform ice water content retrievals even in regions of the cloud where the cloud is only visible to one instrument. These
retrievals underpin the attractiveness of the “cloud observatory” configuration of HALO for satellite calibration and validation studies.
The meteorological environment. Dropsondes were used during NARVAL2 to characterize the thermodynamic
are retrieved in the upper part of the clouds which are transparent to the radar. These types of measurements help us look toward forthcoming satellite missions. Notably the European Space Agency–Japan Aerospace Exploration Agency (ESA–JAXA) Earth Cloud Aerosol Radiation Experiment (EarthCARE) will operate an advanced lidar and cloud radar system from a single satellite platform, and is well poised to benefit from the retrievals we develop and test using data form the NARVAL expeditions.
D
ue to their wavelength differences, lidar and cloud radar measurements are sensitive to different particle sizes. Their measurements of aerosol and cloud layers are thus comple-mentary. The radar, sensitive to large particles, provides in-formation on optically thick clouds (water clouds and thick ice clouds) and precipitation. For these thicker clouds the lidar has only very limited penetration depth and so does not see very far into the clouds. By virtue of its sensitivity to small particles, the lidar provides information on aerosols, optically thin ice clouds, or shallow water cloudswhich the radar is not sensitive to and in some cases does not see at all. Figure SB2 illustrates the complementary sensitivity of these two instruments from measure-ments for an ice cloud measured during the HALO flight on 16 December 2013. The lidar (Fig. SB2a) images more of the cloud area, as the radar (Fig. SB2b) is only sensitive to regions of higher ice water content.
Having the two instruments mounted on a common platform makes it easier to ensure the co-incidence of their respective mea-surements, and thus get the most out of retrievals. For instance, whereas retrievals based on the ratio of the lidar backscatter coefficient to the radar reflectivity are limited to regions where both measurements overlap, opti-mal estimation approaches can retrieve ice cloud microphysical properties (e.g., effective radius and ice water content) also when in parts of the cloud seen by only one instrument. This is shown in Fig. SB2c, using the variational optimal estimation approach introduced by Delanoë and Hogan (2008) and adapted to our multi-wavelength aircraft applications by Cazenave et al. (2018, manuscript submitted to Atmos. Meas. Tech.
Discuss.). Ice water measurements
SYNERGISTIC USE OF RADAR AND LIDAR TO DERIVE
ICE CLOUD MICROPHYSICAL PROPERTIES
Fig. SB2. Collocated (a) backscatter ratio measured with the WALES lidar
system and (b) radar reflectivity measured with the HAMP cloud radar between 2000 and 2100 UTC 16 Dec 2013 (RF06 of the NARVAL1 tropical flights), and (c) ice water content retrieved with the variational optimal estimation approach.
environment in which clouds form. The flight pat-tern in RF06, as shown in Fig. 4a, highlights new techniques developed during NARVAL2 to test the ability of dropsonde measurements to also constrain the cloud dynamic environment.
NARVAL2 tested whether a suitable deployment of dropsondes could meaningfully constrain the large-scale vorticity and divergence of the hori-zontal wind (Bony and Stevens 2019) whereby the large-scale vertical wind is given by the integral of the divergence. The method was evaluated through repeated measurements in pairs of circular flight patterns over the same air mass, by comparing results to storm-resolving simulations, and by inde-pendent measures of the vertical component of the wind velocity—for instance by Lagrangian tracking of water vapor features. Two pairs of circles were flown to test the method in RF03 and RF06. Bony and Stevens (2019) showed that reasonably accurate estimates of the vertical velocity (see Figs. 4b,c) can be reconstructed from around 12 sondes dropped over an area of around 1.5° × 1.5°. The measurements show the capability of providing detailed information on the finescale vertical structure of the horizontal-wind divergence, and even from as few as six to eight strategically dropped sondes, useful information on the structure of the large-scale wind can be inferred.
It is informative to compare the vertical motion estimates from the sondes (Fig. 4) with LWP derived
from satellite measurements. At the time of the AMSR2 overpass, the first pair of circles (in the southwest) had been flown, mostly subtending an area characterized by the low values of AMSR2-retrieved LWP evident south of 15°N in Fig. 3a. A substantially greater LWP is evident in the second set of circles, that is, as seen in the GMI-retrieved LWP (Fig. 3c). In both cases this is consistent with the measurements of the vertical component of the large-scale wind. In the first pair of circles low-level divergence of the horizontal wind and large-scale descent (Fig. 4b) was measured. For the sec-ond set of circles (Fig. 4b) low-level convergence of the horizontal wind and large-scale ascent was measured.
Being able to measure the mean vertical velocity over a large (1° to 3°) area determines the convergence of mass, moisture, and enthalpy over this same area. Hence, this example shows how the thermodynamic and dynamic budgets of the area being surveyed by HALO can be determined at the same time as the remote sensing characterizes the cloud field.
Cloud coverage. Clouds are often characterized by their coverage. This measure of cloudiness is de-sirable because it helps inform how condensate is distributed in space, which is important for under-standing how clouds interact with radiation. Cloud coverage is, however, a poorly defined measure of cloudiness, as it requires that a continuous envelope (a cloud) be fit to what in the end is a dispersion of
Fig. 4. (a) MODIS image at the time of the A-Train overpass during RF06. The MODIS overpass is indicated
in red (for the time period between 1642 and 1645 UTC; Fig. 3b) and is bracketed by pairs of circular flight patterns designed to facilitate estimates of large-scale vertical motion from dropsonde wind measurements. (b),(c) Large-scale vertical velocity as derived from these sounding circles are illustrated, adapted from Bony and Stevens (2019).
1069
JUNE 2019 AMERICAN METEOROLOGICAL SOCIETY |
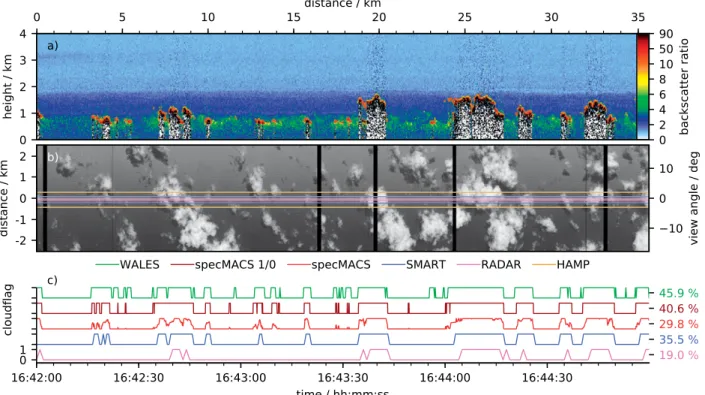
discrete objects (cloud particles). This distinction can have surprisingly large quantitative consequences, (e.g., Koren et al. 2007). Nonetheless, the concept of a cloud fraction proves difficult to dispense with. The remote sensing instrumentation on HALO makes it possible to estimate cloud coverage from a number of sensors. Figure 5 illustrates different estimates of cloud amount as seen along a subset of the flight path illustrated in Figs. 3a and 3b. Shown is a scene of three minutes duration, as measured from an altitude of 9 km. Figure 5a shows the vertical profile delivered from the lidar, and Fig. 5b provides a specMACS image. The entire scene is roughly commensurate with the size of a microwave satellite footprint. Overlaid are the fields of view from different sensors. Figure 5c shows cloud masks of the sensors with the corresponding numerical value of cloud fraction on the right. The dependence of cloud amount on the sensor chosen is another example of the power of the synergistic approach. In combination, the different sensitivities of active and passive techniques can better characterize the statistics of the condensate distribution. Whereas the microwave techniques
are more sensitive to liquid water and precipita-tion associated with more substantial clouds, the optical techniques yield more accurate cloud-cover statistics, including very thin and small clouds. The conservative estimates of clear skies provided by these instruments, for instance WALES, SMART, and specMACS, can then be used to quantify the noise characteristics of the other instruments, thus improving their retrieval.
Cloud microphysical properties. Another important and challenging cloud property to measure is Nd, the
cloud droplet population density; Nd is indicative of
the aerosol environment in which clouds form, some-thing that is necessary to quantify when assessing the strength of aerosol–cloud interactions (Grosvenor et al. 2018). Here, because it provides an example of the synergy across instruments and the advantages of the very high-resolution measurements HALO enables, we explore retrievals of Nd in more detail.
By combining SMART measurements with constraints from other sensors it is possible to infer Nd along with other microphysical properties
Fig. 5. Cloud scene from NARVAL2 RF06 flight segment outlined in Fig. 3a. (a) The backscatter ratio (WALES)
at 532 nm, (b) the specMACS measurements at 1,597 nm with the field of view of other instruments (HAMP radiometer, SMART, and HAMP radar) outlined, and (c) cloud masks along the path for WALES, specMACS, SMART, and the radar with total cloud fraction along segment included on the right margin. No cloud mask is given for HAMP, but its field of view is shown in anticipation of subsequent analysis. For specMACS the fractional cloud cover across the swath from ±1º around nadir is shown. To simulate a sensor with lower resolution and higher sensitivity, specMACS 1/0 shows a binary version of that fraction, counting a time step as cloudy if just a single pixel (from ±1º around nadir) detected a cloud.
of clouds. The principle of the technique follows the lookup table approach developed for satellite re-trievals (Nakajima and King 1990; Werner et al. 2013), whereby the opti-cal depth τ and effective radius of water droplets at cloud-top re are retrieved,
from which Nd can then be
inferred using the model described by Boers and Mitchell (1994). Their model assumes that i) Nd is
constant above cloud base; ii) that cloud droplets are gamma distributed in size, with a constant and known shape parameter α; and iii) that the liquid water content ql increases with
height in proportion to its adiabatic value γl. The
adi-abatic liquid water lapse-rate γl is a thermodynamic
quantity. For fair-weather clouds in the tropics it is about 2.2 g kg–1 km–1, with
a dependence on pressure and temperature (Rieck et al. 2012). As clouds are usually subadiabatic in ql,
an empirical correction is applied. Previous mea-surements of shallow trade wind convection justify a height-independent correction factor of β = 0.6. As clouds deepen beyond a few hundred meters, precipitation begins to develop, and the cloud droplet size distribution broadens (vanZanten et al. 2011); likewise, the assumption of constant β increasingly fails as clouds deepen beyond about 500 m.
The requirements for the retrieval mentioned above will not be satisfied for all cloud cases. In fact, estimating Nd in broken clouds using remote sensing is
a kind of Goldilocks problem. Clouds that are too small will have their retrievals biased from geometric effects (see the sidebar “Cloud geometric effects on micro-physical retrievals”), increasingly so at low sun angles. Clouds that are too large increasingly depart from the idealization of being nonprecipitating. By adding information from the other passive and active remote sensing instruments it becomes possible to selectively pick clouds that are large enough but not too large, and also derive constraints on the mixing parameter β— for instance, by comparing microwave-based LWP
measurements to that expected given cloud geometry. In addition, using independent LWP measurements from a combined spectrometer–microwave retrieval of re may further constrain the retrievals.
As described in more detail by Wolf et al. (2019), three methods were developed to estimate Nd. Method
A retrieves only τ and re using only SMART. For
method B the SMART-retrieved τ is replaced by the HAMP-retrieved LWP value. Method C uses full information about the cloud geometry obtained from the WALES and cloud radar measurements.
Following the theoretical study shown in the sidebar “Cloud geometric effects on microphysical retrievals,” cloud element size is of central impor-tance for the reliability of passive retrievals in the typical NARVAL cloud situations. This is facilitated by a careful cloud screening (e.g., using specMACS 2D data). The typical cloud element is a few hundred meters to a few kilometers in diameter. Effects of horizontal loss of radiation through the nearby cloud boundaries will always be present to some extent. In Fig. 6 showing the SMART retrievals it is thus likely that τ860 is biased to small values and re to large values.
This would also explain the observed difference
Fig. 6. Time series of SMART radiances and synergistic retrievals for 3-min
scene in Fig. 5. (a) Radiances at 860 and 1,600 nm, (b) retrieved optical depth at 860 nm, (c) retrieved effective radius near cloud top and associated (1σ)
uncertainty, (d) LWP from SMART and HAMP retrievals with propagated uncertainty, and (e) estimation of droplet population density Nd using
differ-ent combinations of sensors (methods A, B, and C) as explained in text and with propagated uncertainty (dashed).
1071
JUNE 2019 AMERICAN METEOROLOGICAL SOCIETY |
between HAMP and SMART LWP values. Based on these considerations the true Nd values are likely to be
at the upper end of the retrieved range of 60 cm–1. This
value appears plausible given in situ measurements from previous field campaigns in the same region (vanZanten et al. 2011; Siebert et al. 2013), but more work is clearly warranted.
Precipitation. Radar-derived precipitation measure-ments can be used to understand when clouds devel-op in ways that come into conflict with assumptions underpinning the microphysical retrievals discussed above. These measurements can also provide a criti-cal characterization of cloud microphysicriti-cal evolu-tion, and a basis for evaluating models, or testing hypothesized aerosol–cloud interactions (Lonitz et al. 2015).
As an example of the capability of HALO to ob-serve precipitation processes, and their relationship to other cloud properties, a simple first analysis of the precipitation statistics during the NARVAL expeditions was performed. An echo object was defined as precipitating if the echo extended below the lifting condensation level (as derived from
the nearest dropsonde). For example, the cloud objects detected by the radar in Fig. 3b would be characterized as nonprecipitating, while those in Fig. 3d would be characterized as precipitating. Overall only about 20% of the echoes are identified as precipitating, which given the sensitivity –31 dBZ (at 5 km) sensitivity of the radar (see Fig. 5) implies that precipitation is associated with an even smaller fraction of clouds.
This analysis suggests that once clouds deepen beyond about 700 m their chance of forming rain increases fourfold. This is shown in Fig. 7a, which presents the probability of precipitation in different vigintiles of the cloud-depth distribution. Unlike cloud depth, cloud-top height is a poor indicator of pre-cipitation, as many thin high clouds do not precipitate (Fig. 7b). The best indicator of precipitation is the maxi-mum reflectivity in an echo object, as almost all clouds with a maximum reflectivity larger than –15 dBZ have echoes that extend to the surface. The synergistic sensor approach, which for instance allows the simul-taneous probing of cloud microstructure and conden-sate path, might help answer why, even when clouds deepen sufficiently, not all form precipitation. That so many do suggests that as far as the microphysical retrievals are concerned, it may be challenging to find a Goldilocks cloud.
L A R G E - D O M A I N L A R G E - E D D Y
SIMULATION. In the
past few years it has become possible to apply the large-eddy simulation (LES) technique, once restricted to idealized situations, to realistic domains on the scale of several hundred to even a thousand kilometers (Heinze et al. 2017). In support of the NARVAL expeditions, simulations using the Icosahedral Nonhydrostatic (ICON) model (Zängl et al. 2015; Dipankar et al. 2015) with a 2,500-m mesh—span-ning the entire tropical Atlantic and much of tropical Africa and South America—were initialized
Fig. 7. Rank histograms, in vigintiles, of cloud properties as defined by the
HAMP cloud and precipitation radar. Cumulative distribution in rank order (lines; corresponding to left-axis scale) and precipitation probability p(P) (bars; measured on right). (a) Rank cloud depth, as measured by distance be-tween lifting condensation level and echo top; (b) echo top; and (c) maximum object reflectivity. The cumulative distribution lines are colored according to whether the object is identified as raining or not. The precipitation prob-abilities thus show the fraction of blue (raining) vs total points in each vigintile.
each day at 0000 UTC and ran forward in time for 36 h (Klocke et al. 2017). Over a large area of the western Atlantic a finer, 1,250-m mesh was nested for each of the simulations. This configuration of ICON can be run in real time to aid flight planning.
Finer-resolution (Δx = 155 m) simulations were also performed for 12 of the NARVAL research flights, 6 each from NARVAL1 and NARVAL2 (see Table 2). Figure 8 illustrates the simulation protocol
and domains, whereby three layers of further nesting are applied to the 1,250-m mesh, which results in a 155-m mesh simulation over an area (150 km × 400 km). The fixed computational domains were chosen to best overlap with areas of flight operations. Simulations on the hectometer scale begin to explic-itly represent cloud and convective processes of even shallow clouds. By simulating the scales of motion that HALO measures, we can assess the quality of
Table 2. Overview of NARVAL research flights. RF denotes the research flight for each campaign, No.
denotes the number of dropsondes launched, and AO denotes A-Train overpass time when applicable. NARVAL1 (tropical): 10–20 Dec 2013
RF Day Time (UTC) No. LES AO Brief description
01 10 1014–2041 14 1507 Ferry
02 11 1429–2158 6
ü
1724 Southward box—Spring toward ITCZ03 12 1350–2020 10
ü
1629 Trade wind–transition legs04 14 1335–2021 11
ü
1629 Trade wind–transition legs05 15 1515–2145 3
ü
1700 Trade wind–transition legs and maneuvers06 16 1310–2259 10
ü
1605 Ferry07 19 1005–1957 9 — Ferry, Falcon overflight
08 20 1620–0235 8
ü
1723 FerryNARVAL1 (extratropical): 7–22 Jan 2014
RF Day Time (UTC) No. LES AO Brief description
01 7 1208–1750 0 — Ferry
02 9 0814–1720 11 1529 Cold air outbreak, postfrontal low
03 12 0832–1510 12 — Tiltback occlusion
04 18 0855–1449 5 1344 Downstream development
05 20 1015–1845 5 — Weak cold-core convection
06 21 1052–1700 7 1415 Reintensified cold air
07 22 1002–1445 0 — Ferry
NARVAL2: 8–29 Aug 2016
RF Day Time (UTC) No. LES AO Brief description
01 8 0822–1859 9 1507 Ferry
02 10 1153–2047 30
ü
1709 ITCZ crossing03 12 1143–1937 50
ü
— Divergence, radar calibration04 15 1149–1946 10 1711 ITCZ crossing
05 17 1448–2307 12
ü
1701 Satellite validation (cirrus)06 19 1229–2053 53
ü
1648 Divergence, Northwest Tropical AtlanticStation (NTAS) buoy reconnaissance
07 22 1117–2058 13
ü
— Inner ITCZ (doldrums)08 24 1243–2055 12
ü
— Gaston—Deep convection (no radar)09 26 1344–2054 12 — Gaston—Shallow convection (no radar)
10 29 0944–1900 17 — Ferry, stratus circle (no radar)
1073
JUNE 2019 AMERICAN METEOROLOGICAL SOCIETY |
the model, and its assumptions, and at the same time provide a virtual database for testing sampling strate-gies and retrieval assumptions that are being applied to HALO’s observations.
LOOKING FORWARD. One obvious
shortcom-ing of HALO’s remote sensshortcom-ing payload durshortcom-ing the NARVAL expeditions was the lack of measurements covering wavelengths in the thermal infrared. Both upward and downward solar broadband irradiances can be derived from the spectrally resolved SMART sensors, but as far as the thermal infrared wave-length region is concerned, HALO was flying blind. As foreshadowed in Fig. 1, the remaining mount points on the aircraft will be used in the future to address this blind spot. Future expeditions will additionally include an infrared imager measur-ing at 7.7 and 12 µm—wavelengths associated with strong differential absorption changes from water condensate, which will help to retrieve cloud prop-erties and phase. Measuring at a wavelength in the
atmospheric window will make it possible to derive sea surface temperature in clear-sky conditions. The measurements will also complement lidar and O2
A-band-based cloud-top height estimates. In addi-tion, upward and downward broadband irradiances will be measured in both the thermal infrared and solar part of the spectrum. Future missions should also benefit from ongoing modifications to reduce the integration time of the microwave radiometers and to improve the sensitivity of the radar. These changes will allow both instruments to even better resolve clouds. Finally, a new dropsonde receiver will, through an ability to track eight sondes at once, allow a denser deployment of dropsondes.
The application of HALO as a flying cloud ob-servatory is planned as a central component of two forthcoming field studies: Elucidating the Role of Coupling among Clouds, Convection and Circulation (EUREC4A) and HALO Arctic Amplification:
Climate Relevant Atmospheric and Surface Pro-cesses, and Feedback Mechanisms [HALO-(AC)3].
Fig. 8. Nesting procedure to simulate area of flight operations during NARVAL. Starting from the interior
1.25-km nest of yet larger-scale simulations on a 2.5-km mesh, a three-step nesting procedure is applied to simulate the area of flight operations on a 150-m mesh. To enable spinup the simulations are initialized several hours before flight operations and integrated through the period of active measurements.
As part of EUREC4A, HALO will be paired with a
low-flying aircraft, the Aerei da Trasporto Regionale 42 (ATR-42), that is configured to better quantify the mass budget of the subcloud layer and cloudiness near cloud base (Bony et al. 2017). In situ measurements of clouds by the ATR-42 will help improve retrievals of microphysical properties of clouds using the HALO remote sensing. As part of the (AC)3 the HALO
cloud observatory will investigate mixed-phase cloud processes in the Arctic by measuring cloud transfor-mations accompanying the large-scale meridional airmass movements (warm air intrusions, cold air outbreaks). To do so a Lagrangian approach will be adopted, which is made possible by virtue of HALO’s endurance (Wendisch et al. 2017).
Together with the example application discussed above these campaigns illustrate the integrative aspects of “airborne observatories,” as they link scales, platforms, and communities in pursuit of scientific progress. Airborne observatories link scales by pro-viding observations directly at the scales of interest for cloud–circulation coupling (i.e., large-scale vertical motion and small-scale cloud processes and dynamics) and for modeling. They link platforms be-cause they are both “low-flying satellites” and “flying ground-based observatories,” which makes it possible to connect and evaluate satellite, ground-based, and in situ measurements. Finally they link communities. Not only do these types of campaigns bring together high-resolution modeling of precisely those scales and processes that are observed, thereby enhancing the bandwidth between simulation and observational science, but they also provide a platform for engaging young scientists in remote regions of the world in efforts to probe the atmosphere. As such, HALO as a flying cloud observatory also serves as an ambassador for atmospheric and climate science.
By fully embracing the power of remote and auton-omous sensing, the cloud observatory configuration of HALO shows how, by using just a single aircraft, it should be possible to target measurements of at-mospheric water (in all its phases) and its interaction with circulation systems in ways that were not previ-ously possible. Such measurements can help advance understanding of how the atmosphere works, identify processes which regulate its distribution of clouds, and test an emerging new generation of weather prediction and climate models.
ACKNOWLEDGMENTS. This work was supported by the Max Planck Society, the Deutsche Forschungsge-meinschaft (DFG; German Research Foundation) through the HALO Priority Program SPP 1294, “Atmospheric and
Earth System Research with the Research Aircraft HALO (High Altitude and Long Range Research Aircraft)” and the European Research Council (ERC) project EUREC4A
(Grant Agreement 694768) of the EU’s Horizon 2020 Research and Innovation Programme. The Department of Civil Aviation in Barbados, Andrea Hausold, Katrin Witte, and the FX department of the DLR is thanked for their support of both projects. Norbert Noreiks is thanked for his help in drafting Fig. 1. We thank the editor, Cynthia Twohy, and two anonymous reviewers for their construc-tive input. AMSR2 and GMI data are produced by Remote Sensing Systems and were sponsored by the NASA AMSR-E Science Team and the NASA Earth Science funding. AMSR2, version 8, and GMI, version 8.2, data products were retrieved online (www.remss.com).
REFERENCES
Ackerman, T. P., and G. M. Stokes, 2003: The Atmo-spheric Radiation Measurement program. Phys. Today, 56, 38–44, https://doi.org/10.1063/1.1554135. Anderson, J. B., 1931: Observations from airplanes
of cloud and fog conditions along the Southern California coast. Mon. Wea. Rev., 59, 264–270, https://doi.org/10.1175/1520-0493(1931)59<264: OFAOCA>2.0.CO;2.
Boers, R., and R. M. Mitchell, 1994: Absorption feedback in stratocumulus clouds: Influence on cloud top albedo. Tellus, 46A, 229–241, https://doi.org/10.3402 /tellusa.v46i3.15476.
Bony, S., and B. Stevens, 2019: Measuring area-averaged vertical motions with dropsondes. J. Atmos. Sci., 76, 767–783, https://doi.org/10.1175/JAS-D-18-0141.1. —, and Coauthors, 2017: EUREC4A: A field campaign
to elucidate the couplings between clouds, convection and circulation. Surv. Geophys., 36, 73–40, https:// doi.org/10.1007/s10712-017-9428-0.
Cooper, A., B. Johnson, E. Ragni, L. Summers, and N. Zrubek, 1989: Scientific justification and develop-ment plan for a mid-sized jet research aircraft. NCAR Tech. Note NCAR/TN-337+EDD, 70 pp., https://doi .org/10.5065/D62B8VZX.
Delanoë, J., and R. J. Hogan, 2008: A variational scheme for retrieving ice cloud properties from combined radar, lidar, and infrared radiometer. J. Geophys. Res., 113, D07204, https://doi.org/10.1029/2007JD009000. Dipankar, A., B. Stevens, R. Heinze, C. Moseley, G.
Zängl, M. Giorgetta, and S. Brdar, 2015: Large eddy simulation using the general circulation model ICON. J. Adv. Model. Earth Syst., 7, 963–986, https:// doi.org/10.1002/2015MS000431.
Elsaesser, G. S., C. W. O’Dell, M. D. Lebsock, R. Bennartz, T. J. Greenwald, and F. J. Wentz, 2017: The
1075
JUNE 2019 AMERICAN METEOROLOGICAL SOCIETY |
Multisensor Advanced Climatology of Liquid Water Path (MAC-LWP). J. Climate, 30, 10 193–10 210, https://doi.org/10.1175/JCLI-D-16-0902.1.
Ewald, F., T. Kölling, A. Baumgartner, T. Zinner, and B. Mayer, 2016: Design and characterization of spec-MACS, a multipurpose hyperspectral cloud and sky imager. Atmos. Meas. Tech., 9, 2015–2042, https:// doi.org/10.5194/amt-9-2015-2016.
—, S. Gross, M. Hagen, L. Hirsch, J. Delanoë, and M. Bauer-Pfundstein, 2019: Calibration of a 35 GHz air-borne cloud radar: Lessons learned and intercompari-sons with 94 GHz cloud radars. Atmos. Meas. Tech., 12, 1815–1839, https://doi.org/10.5194/amt-12-1815-2019. Greenwald, T. J., R. Bennartz, M. Lebsock, and J.
Teixeira, 2018: An uncertainty data set for passive mi-crowave satellite observations of warm cloud liquid water path. J. Geophys. Res. Atmos., 123, 3668–3687, https://doi.org/10.1002/2017JD027638.
Grosvenor, D. P., and Coauthors, 2018: Remote sensing of droplet number concentration in warm clouds: A review of the current state of knowledge and per-spectives. Rev. Geophys., 105, 6837–6845, https://doi .org/10.1029/2017RG000593.
Heinze, R., and Coauthors, 2017: Large-eddy simula-tions over Germany using ICON: A comprehensive evaluation. Quart. J. Roy. Meteor. Soc., 143, 69–100, https://doi.org/10.1002/qj.2947.
Hock, T. F., and J. L. Franklin, 1999: The NCAR GPS dropwindsonde. Bull. Amer. Meteor. Soc., 80, 407–420, https://doi.org/10.1175/1520-0477(1999) 080<0407:TNGD>2.0.CO;2.
Illingworth, A. J., and Coauthors, 2007: Cloudnet. Bull. Amer. Meteor. Soc., 88, 883–898, https://doi .org/10.1175/BAMS-88-6-883.
—, and Coauthors, 2015: The EarthCARE satellite: The next step forward in global measurements of clouds, aerosols, precipitation, and radiation. Bull. Amer. Meteor. Soc., 96, 1311–1332, https://doi .org/10.1175/BAMS-D-12-00227.1.
Klepp, C., F. Ament, S. Bakan, L. Hirsch, and B. Stevens, 2015: NARVAL campaign report. Max Planck Insti-tute for Meteorology Tech. Rep. 164, 218 pp. Klocke, D., M. Brueck, C. Hohenegger, and B. Stevens,
2017: Rediscovery of the doldrums in storm-resolving simulations over the tropical Atlantic. Nat. Geosci., 10, 891–896, https://doi.org/10.1038 /s41561-017-0005-4.
Koren, I., L. A. Remer, Y. J. Kaufman, Y. Rudich, and J. V. Martins, 2007: On the twilight zone between clouds and aerosols. Geophys. Res. Lett., 34, L08805, https://doi.org/10.1029/2007GL029253.
Laursen, K. K., D. P. Jorgensen, G. P. Brasseur, S. L. Ustin, and J. R. Huning, 2006: HIAPER: The next
generation NSF/NCAR research aircraft. Bull. Amer. Meteor. Soc., 87, 896–910, https://doi.org/10.1175 /BAMS-87-7-896.
Lonitz, K., B. Stevens, L. Nuijens, V. Sant, L. Hirsch, and A. Seifert, 2015: The signature of aerosols and meteorology in long-term cloud radar observations of trade wind cumuli. J. Atmos. Sci., 72, 4643–4659, https://doi.org/10.1175/JAS-D-14-0348.1.
Malkus, J. S., C. Ronne, and M. Chaffe, 1961: Cloud patterns in Hurricane Daisy, 1958. Tellus, 13, 8–30, https://doi.org/10.3402/tellusa.v13i1.9439.
Mapes, B. E., and R. A. Houze, 1995: Diabatic divergence profiles in western Pacific mesoscale convective systems. J. Atmos. Sci., 52, 1807–1828, https://doi .org/10.1175/1520-0469(1995)052<1807:DDPIWP >2.0.CO;2.
Mayer, B., 2009: Radiative transfer in the cloudy at-mosphere. Eur. Phys. J. Conf., 1, 75–99, https://doi .org/10.1140/epjconf/e2009-00912-1.
Mech, M., E. Orlandi, S. Crewell, F. Ament, L. Hirsch, M. Hagen, G. Peters, and B. Stevens, 2014: HAMP— The microwave package on the High Altitude and Long Range Research Aircraft (HALO). Atmos. Meas. Tech., 7, 4539–4553, https://doi.org/10.5194 /amt-7-4539-2014.
Miyamoto, Y., Y. Kajikawa, R. Yoshida, T. Yamaura, H. Yashiro, and H. Tomita, 2013: Deep moist atmospheric convection in a subkilometer global simulation. Geophys. Res. Lett., 40, 4922–4926, https://doi.org/10.1002/grl.50944.
Nakajima, T., and M. D. King, 1990: Determination of the optical thickness and effective particle radius of clouds from reflected solar radiation measurements. Part I: Theory. J. Atmos. Sci., 47, 1878–1893, https:// doi.org/10.1175/1520-0469(1990)047<1878:DOTOTA >2.0.CO;2.
Rieck, M., L. Nuijens, and B. Stevens, 2012: Marine boundary layer cloud feedbacks in a constant relative humidity atmosphere. J. Atmos. Sci., 69, 2538–2550, https://doi.org/10.1175/JAS-D-11-0203.1.
Schäfler, A., and Coauthors, 2018: The North Atlantic Waveguide and Downstream Impact Experiment. Bull. Amer. Meteor. Soc., 99, 1607–1637, https://doi .org/10.1175/BAMS-D-17-0003.1.
Schnitt, S., E. Orlandi, M. Mech, A. Ehrlich, and S. Crewell, 2017: Characterization of water vapor and clouds during the Next-Generation Aircraft Remote Sensing for Validation (NARVAL) south studies. IEEE J. Sel. Top. Appl. Earth Obs. Remote Sens., 10, 3114–3124, https://doi.org/10.1109/JSTARS .2017.2687943.
Seethala, C., and Á. Horváth, 2010: Global assessment of AMSR-E and MODIS cloud liquid water path
retrievals in warm oceanic clouds. J. Geophys. Res., 115, D13202, https://doi.org/10.1029/2009JD012662. Siebert, H., and Coauthors, 2013: The fine-scale struc-ture of the trade wind cumuli over Barbados—An introduction to the CARRIBA project. Atmos. Chem. Phys., 13, 10 061–10 077, https://doi.org/10.5194 /acp-13-10061-2013.
Stevens, B., and D. H. Lenschow, 2001: Observations, experiments, and large eddy simulation. Bull. Amer. Meteor. Soc., 82, 283–294, https://doi.org/10.1175 /1520-0477(2001)082<0283:OEALES>2.3.CO;2. —, and Coauthors, 2003: Dynamics and Chemistry
of Marine Stratocumulus—DYCOMS-II. Bull. Amer. Meteor. Soc., 84, 579–594, https://doi.org/10.1175 /BAMS-84-5-579.
—, and Coauthors, 2005: Evaluation of large-eddy simulations via observations of nocturnal marine stratocumulus. Mon. Wea. Rev., 133, 1443–1462, https://doi.org/10.1175/MWR2930.1.
—, and Coauthors, 2016: The Barbados Cloud Ob-servatory: Anchoring investigations of clouds and circulation on the edge of the ITCZ. Bull. Amer. Meteor. Soc., 97, 787–801, https://doi.org/10.1175 /BAMS-D-14-00247.1.
Stephens, G. L., and Coauthors, 2002: The CloudSat mission and the A-Train. Bull. Amer. Meteor. Soc., 83, 1771–1790, https://doi.org/10.1175/BAMS-83-12-1771. vanZanten, M. C., and Coauthors, 2011: Controls
on precipitation and cloudiness in simulations of trade-wind cumulus as observed during RICO. J. Adv. Model. Earth Syst., 3, M06001, https://doi .org/10.1029/2011MS000056.
Wang, J. J., and Coauthors, 2015: A long-term, high-quality, high-vertical-resolution GPS dropsonde dataset for hurricane and other studies. Bull. Amer. Meteor. Soc., 96, 961–973, https://doi.org/10.1175 /BAMS-D-13-00203.1.
Wendisch, M., D. Müller, D. Schell, and J. Heintzenberg, 2001: An airborne spectral albedometer with active horizontal stabilization. J. Atmos. Oceanic Technol.,
18, 1856–1866, https://doi.org/10.1175/1520-0426 (2001)018<1856:AASAWA>2.0.CO;2.
—, and Coauthors, 2016: ACRIDICON–CHUVA campaign: Studying tropical deep convective clouds and precipitation over Amazonia using the new German research aircraft HALO. Bull. Amer. Meteor. Soc., 97, 1885–1908, https://doi.org/10.1175/BAMS -D-14-00255.1.
—, and Coauthors, 2017: Understanding causes and effects of rapid warming in the Arctic. Eos, Trans. Amer. Geophys. Union, 98, 22–26, https://doi .org/10.1029/2017EO064803.
Werner, F., H. Siebert, P. Pilewskie, T. Schmeissner, R. A. Shaw, and M. Wendisch, 2013: New airborne retrieval approach for trade wind cumulus proper-ties under overlying cirrus. J. Geophys. Res. Atmos., 118, 3634–3649, https://doi.org/10.1002/jgrd.50334. Wirth, M., A. Fix, P. Mahnke, H. Schwarzer, F. Schrandt,
and G. Ehret, 2009: The airborne multi-wavelength water vapor differential absorption lidar WALES: System design and performance. Appl. Phys., 96B, 201–213, https://doi.org/10.1007/s00340-009-3365-7. Wofsy, S. C., and Coauthors, 2011: HIAPER Pole-to-Pole
Observations (HIPPO): Fine-grained, global-scale measurements of climatically important atmo-spheric gases and aerosols. Philos. Trans. Roy. Soc., 369A, 2073–2086, https://doi.org/10.1098/rsta.2010 .0313.
Wolf, K., A. Ehrlich, M. Jacob, S. Crewell, M. Wirth, and M. Wendisch, 2019: Improvement of airborne retrievals of cloud droplet number concentration of trade wind cumulus using a synergetic approach. Atmos. Meas. Tech., 12, 1635–1658, https://doi.org /10.5194/amt-12-1635-2019.
Zängl, G., D. Reinert, P. Rípodas, and M. Baldauf, 2015: The ICON (Icosahedral Non-Hydrostatic) modelling framework of DWD and MPI-M: Description of the non-hydrostatic dynamical core. Quart. J. Roy. Meteor. Soc., 141, 563–579, https://doi.org/10.1002 /qj.2378.
1077
JUNE 2019 AMERICAN METEOROLOGICAL SOCIETY |