HAL Id: hal-00112004
https://hal.archives-ouvertes.fr/hal-00112004
Preprint submitted on 17 Nov 2006HAL is a multi-disciplinary open access archive for the deposit and dissemination of sci-entific research documents, whether they are pub-lished or not. The documents may come from teaching and research institutions in France or abroad, or from public or private research centers.
L’archive ouverte pluridisciplinaire HAL, est destinée au dépôt et à la diffusion de documents scientifiques de niveau recherche, publiés ou non, émanant des établissements d’enseignement et de recherche français ou étrangers, des laboratoires publics ou privés.
J1720-318: a transition from high-soft to low-hard state
Sylvain Chaty
To cite this version:
Sylvain Chaty. Multi-wavelength observations of the microquasar XTE J1720-318: a transition from high-soft to low-hard state. 2006. �hal-00112004�
hal-00112004, version 1 - 17 Nov 2006
XTE J1720-318: a transition from high-soft to
low-hard state
Sylvain Chaty∗†
AIM - Astrophysique Interactions Multi-échelles (UMR 7158 CEA/CNRS/Université Paris 7 Denis Diderot), CEA Saclay, DSM/DAPNIA/Service d’Astrophysique, Bât. 709, L’Orme des Merisiers, FR-91191 Gif-sur-Yvette Cedex, France.
E-mail:chaty@cea.fr
To gain a better understanding of high-energy Galactic sources, we observed the Galactic X-ray binary and black hole candidate XTE J1720-318 in the optical and near-infrared, just after the onset of its X-ray outburst in January, 2003. These observations were obtained with the ESO/NTT as a Target of Opportunity, in February and April 2003. We performed an accurate astrometry and analysed photometrical observations. We then produced a colour-magnitude diagram, looked at the overall evolution of the multi-wavelength light curve, and analysed the spectral energy distribution. We discovered the optical counterpart in the R-band (R ∼ 21.5) and confirmed the near-infrared counterpart. We show that, for an absorption between 6 and 8 magnitudes, XTE J1720-318 is likely to be an intermediate mass X-ray binary located at a distance between 3 and 10 kpc, hosting a main sequence star of spectral type between late B and early G. Our second set of observations took place simultaneously with the third secondary outburst present in X-ray and near-infrared light curves. The evolution of its spectral energy distribution shows that XTE J1720-318 entered a transition from a high-soft to a low-hard state in-between the two observations. We finally discuss the different phases of the outburst of this source in the general scheme of outbursts from microquasars.
VI Microquasar Workshop: Microquasars and Beyond September 18-22 2006
Società del Casino, Como, Italy
∗Speaker.
1. Discovery and characteristics of XTE J1720-318
X-ray binaries are constituted of a compact object and a companion star, the former attracting matter from the later, either through an accretion disc or the wind. They are usually divided in 2 sub-classes: high mass X-ray binaries and low mass X-ray binaries, hosting early-type and late-type stars, respectively. Since accretion and ejection phenomena usually occur in these objects, they are ideal laboratories for studying relativistic phenomena and the formation and evolution of compact objects in binaries. However, to study them, we first have to derive the important parameters related to the nature of these systems, i.e. the distance, nature of the compact object, spectral type of the companion star, type of accretion, orbital parameters, etc. Because of the way they are formed, most of the observed Galactic X-ray binaries are located in the Galactic plane or even towards the Galactic centre, and therefore associated with very high absorption (up to
Av∼ 50 magnitudes) because of the presence of gas and dust in this region. In this case,
near-infrared (NIR) observations prove to be particularly useful, since the radiation is less absorbed at NIR wavelengths than at optical ones (see, e.g., (10)). Furthermore, X-ray binaries have to be studied in a multi-wavelength context to disentangle all parts of the system emitting at various wavelengths: the accretion disc from high-energies to NIR, the companion star from ultra-violet to NIR, the jets from radio to X-rays, etc. (see, e.g., (6)).
On January 9, 2003, the All Sky Monitor (ASM) of the Rossi-XTE satellite discovered a new source in the X-ray sky: XTE J1720-318, in the direction of the Galactic bulge, at 6◦ from the Galactic Centre. The 2-12 keV flux was initially ∼ 130 mCrab and reached ∼ 430 mCrab in one day, on January 10, 2003 (25). Spectroscopic observations with XMM-Newton were carried out on February 20, 2003, allowing (19) to estimate the column density of hydrogen on the line of sight:
NH= 1.33 × 1022cm−2. An iron line was detected at 6.2 keV with 95 eV equivalent width, and
no low or high frequency oscillation was detected (19). The 2-10 keV flux was estimated to be 1.6 × 10⁻⁹erg cm−2s−1 (15). The source was not detected during INTEGRAL/IBIS observations on February 28, 2003, but became visible at the end of the outburst during IBIS surveys of the Galactic centre from the end of March 2003 (14). The source reached ∼ 25 mCrab in the 15-40 keV band and became detected in the 40-100 keV energy band at ∼ 30 mCrab on April 6 and 7, 2003, indicating that the source had undergone a change of state, as suggested by (14). The high-energy observations suggest that the compact object is a black hole, first because of its early spectral evolution that was very similar to black hole ray transients (25), and also because of X-ray spectral parameters (5) and the presence of an iron line (19). A radio counterpart was discovered with the VLA on January 15, 2003, and confirmed with ATCA on January 16, 2003: only one radio source included in the Rossi-XTE error box significantly varied from 0.32 ± 0.04 to 4.9 ± 0.1 mJy at 4.9 GHz (27). Radio observations took place from January to August 2003, allowing (1) to study the correlation between radio and X-ray fluxes. A NIR counterpart was discovered then by (17) on January 18, 2003. Thirteen observations in J, H, and Ks, until May 21, 2003, allowed (21) to measure the exponential decay following the outburst, which was equal to 60 days.
In this paper, we will first describe our optical and NIR observations and data reduction in Sect. 2.1, then report on our astrometry and photometry results in Sect. 2.2. We will then focus on constraining the companion star spectral type in Sect. 3, and finally we will analyse the evolution of the XTE J1720-318 light curve and spectral energy distribution (SED) in Sect. 4. Readers who
want to have more details might refer to (7).
2. ESO Optical/NIR observations
2.1 Observations and data analysis
Our observations were carried out as part of the Target of Opportunity (ToO) programme 070.D-0340 (PI: S. Chaty) dedicated to the study of new Galactic high-energy sources and jet sources. They were triggered so as to be conducted at the same time as INTEGRAL ToO obser-vations, and we asked for two periods of observations. The first set of observations took place on February 28, 2003, and the second one on April 24, 2003. On February 28, 2003, we obtained NIR photometry in J-, H-, and Ks-bands with the spectra-imager SofI, and optical photometry in B-,
V -, R-, and I-bands with EMMI, both installed on the NTT (La Silla Observatory, Chile, European
Southern Observatory). We used the large field imaging of SofI’s detector, giving an image scale of 0.288" pixel−1 and a field of view of 4.94′× 4.94′, and the EMMI detector with an image scale
of 0.32" pixel−1and a binning 2 × 2, giving a field of view of 9.9′× 9.1′. Concerning the NIR ob-servations, we repeated one set of observations for each filter with 9 different 30" offset positions, including XTE J1720-318, with an integration time of 90 seconds for each exposure, following the standard jitter procedure that allows us to cleanly subtract the blank NIR sky emission. We observed two photometrical standard stars of the faint NIR standard star catalogue of (23): sj9157 on February 28, 2003, and sj9172 on April 24, 2003. Concerning the optical observations, we ac-quired 300 s exposures in each filter, except for the B-band (200 s), using a 2x2 binning to increase the sensitivity. We observed the standard star RU152 in R- and I-bands. Since we did not have any standard star observations in the B and V filters, we used mean zero-points taken from the EMMI website1. We used the Image Reduction and Analysis Facility (IRAF) suite to perform data reduc-tion, carrying out standard procedures of optical and NIR image reducreduc-tion, including flat-fielding and NIR sky subtraction. As we had only one standard star observation available for each night, we used characteristic extinction coefficients at la Silla: extB= 0.214, extV = 0.125, extR= 0.091,
extI= 0.051, extJ= 0.08, extH= 0.03, and extKs= 0.05, to transform instrumental magnitudes into apparent magnitudes. The observations were performed through an airmass between 1 and 1.4. 2.2 Astrometry and photometry results
We used the Ksimage of the XTE J1720-318 field taken on January 21, 2003 (22) to identify XTE J1720-318 in our NTT images. We then determined the position of the XTE J1720-318 NIR counterpart by deriving the astrometric solution, using ∼ 12 stars taken from the GSC2 catalogue: the position we measured was: α = 17h19m58.s988 ± 0.s008;δ = −31◦45′01.′′21 ± 0.′′15 (equinox
J2000). This position is consistent with other determinations (Table 1). We discovered the opti-cal counterpart in the R- and I-bands atα = 17h19m58.s994 ± 0.s007, δ = −31◦
45′01.′′46 ± 0.′′15 (equinox J2000), a position that is consistent with the NIR counterpart. We present BV RI magni-tudes in Table 2. The R and I magnimagni-tudes are consistent with detection limits given by (21): R > 18 and I > 16.5. We give a lower limit for the B- and V-bands, as we did not detect any counterpart in these bands. Since XTE J1720-318 is located close to the Galactic centre, we had to perform
This paper (21) (22)
α 17h19m58.s988 ± 0.s008 17h19m59.s000 ± 0.s014 17h19m58.s994 ± 0.s004
δ −31◦45′01.′′21 ± 0.′′15 −31◦45′01.′′2 ± 0.′′2 −31◦45′01.′′25 ± 0.05
Table 1: Summary of astrometry results (equinox J2000) for the XTE J1720-318 NIR counterpart.
Date MJD R I J H Ks
2003 02 28 52698 17.47 ± 0.05 - 16.00 ± 0.06
2003 04 24 52753 21.5 ± 0.3 20.6 ± 0.1 17.66 ± 0.05 16.99 ± 0.07 16.34 ± 0.05
Table 2: Apparent R, I, J, H, and Ks magnitudes of XTE J1720-318 (MJD = JD - 2400000.5).
XTE J1720-318 is not detected in B (> 23.2 ± 0.4) or V (> 23.1 ± 0.4).
crowded field photometry to obtain precise NIR magnitudes, using the noao.daophot package. This procedure, described in (20), consists of creating an empirical point-spread function with isolated bright stars, applying this model to the whole field, cancelling the contributions of neighbour stars, measuring the flux of the object itself, and then applying aperture correction (due to the use of a smaller aperture for measuring XTE J1720-318 magnitude than for standard stars). This procedure allows us to get photometry with better than 1% accuracy. We present the apparent J, H, and Ks magnitudes measured in February and April 2003 in Table 2. Uncertainties were determined from CCD readout and signal noise. We point out that we do not include the H-band observation of February 28, 2003, here because of bad sky subtraction.
Our NIR photometrical observations are reported in Fig. 1, where we also included results from (21). Our magnitudes, indicated by ’∗’, are consistent with measures from (21). We notice the similar behaviour of X-ray and NIR light curves, particularly during the first maximum when the coverage is more complete. Although similar, the NIR flux decayed less rapidly than the X-ray flux, as indicated by the red lines in Figure 1. This is a consequence of the accretion-disc instability model, where the optical and NIR emission emanates from the outer part of the accretion disc, which is kept hot enough long until the cooling front from inside reaches the outer part (18). We point out that we observed an increase in NIR on April 24, 2003 (MJD 52753), observed by chance at exactly the same time as an X-ray increase seen on the light curve. These ESO observations are therefore simultaneous to the 2 outbursts, as indicated by the red ellipses in Figure 1.
3. The nature of the binary system and companion star
We will now try to constrain the nature of the companion star with a colour-magnitude diagram (CMD). XTE J1720-318 optical and NIR magnitudes allow us to constrain the nature of the binary system by comparing its absolute magnitudes with those of well-determined spectral type stars (see, e.g., (10)). For this purpose, we use template absolute magnitudes related to spectral types (taken from (26)). The conversion of apparent magnitudes m to absolute magnitudes M depends on both distance d and interstellar absorption Av, via: M= m + 5 − 5logd(pc) − Av. Concerning the interstellar absorption, we have three different estimates: First, XMM-Newton spectroscopy ob-tained in February 2003 gave NH= 1.24 ± 0.02 × 1022cm−2(5). This column density corresponds
Figure 1: Multi-wavelength XTE J1720-318 light curve. From bottom to top: Rossi-XTE X-ray light curve
(indicated by diamonds); NIR J, H, and Kslight curves, respectively. NIR data taken from (21) are reported
with ’+’, and data from this paper with ’∗’ (MJD = JD - 2400000.5). The red lines indicate that the NIR flux decayed less rapidly than the X-ray flux, in agreement with the Disc Instability Model. The red ellipses indicate the time of our observations, allowing to reveal two simultaneous X-ray and NIR outbursts.
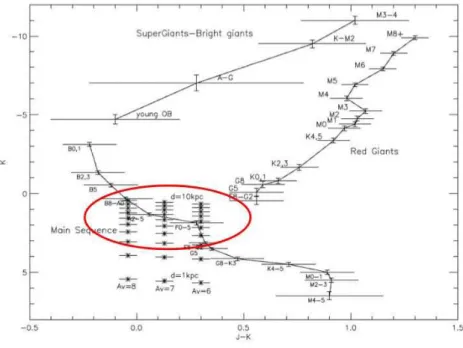
obtained Av= 8 by assuming a high temperature blackbody emission just after the X-ray outburst. They also noted that extinction derived from the 2MASS survey is Av∼ 6. Here, we will use only one observing epoch, on April 24, 2003, when the source is fainter, to minimise the accretion disc contribution in the observed NIR flux. Even if the object was still far from quiescence, in this way, we determine a lower limit for the companion star spectral type by assuming that the accretion disc emission reddens the NIR flux. To derive the possible spectral types, we computed the absolute magnitudes of XTE J1720-318, taking various distances d and absorption in the visible Av. The results are reported with ’∗’ in the (J − Ks, Ks) colour-magnitude diagram (CMD) presented in Fig. 2. The distance was computed between 1 and 10 kpc (from bottom to top, respectively) and the absorption between 6 and 8 magnitudes (from right to left, respectively).
From this CMD, we first derive that, in any case, the companion star must belong to the main sequence, the favoured region being indicated by the red ellipse. Furthermore, if the interstellar absorption is high, Av∼ 8 magnitudes, the spectral type would be between late B and early A, and
the source far away, between 6 and 10 kpc. With an intermediate value of the interstellar absorption,
Av∼ 7 magnitudes, the spectral type would be between late A and early F, and the distance between
Figure 2: Colour-magnitude diagram showing characteristic absolute magnitudes of various spectral
types and XTE J1720-318 absolute magnitudes computed for interstellar absorption Av between 6 and
8 magnitudes (’∗’ from right to left) and distance between 1 and 10 kpc (’∗’ from bottom to top). We used the April 24, 2003, observations, when the object was fainter, to reduce the accretion disc contribution in the NIR flux. From this CMD we can conclude that XTE J1720-318 is an intermediate mass X-ray binary located at a distance between 3 and 10 kpc, and that the companion star is a main sequence star of spectral type between late B and early G (see text for more details). The ellipse indicates the favoured region.
would be between late F to early G, and the distance between 3 and 6 kpc. Therefore, we can conclude that, for an absorption between 6 and 8 magnitudes, the XTE J1720-318 companion star is a main sequence star of spectral type between late B and early G, located at a distance between 3 and 10 kpc. This estimate of distance makes the source closer than suggested by (21): it is therefore possible that the source is not located in the Galactic bulge. We point out that from this analysis, XTE J1720-318 can be added to the list of intermediate mass X-ray binaries, like, e.g., V4641 Sgr (8).
4. Transition from high-soft to low-hard state
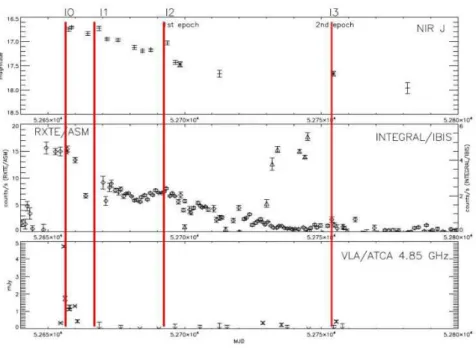
In Fig. 3, we show the overall outburst light curve of XTE J1720-318 from mid-January to the end of August 2003. First we can see that the light curve grossly has the form of a Fast-Rise Exponential-Decay light curve (so-called FRED) with a timescale of 60 days, but superimposed on this FRED, the source exhibits a complex behaviour: after the main outburst on January 16 (MJD 52656), we can see both in X rays and in NIR a secondary outburst on January 29 (MJD 52669), then a second one on February 22 (MJD 52693), and finally a third one on April 24, 2003 (MJD 52753), exactly at the time of our second epoch NIR observations. The main outburst
Figure 3: Multi-wavelength light curve showing the outburst of XTE J1720-318 and its transition from
high-soft to low-hard state. Top panel: NIR observations (’+’: (21), ’∗’: this paper); Middle panel: high-energy observations (’⋄’: RXTE/ASM, ’△’: INTEGRAL/IBIS, (5)); Bottom panel: radio VLA/ATCA observations (’x’: (1)). We indicated at the top the times when the main outburst (O) and the three secondary outbursts (1, 2, 3 respectively) occurred, indicated with red lines. MJD = JD - 2400000.5
and the last event are also associated with radio outbursts, and therefore with ejection events. We indicate the time of these events in Fig. 3 by O, 1, 2, and 3 in the top, respectively, and by the red lines. There are other sources that exhibit clear secondary maxima in their X-ray light curves, such as A0620-00, GS 1124-68, GRO J0422+32 (11), 4U 1543-47 (3), XTE J1550-564 (16) and XTE J1859+226 (2). However, XTE J1720-318 seems to be the second source after A0620-00 to exhibit clear multi-secondary maxima in the optical/NIR, correlated with the X rays, as seen in Fig. 3. This complex lightcurve and presence of multi-secondary outbursts might be explained by the accretion-disc instability model (such as an “outside-in”-type outburst).
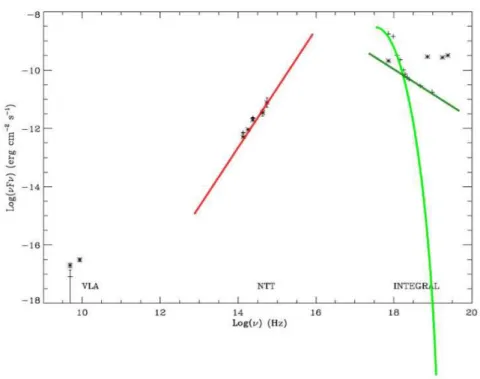
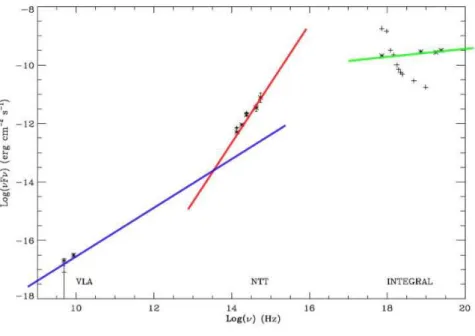
We also report the SED of XTE J1720-318 in Figures 4 and 5 for the two observing epochs (’+’ for February 28, 2003, and ’∗’ for April 24, 2003, respectively), where we put together quasi-simultaneous ESO/NTT optical/NIR observations from this paper, INTEGRAL/IBIS high-energy observations (5)), and ATCA/VLA radio data (1). We will now describe the light curve and both SEDs and analyse XTE J1720-318’s evolution between these two observing epochs.
4.1 The February 2003 epoch: high-soft state
Observations obtained with XMM-Newton, INTEGRAL/IBIS, and Rossi-XTE in February 2003 showed that the source spectrum was very soft (power law photon index ofΓ= 2.7): while the 2-12 keV flux was ∼ 100 mCrab, IBIS detected a source at only ∼ 2.1 mCrab in the 20-120 keV band (5). XTE J1720-318 was not detected in radio (≤ 0.27 mJy at 4.8 GHz, (1)), which is consistent
with typical high-soft state. This is corroborated by the analysis of XTE J1720-318 SED from February 28, to March 2, 2003 (reported with ’+’ in Fig. 4), where we notice the characteristic shape of the accretion disc emission in X-rays (strong flux and soft spectrum), and the absence of radio emission. We overplot in green the multi-colour black-body disc emission and the soft power law in X-rays, and in red the emission in optical and NIR.
4.2 The April 2003 epoch: low-hard state
On the other hand, after March 25, 2003 (MJD 52723), XTE J1720-318 hard X-ray flux as seen by INTEGRAL/IBIS increased by a factor of 100 with respect to the high-soft state (5), while the soft X-ray flux (RXTE/ASM) remained constant, as seen on the light curve of Fig. 3. Besides, we also observed a radio outburst (1), simultaneous with an X-ray outburst and an increase in the NIR flux. Therefore, XTE J1720-318 seems to have entered a transition towards a low-hard state in-between these 2 observing epochs, as suggested by (14). This is confirmed by the analysis of the SED (data of this second epoch are reported with ’∗’ in Fig. 5, where we overplot in green the hard power law in X rays, in red the emission in optical and NIR and in blue the power law in radio): the source shows all the usual signs of the low-hard state (see, e.g., (9)). Firstly, we immediately notice that the source hardened in the high-energy domain with a high-energy power law photon index of
Γ= 1.8. Secondly, the radio emission is usually interpreted in this state as synchrotron emission emanating from a jet. From the SED, we can derive the power law indexα (in Sν∝να): ∼ −0.3 in the radio and ∼ 1.6 in the optical/NIR. Therefore, the extrapolation of the radio flux towards the optical/NIR domain is significantly fainter than the observed optical/NIR flux. This strongly suggests that the synchrotron emission from the jet is contributing only for a small part, if any, in the NIR emission. It seems also likely that the optical/NIR emission comes from the thermal accretion disc and the irradiated companion star, since the slope in the NIR and optical remarkably remains the same in both observing epochs, while the X-ray decreased at the same time. Therefore, the NIR emission is dominated by the contribution of the companion star, which is consistent with XTE J1720-318 being an intermediate mass X-ray binary.
4.3 Trying to put everything together
From the analysis of the outburst lightcurve and the SED of XTE J1720-318 we therefore see that the source exhibited the first part of its outburst in the high-soft state, then transited to the low-hard state. The source probably began its outburst in the low-low-hard state, as tentatively suggested by spectral analysis of X-ray data (1). It might even have passed through the intermediate state while it was crossing the jet line, just before the transition to the low-hard state (see e.g. (12)).
We can also point out that XTE J1720-318 does not follow the radio–X-ray luminosity cor-relation of black hole candidates in the low-hard state (see e.g. (13)). Indeed, it lies below this correlation even if put at a distance of 1 kpc. But XTE J1720-318 is not the first source to deviate from this not-so-universal correlation (see for instance SWIFT J1753.5-0127 in (4)).
5. Conclusions
We have reported ESO/NTT optical and NIR observations of the microquasar XTE J1720-318, taken as Target of Opportunity observations following the January 2003 outburst of this source. By
Figure 4: Spectral Energy Distribution of XTE J1720-318 during the two observing epochs: the February
28, 2003, data are represented by ’+’, and the April 24, 2003, by ’∗’. The observations were taken nearly simultaneously with the VLA in the radio (1), the NTT/EMMI and SOFI in the optical and NIR (this paper), and INTEGRAL/IBIS in the high-energy (5). For the first epoch, the VLA data were taken on February 26, 2003, NTT/SOFI data on February 28, 2003, and INTEGRAL/IBIS data on February 28 – March 2, 2003. For the second epoch, VLA data were taken on April 26, 2003, NTT/SOFI data on April 24, 2003, NTT/EMMI on April 27, 2003, and INTEGRAL/IBIS data on February 28 – March 2, 2003. The February 28, 2003, observations correspond to the high-soft state: high and soft X-ray flux and no radio emission. On the contrary, the April 24, 2003, observations correspond to the low-hard state: low and hard X-ray flux and detection of radio emission. Optical and NIR fluxes were de-reddened, assuming an interstellar absorption in the visible of Av= 7 magnitudes. It is remarkable that they remain the same in both states. We overplot
the High Soft state in this Figure: in green the multi-colour black-body disc emission and the soft power law in X-rays, and in red the emission in optical and NIR.
performing accurate astrometry, we discovered the optical counterpart in the R-band (R ∼ 21.5) and confirmed the near-infrared counterpart. From photometric observations, analysis of a colour-magnitude diagram, and a basic modelling of its SED, we found that, for an absorption between 6 and 8 magnitudes, XTE J1720-318 is likely to be an intermediate mass X-ray binary, hosting a black hole and a main sequence star of spectral type between late B and early G, located at a distance between 3 and 10 kpc. We also analysed the XTE J1720-318 X-ray and near-infrared light curves: superimposed to a main FRED lightcurve, it exhibited three secondary outbursts, and our second set of observations took place simultaneously with the third one. The study of such outburst lightcurves is of prime importance to test accretion disc models. Comparing the SEDs during and after its outburst, we confirm the change of state of this source, from high-soft to low-hard state.
To further understand this source, it would be useful i) to get spectroscopic observations of XTE J1720-318 in quiescence to better characterise the companion star when the photospheric flux
Figure 5: Same Figure as above, with the Low Hard State overplot: in green the hard power law in X-rays,
in red the emission in optical and NIR and in blue the power law in radio.
of the star dominates and ii) to observe the radial velocity of the binary system to derive the mass function and orbital parameters. With these parameters we will be able to further analyse its SED (as in, e.g., (9) with the source XTE J1118+480). And obviously, we need some more continuous multi-wavelength coverage of such outbursts to understand how they work.
References
[1] C. Brocksopp, S. Corbel, R. Fender, M. Rupen, R. Sault, S.J. Tingay, D. Hannikainen, and K. O’Brien, The 2003 outburst of a new X-ray transient : XTE J1720-318, Mon. Not. R. astr. Soc. 356, 125–130 (2005).
[2] C. Brocksopp, R. P. Fender, M. McCollough, G. G. Pooley, M. P. Rupen, R. M. Hjellming, C. J. de la Force, R. E. Spencer, T. W. B. Muxlow, S. T. Garrington, and S. Trushkin, Initial
low/hard state, multiple jet ejections and X-ray/radio correlations during the outburst of XTE J1859+226, Mon. Not. R. astr. Soc. 331, 765–775 (2002).
[3] M. M. Buxton and C. D. Bailyn, The 2002 Outburst of the Black Hole X-Ray Binary 4U
1543-47: Optical and Infrared Light Curves, Astrophys. J. 615, 880–886 (2004).
[4] M. Cadolle Bel, M. Ribo, J. Rodriguez, S. Chaty, S. Corbel, and et al., Simultaneous
multi-wavelength observations of the Low/Hard state of the X-ray transient source SWIFT J1753.5-0127, Astrophys. J. (2006), subm.
[5] M. Cadolle Bel, J. Rodriguez, P. Sizun, R. Farinelli, M. Del Santo, A. Goldwurm, P. Goldoni, S. Corbel, A. N. Parmar, E Kuulkers, P. Ubertini, F. Capitanio, J.-P. Roques, F. Frontera, and N.J. Westergaard, High-Energy observations of the state of the X-ray nova and black hole
candidate XTE J1720-318, Astron. Astrophys. 426, 659 (2004).
[6] S. Chaty, The role of microquasars in astroparticle physics in proceedings of Frontier Objects
in Astrophysics and Particle Physics, Italy (2006), , 2006, in press (astro-ph/0607668).
[7] S. Chaty and N. Bessolaz, Optical/near-infrared observations of the black hole candidate
XTE J1720-318 : from high-soft to low-hard state, Astron. Astrophys. 455, 639–644 (2006).
[8] S. Chaty, P. A. Charles, J. Martí, I. F. Mirabel, L. F. Rodríguez, and T. Shahbaz, Optical
and near-infrared observations of the microquasar V4641 Sgr during the 1999 September outburst, Mon. Not. R. astr. Soc. 343, 169–174 (2003).
[9] S. Chaty, C. A. Haswell, J. Malzac, R. I. Hynes, C. R. Shrader, and W. Cui, Multiwavelength
observations revealing the evolution of the outburst of the black hole XTE J1118+480, Mon.
Not. R. astr. Soc. 346, 689–703 (2003).
[10] S. Chaty, I. F. Mirabel, P. Goldoni, S. Mereghetti, P.-A. Duc, J. Martí, and R. P. Mignani,
Near-infrared observations of Galactic black hole candidates, Mon. Not. R. astr. Soc. 331,
1065 (2002).
[11] W. Chen, C. R. Shrader, and M. Livio, The Properties of X-Ray and Optical Light Curves of
X-Ray Novae, Astrophys. J. 491, 312–+ (1997).
[12] R. P. Fender, T. M. Belloni, and E. Gallo, Towards a unified model for black hole X-ray binary
jets, Mon. Not. R. astr. Soc. 355, 1105–1118 (2004) [astro-ph/0409360].
[13] E. Gallo, R. P. Fender, and G. G. Pooley, A universal radio-X-ray correlation in low/hard
state black hole binaries, Mon. Not. R. astr. Soc. 344, 60–72 (2003).
[14] P. Goldoni, A. Goldwurm, E. Kuulkers, A. Parmar, C. Budtz-Joergensen, G. Palumbo, J. P. Roques, R. Sunyaev, and P. Favre, INTEGRAL detection of Hard X-ray emission from
XTEJ1720-318, The Astronomer’s Telegram 153 (2003).
[15] R. Gonzalez-Riestra, P. M. Rodriguez-Pascual, M. Santos-Lleo, N. Schartel, P. Calderon, P. Munuera, and B. Juarez, XTE J1720-318, IAU Circ. 8080, 1–+ (2003).
[16] R. K. Jain, C. D. Bailyn, J. A. Orosz, J. E. McClintock, and R. A. Remillard,
Multiwave-length Observations of the Black Hole Candidate XTE J1550-564 during the 2000 Outburst,
Astrophys. J. 554, L181–L184 (2001).
[17] D. Kato, T. Nagata, T. Kato, M. Uemura, and H. Yamaoka, XTE J1720-318, IAU Circ. 8056, 2–+ (2003).
[18] J.-P. Lasota, The disc instability model of dwarf novae and low-mass X-ray binary transients, New Astronomy Review 45, 449–508 (2001) [astro-ph/0102072].
[19] C. B. Markwardt, Refined position and spectrum for XTE J1720-318, The Astronomer’s Tele-gram 115, 1–+ (2003).
[20] P. Massey and L.E. Davis, A user’s guide to stellar ccd photometry with iraf, 1992.
[21] T. Nagata, D. Kato, D. Baba, S. Nishiyama, T. Nagayama, C. Nagashima, M. Kurita, S. Sato, T. Kato, M. Uemura, H. Yamaoka, B. Monard, Y. Ita, N. Matsunaga, Y. Nakajima, M. Tamura, H. Nakaya, and K. Sugitani, The Infrared Counterpart of the X-Ray Nova XTE J1720-318, Publ. Astron. Soc. Japan 55, L73–L76 (2003).
[22] K. O’Brien, F. Clarke, R. Fender, C. Brocksopp, D. Steeghs, R. Hynes, and P. Charles,
Im-proved IR (ISAAC/VLT) and radio (ATCA) astrometry of the likely counterpart to XTE J1720-318, The Astronomer’s Telegram 117 (2003).
[23] S. E. Persson, D. C. Murphy, W. Krzeminski, M. Roth, and M. J. Rieke, A New System of
Faint Near-Infrared Standard Stars, Astron. J. 116, 2475–2488 (1998).
[24] P. Predehl and J.H.M.M. Schmitt, X-raying the interstellar medium: Rosat observations of
dust scattering halos, Astron. Astrophys. 293, 889 (1995).
[25] R. A. Remillard, A. M. Levine, E. H. Morgan, E. Smith, and J. Swank, XTE J1720-318, IAU Circ. 8050 (2003).
[26] R.Ã. Ruelas-Mayorga, "distribution and studies of the infrared stellar population in the
galaxy. i. the model.", Revista Mexicana de Astronomia y Astrofisica 22, 27–41 (1991).
[27] M. P. Rupen, C. Brocksopp, A. J. Mioduszewski, V. Dhawan, R. Sault, R. Fender, and S. Cor-bel, XTE J1720-318, IAU Circ. 8054 (2003).