Design, Fabrication, and Evaluation of a Carbon Fiber
Polarographic Oxygen Microelectrode
by
Tzejunn Jason Yip
Submitted to the Department of Electrical Engineering
and Computer Science in Partial Fulfillment of the
Requirements for the Degrees of
Bachelor of Science in Electrical Engineering and
Master of Engineering in Electrical Engineering
at the
MASSACHUSETTS INSTITUTE OF TECHNOLOGY
May 20, 1996
© Massachusetts Institute of Technology, 1996. All Rights Reserved.
Author. A u th or ...
.
... ... ... . ...Departmelt of Elect cal Engineering and Computer Science
May 20, 1996
Certified by
d..
: "-. ...
"H. F. Bowman
Harvard-MIT Division of Health, Science and Technology
Director, MIT Cancer Hyperthermic Program
Thesis Supe'rvisor
A ccepted by ...r...
...
...
... ...
...
F. R. Morgenthaler
Chairman, Departm nt ommittee on Graduate Theses
OF 'TECHNLO3-GY
Design, Fabrication, and Evaluation of a Carbon Fiber
Polarographic Oxygen Microelectrode
by
Tzejunn Jason Yip
Submitted to the Department of Electrical Engineering and Computer Science on May 20, 1996, in partial fulfillment of the requirements for the degree of Master of Engineering in Electrical
Engineering
Abstract
The capability of acquiring accurate, real-time measurements of oxygen tension in tumors and surrounding tissues would represent a significant step forward in the effective man-agement of cancer therapy. A carbon fiber polarographic oxygen microelectrode was designed and fabricated to provide an alternative method of oxygen monitoring. Current polarographic oxygen measurement technology utilizes a gold wire microelectrode as the measurement cathode. The carbon fiber microelectrode was designed, fabricated, and evaluated using existing measurement equipment. Both in vitro and in vivo studies were performed to more fully evaluate the capabilities of the microelectrodes. Results showed that the carbon fiber microelectrode worked as well as commercially available gold wire microelectrodes.
Thesis Supervisor: Dr. H. F. Bowman Title: Senior Academic Administrator, HST
Acknowledgements
First, I would like to thank my parents and sister for all of their support. A long-distance thank you to Charles Ruban and Stephan Mangin for their invaluable assistance in making this project a reality. Fred Bowman and Bill Newman were invaluable in helping me get
the research done and for their constant input in finding new and innovative ways of get-ting through the problems that arose. Final thanks to Chipper for being around during every hour of the writing of this thing.
Table of Contents
1 Introduction ... ... ... ... 15
1.1 Project Description ... 15
1.2 Relevance of Project ... 15
Characterization of the Tumor Environment... 15
Carbon Fiber Microelectrodes ... ... 16
2 B ackground ... ... ... 19
2.1 Polarographic Oxygen Measurements ... 19
Electrochemical Theory... 19
Diffusion at the Polarographic Oxygen Sensor ... 23
2.2 Polarographic Oxygen Electrodes ... ... 27
Clark Electrodes... ... 27
Needle Electrodes ... ... 28
2.3 Complications with In Vivo Polarographic Oxygen Measurements ... 31
3 The Carbon Fiber Microelectrode... ... 33
3.1 D esign Phase ... ... 33
Cespuglio Design... ... 33
Ruban and Yip Design... ... 33
Y ip and M angin D esign ... ... 34
3.2 Specifications for the Final Design... ... 35
S ize ... ... 35
Conductivity of the Cathode ... 35
D urability... . ... 36 R eliability ... ... 36 3.3 M aterials Selection ... ... 36 Carbon Junction ... 36 Insulation Epoxy ... 38 Encasing Material ... ... 40 3.4 F abrication ... ... 4 1 The Gold Wire Microelectrode...41
The Carbon Fiber Microelectrode ... ... 42
The Prebundled Carbon Fiber Microelectrode ... 42
4 In Vitro and In Vivo Experiments ... ... 45
4.1 O bjectives ... ... 45
4.2 In Vitro Experiments...45
Experimental Setup... ... 45
The Long Term Experiment ... .47
The Short Term Experiment ... .... 49
4.3 In Vivo Experiments... ... 50
Experimental Setup... ... 50
Experiments on the Rat Liver... 51
5 Results: Long Term Measurements ... 53
5.1 O bjectives ... 53
5.3 M ethods ... ... 55
5.4 Results ... 55
Reference Measurements ... 55
Fabricated MicroelectrodeTests... ... 57
6 Results: Short Term Calibration Measurements ... ... 65
6.1 O bjectives ... ... 65
6.2 M ethods ... ... 65
6.3 Results ... 65
TTI Microelectrode Tests ... ... 66
Fabricated Microelectrode Tests... ... 66
7 Results: In Vivo Measurements... ... 69
7.1 O bjectives ... ... 69
7.2 M ethods ... ... 69
7.3 R esults ... ... ... 69
Atmospheric Conditions ... ... 69
Breathing Pure Oxygen... 71
Low Levels of Anesthesia ... 73
8 Discussion of Results...75
8.1 Long Term Measurements ... 75
Problems Observed During Experiments ... .... 75
H ypothesis ... ... 75
D iscussion ... 75
8.2 Short Term Calibration Measurements ... 77
Problems Observed During Experiments ... .... 77
Hypotheses... 77
D iscussion ... 7 8 8.3 In Vivo Measurements ... ... 78
Problems Observed During Experiments ... ... 78
H ypothesis ... ... 79
D iscu ssion ... 80
9 Summary and Conclusions ... ... 81
9.1 Summary of Carbon Fiber Microelectrode ... 81
9.2 C onclusions ... 83
10 Recommendations for Further Study ... 85
10.1 Long Term Measurements ... ... 85
10.2 Short Term Calibration Measurements ... 85
10.3 In Vivo Measurements ... 86
B ibliography ... ... 87
Appendix A Fabrication of the Carbon Fiber Microelectrode ... 89
A .1 O verview ... 89
A.2 Design of the Microelectrode ... 89
A.3 Fabrication of the Microelectrodes ... ... 91
Appendix B Protocol for In Vitro Experiments ... ... 103
B. 1 Long Term Studies ... 104
B.2 Short Term Studies ... ... 105
Appendix C Protocol for In Vivo Rat Experiments ... .... 107
C .1 Introduction ... 107
C.2 Preparation of pO0 2 Measurement System... ... 107
C .3 Surgery ... 108
List of Figures
Figure 2.1: Polarographic oxygen measurement schematic ... 20
Figure 2.2: Polarogram ... ... 21
Figure 2.3: Diagram of the original Clark electrode... 28
Figure 2.4: Beebe sensor in hypodermic form...29
Figure 2.5: Ballintyn procedure for platinum electrode fabrication ... 30
Figure 4.1: Schematic diagram of measurement system ... 46
Figure 4.2: Schematic diagram of in vitro experimental setup...46
Figure 4.3: Graph showing a microelectrode that has been well fabricated ... 48
Figure 4.4: Graph showing a microelectrode that has been poorly fabricated ... 48
Figure 4.5: Series of experiments leading to calibration ... 49
Figure 4.6: Calibration graph... 50
Figure 4.7: Schematic diagram of in vivo experiment setup ... 51
Figure 4.8: Graph showing the effects of pure oxygen administration ... 52
Figure 4.9: Graph showing temporal response of rat pO2 to low anesthesia levels ... 52
Figure 5.1: Graph of in vitro pO0 2 reflecting hypothesized poor glass/epoxy interface..54
Figure 5.2: Graph of in vitro pO2 reflecting hypothesized poor glass/epoxy interface..54
Figure 5.3: Graph of the 10 MU resistor experiment ... ... 56
Figure 5.4: Graph of the reference gold needle microelectrode experiment ... 57
Figure 5.5: Graph of saturation of carbon fiber probe #1 ... 58
Figure 5.6: Probe #5: Experiment before collodion membrane applied...59
Figure 5.7: Probe #5: Experiment after collodion membrane applied...59
Figure 5.8: Bundled Probe #2: Twenty hour experiment with minimal drift ... 60
Figure 5.9: Bundled Probe #4: Before the membrane was applied ... 61
Figure 5.10: Bundled Probe #4: After the collodion membrane was applied...61
Figure 5.11: Gold Probe #3: First run showing minimal current leakage ... 63
Figure 5.12: Gold Probe #3: Second run showing even smaller current leak ... 63
Figure 5.13: Gold Probe #2: Experiment showing high steady-state current ... 64
Figure 5.14: Gold Probe #2: Experiment performed after tip was broken ... 64
Figure 6.1: Original Probe #5: Calibration experiments at 10% 02 ... 67
Figure 6.2: Series of nitrogen current experiments... ... 68
Figure 6.3: Gold Probe #3: Calibration runs at 10% 02 ... 68
Figure 7.1: TTI Probe: Typical rat liver run ... ... 70
Figure 7.2: Bundled Probe #4: Typical rat liver run... 70
Figure 7.3: Gold Probe #3: Typical rat liver run ... ... 70
Figure 7.4: Bundled Probe #5: Effects of 100% 02 ... 71
Figure 7.5: Gold Probe #3: Effects of 100% 02 ... ... 71
Figure 7.6: TTI Probe: Lack of response to 100% 02 ... 72
Figure 7.7: TTI Probe: Vasomotor response detected ... .... 73
Figure 7.8: Bundled Probe #5: Vasomotor response detected... 74
Figure A.2. 1: Polyurethane catheter encased carbon fiber microelectrode ... 90
Figure A.2.2: Glass needle encased carbon fiber microelectrode... 90
Figure A.2.3: Comparison between gold wire and carbon fiber bundles ... 91
Figure A.3.2: Setup to connect gold and copper wires...92
Figure A.3.3: The soldered gold-copper wire junction ... 93
Figure A.3.4: The junction assembly inside the glass capillary tube ... 93
Figure A.3.5: The glass capillary tube assembly in the glass puller...94
Figure A .3.6: Syringe assem bly ... .... 95
Figure A.3.7: Syringe assembly inside glass needle... 95
Figure A.3.8: Connecting the polyurethane catheter and the glass needle ... 96
Figure A.3.9: The difference between a poor and a good epoxy seal...97
Figure A.3.10: Carbon fibers inside the polyethylene catheter ... 98
Figure A.3.11: The copper wire and carbon paste filled catheter assembly ... 98
Figure A.3.12: The copper wire and carbon fiber junction... 99
Figure A.3.13: Diagram of hanging, drying bundles ... 101
Figure A.3.14: The two halves of glass needle after pulling gold wire microelectrodel02 Figure A.3.15: Correct and incorrect methods of placing bundle inside glass needle.. 102
List of Tables
Table 3.1: Summary of Carbon Junction Epoxies Tested ... 37
Table 3.2: Summary of Insulation Epoxies Tested... ... 39
Table 4.1: Calibration Values ... 50
Table 5.1: Overview of the In Vitro Long Term Experiments ... 57
Table 6.1: Calibration Results ... 65
Table 7.1: Results from Selected Rat Liver Experiments... 72
Table 9.1: Summary of Fabricated Microelectrodes ... 81
Chapter 1
Introduction
1.1 Project Description
Polarographic oxygen electrodes have been in use for several decades and have recently become increasingly important in cancer therapy settings. The capability of acquiring accurate, real-time measurements of oxygen tension in tumors and surrounding tissues would represent a significant step forward in the effective management of cancer therapy. Among gas analysis devices, the polarographic oxygen sensor is almost unique in its abil-ity to measure directly the tension of a gas in solution. Currently, the material most widely used as the polarographic oxygen electrode cathode is a gold wire. This research investi-gates the fabrication of a polarographic oxygen microelectrode system that uses a bundle of carbon fibers as its cathode.
A carbon fiber oxygen microelectrode was designed and fabricated for use with exist-ing measurement systems. This microelectrode was tested both in vitro and in vivo, and data collected was compared to results obtained with commercially available microelec-trodes.
1.2 Relevance of Project
1.2.1 Characterization of the Tumor Environment
The efficacy of cancer therapy can be augmented by combined therapeutic modalities. Hyperthermia, when administered synergistically with radiotherapy and/or chemotherapy may prove to be an effective method of treatment. The early studies of Gray et al. in 1953 demonstrated that as the oxygen concentration of tumor cells was lowered, there was a corresponding decrease in the radiation response of those cells.1 Gray further suggested
of human cancers by ionizing radiation because the maximum dose given is limited by damage to nearby normal tissue which is aerobic. Since the survival rate of cells decreases exponentially with increasing doses of radiation, and since production of a given degree of cell kill requires three times the radiation dose when oxygen is absent, even a very small percentage of radioresistant hypoxic cells could ultimately determine the radiocurability of tumors.2
Hypoxic tumor cells may be critical in determining the long term results of irradiation and drug treatment. Hyperthermia offers the cancer clinician a possible means of modify-ing the pO2 levels in tumors, enhancmodify-ing the effects of radiation therapy. Accurate mea-surements of tumor oxygenation are critical in giving the clinician a better understanding of hypoxia in healthy and unhealthy cells.
Many polarographic electrodes permit direct measurements of oxygen tension in vivo, when small, but lack sufficient mechanical stability for routine use in patients, and can cause tissue compression and bleeding at larger electrode sizes.3 A reliable oxygen micro-electrode fabricated to meet these criteria is much sought after. One candidate micro-electrode system, made by Sigma-Eppendorf in Hamburg, Germany, uses needle electrodes which are mechanically stepped through the tissue to provide spatial information on tissue p0
2 .
1.2.2 Carbon Fiber Microelectrodes
The research presented in this thesis examines the performance of polarographic oxygen measurements made with carbon fiber microelectrodes. This carbon fiber technology was initially developed through collaboration with the Department de Medecine
Experimen-1. Gray, L. H., Conger, A. D., Ebert, M., Hornsey, S. and Scott, O. C. A., "Concentration of oxy-gen dissolved in tissues at time of irradiation as a factor in radiotherapy," British Journal of
Radiol-.gy, Vol. 26: pp. 638-648, 1953. 2. Ibid.
3. Kallinowski, F., Zander, R., Hoeckel, M., Nat., Rer., Vaupel, V., "Tumor tissue oxygenation as evaluated by computerized-p02-histography," International Journal of Radiation Oncology.
tale of the Universite Claude Bernard in Lyon, France and the Laboratorie de Physico-chimie des Interfaces of the Ecole Centrale de Lyon in Ecully, France. It was thought that carbon fibers were potentially suitable candidates for polarographic cathodes, initiating this research.
Cespuglio showed that carbon fibers are an excellent material for measurements in biological tissues.4 Gold wire electrodes were hypothesized to be unstable due to reactions with the surrounding tissue, reactions that may result from the release of ions from gold and other metals during the reduction of oxygen. The carbon fibers, composed of 95%
pyrolytic graphite, are hypothesized to be more "biocompatible" and more adaptable for long term in vivo use.
4. Cespuglio, R. et al., "High sensitivity measurements of brain cathecoles and indoles in vivo using electrochemically treated carbon fiber electrodes."
Chapter 2
Background
2.1 Polarographic Oxygen Measurements
2.1.1 Electrochemical TheoryThe polarographic oxygen sensor utilizes electrochemical principles to measure the oxygen tension in a medium. This sensor depends on the chemical reduction of oxygen at a surface (metal, carbon, etc.) by the electron pressure imposed on that surface by an external voltage. This process is different from electrochemical reactions where spontane-ous chemical reduction and oxidation provide a flow of electrons in an external circuit.5
The oxygen "concentration" measured is proportional to the partial pressure of oxygen in the gas phase. The chemical activity of oxygen measured by electrochemcial sensors is not the same as the oxygen concentration measured by chemical or gasometric methods. Because oxygen is only slightly soluble in most liquids, its chemical activity is equal to its partial pressure in the gas phase in equilibrium with the liquid. The amount of oxygen dis-solved in the liquid is proportional to the partial pressure of oxygen in the equilibrium gas phase, therefore, the chemical activity of oxygen measured by an electrochemical sensor is proportional to the concentration of dissolved oxygen.6
When a polarizing voltage is applied between the cathode and the anode, two major reactions occur. At the cathode, oxygen is reduced to hydroxyl ions by (2.1).
02 + 2 H20 + 4e- 4 OHff (2.1)
5. Fatt, Irving, Polarographic Oxygen Sensors, Malabar, Florida: Robert E. Krieger Publishing Company, 1982, p. 1.
(2.1) consumes electrons which come from the oxidation reaction at the anode. The half cell reaction of chloride ions in the solution with the metal anode produces the elec-trons needed to close the circuit.
Ag + CI- AgCI + e- (2.2)
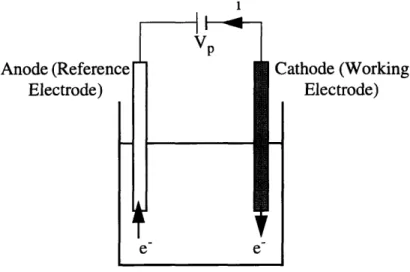
A schematic diagram of this polarographic system is shown in figure 2.1. i VP Anode (Reference Electrode) A.
a
e e Cathode (Working Electrode)Figure 2.1: Polarographic oxygen measurement schematic
The combination of (2.1) and (2.2) produces a flow of electrons from the anode to the cathode through the electrical circuit. This current is directly proportional to both the sur-face concentration of oxygen at the cathode and to the reaction rate of (2.1) which is a function of electron pressure at the cathode.
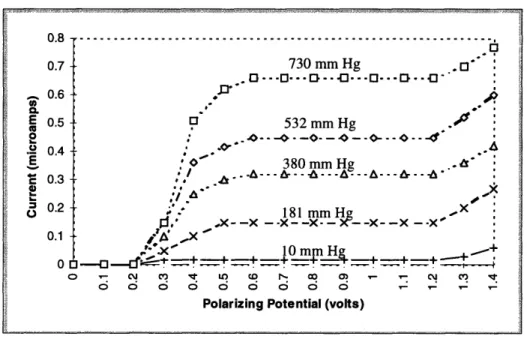
The polarization voltage is the external voltage applied by the measurement apparatus across the cathode and anode. The magnitude of the polarization voltage is chosen to be positive from the anode to the cathode. A polarogram (cathodic current as a function of applied voltage) is shown in figure 2.2 for different oxygen concentrations.
Figure 2.2: Polarogram7
At low polarization voltages, the current increases steeply with an increasing imposed voltage. This is due to the reduction of oxygen, (2.1), which is caused by the increase in the electron pressure. Starting at approximately 0.4 V, the rate of the increase in the cur-rent begins to slow.
* From 0 V to 0.4 V -The reaction rate is faster than the rate at which oxygen mole-cules can diffuse to the cathode. This causes the surface concentration of oxygen to decrease.
* From 0.6 V to 1.0 V -The current no longer increases with an increasing voltage. The electrochemical reaction rate is fast enough to deplete all oxygen molecules at the surface of the cathode. Thus, the current depends solely on how fast oxygen mol-ecules can be transported to the cathode. The two possible mechanisms of oxygen transport are diffusion and convection. Assuming no convection, the current is lim-ited by the rate of diffusion of oxygen toward the cathode. This reaction is said to be
diffusion-limited.
* Above 1.0 V -When the polarization voltage is increased beyond 1.0 V, other
7. Fatt, Irving, Polarographic Oxygen Sensors, Malabar, Florida: Robert E. Krieger Publishing Company, 1982, p. 5.
0.8 ---
---0 o.8 ... 0.7 730 mm Hg . :
.D--3
0----
1
..
.. 0---1..0 --
0
D -- '*
0.6 c-n ,3, 0.5 532 mm Hg ., E o- -.- o-- •--o---E 380 mm Hg . C 0.3 , 0.2 i.rn" H g X 0.2 .*' -181 mm Hg ,x : '*X- -X --X - -X -X- -X--X - -XO 0.1 /A 'X 0ol.inox i_ 10mmH _.eil 0 - ,t..__. + + ++. ____.+ :+=+ + 0 CMI CV O" CD r- CD 0M ,m C\ c,)cathodic reactions such as the reduction of hydrogen ions occur, resulting in a sharply increasing current.
To eliminate the effect of the applied voltage on the current, the operating polarization voltage must be chosen such that the current is diffusion limited. At a polarization voltage of -0.60 V, diffusion of oxygen to the cathode surface is shown by (2.3).
dc
j =
-Dx (2.3)j = the oxygen flux D = the diffusion coefficient
dc
= the concentration gradient at the cathode
In summary, a polarization voltage (e.g. 0.6 V) is applied, oxygen is consumed at the cathode surface, resulting in an 02 gradient near the surface and causing 02 to diffuse to the surface. This 02 is electrochemically reduced, yielding four electrons for each mole-cule of oxygen reduced. Because reactions at the electrode surface are very rapid, the rate of reduction becomes diffusion limited as regulated by the polarization voltage. This implies that the electrical current is proportional to the molecular flux of oxygen.
In a completely diffusion-limited reaction, the time constant for the diffusion of oxy-gen to the cathode surface is given by (2.4) where the time constant is proportional to the square of the distance to the cathode (8) and inversely proportional to the diffusion coef-ficient (D).
82
T - -- -(2.4)2.1.2 Diffusion at the Polarographic Oxygen Sensor
The rate of reduction of oxygen at the cathode is controlled by diffusion from the bulk of the solution to the electrode surface. Therefore, anything that influences diffusion near the cathode will influence the measured current.8
The relations between oxygen tension, time, and distance from the electrode surface at any time after the electrode begins to reduce oxygen are shown in (2.5).
2 aP a P -= D (2.5)
at
ax
2
P = oxygen tension t = timex = distance from the electrode surface
D = the diffusion coefficient for oxygen in the liquid
k = the solubility (or Henry's law constant) of oxygen in the liquid and is related to the concentration of dissolved oxygen (c from (2.3)) by Henry's Law (c = kP)
(2.3) shows that the flux of oxygen to the electrode will be proportional to the concen-tration gradient at the surface whose solution is found from (2.5). There are two methods by which oxygen can travel to the cathode surface, diffusion and convection. To eliminate convection as a means of oxygen flux, the cathode surface was commonly recessed from the tip of the microelectrode.
Before the polarizing potential is applied to the electrode, it is assumed there is a uni-form oxygen tension of P0 throughout the recess. When the potential is applied, it is
assumed that the oxygen tension at the electrode surface, taken as x = 0, goes immediately to 0. This is only an approximation because a complex series of electrical and chemical events take place at the electrode surface immediately upon application of the potential.
8. Fatt, Irving, Polarographic Oxygen Sensors, Malabar, Florida: Robert E. Krieger Publishing Company, 1982, p. 9.
However, for the time scale of interest here, these events die out rapidly, and the electrode takes on a zero oxygen tension.
This "electrochemical" response time to a step change in oxygen tension is a fraction of a millisecond. This demonstrates that the much longer response times observed for oxy-gen sensors in stagnant or slowly moving solutions are diffusion controlled.9
Kolthoff and Lingane, in 1952, showed that the gradient at the electrode surface as a function of time is given by (2.6).
( p
Po
(
=
0 Dt
(2.6)
The electrical current, i, that flows when oxygen is reduced at the cathode is given by (2.7).
i = n FAf (2.7)
n = number of faradays of electricity required per mole of electrode reaction F = the faraday (96,500 C)
A = the electrode area
f = the flux of reducible species to the electrode Henry's Law can now be substituted into (2.7) to give (2.8).
i = nFPokA (2.8)
Because this derivation assumes that the electrode current will eventually become zero, this derived electrode assembly does not yield a sensor of oxygen tension. Instead, a theoretical equation for a sensor that will yield a finite steady-state current that is linearly related to oxygen tension in the external solution must be derived.10
9. Ibid.
10. Fatt, Irving, Polarographic Oxygen Sensors, Malabar, Florida: Robert E. Krieger Publishing Company, 1982, p. 11.
This derivation was done by Crank in 1957, but is not reproduced here. Crank used a recessed electrode in his derivation, and he concluded that if the electrode were to be a useful sensor, the recession at the tip must be very shallow. Using Crank's model, a recess 3 cm deep would not approach its steady-state oxygen tension level in the external solu-tion for 50 hours. However, a recess of 0.1 mm deep will give a reading that is within a few percent of its final value in about 2 seconds.ll
Early users of polarographic oxygen sensors used bare wire or a bare exposed circular surface obtained by grinding a flat surface at right angles to a wire sealed in glass. These sensors gave high currents and a rapid response.12
The bare wire oxygen electrode was delicate and difficult to make, so it was only used when the sensor was inserted deep into tissue. For use in solutions or on tissue surfaces, a much more convenient electrode configuration is a disk embedded in glass. Unfortunately, the exact analysis of the time response of this system poses a formidable mathematical problem. For this reason, those studying oxygen sensors have approximated the planar disk with a hemisphere.13
The oxygen tension at any time after polarization of the electrode and at any point in a solution at rest surrounding the hemispherical electrode is given by (2.9).
P (1 a a (r - a)
P
=
P
+ Po-erf Dt (2.9)Po = the initial uniform oxygen tension a = the radius of the electrode
r = the distance of any point from the center of the electrode D = the oxygen diffusion coefficient
t = time
11. Ibid. 12. Ibid.
13. Davies, P. W., and Brink, F., in Physical Techniques in Biological Research, Nastuk, W. E., Ed., Academic Press, New York, 1962, 137, pp. 3, 9, 12.
erf = the error function of the argument, shown in (2.10)
x
erf(x)= e-Ydy (2.10)
0
In the steady-state, as t approaches o , the solution becomes (2.11).
P = Po 1
-
-
(2.11)
(2.11) shows that the electrode reaction will reduce the oxygen tension in the system to 90% of Po at r = 10a and to 99% of Po at r = 100a. In other words, the sensor is sensitive to within 1% to the oxygen tension at a distance 100 times the electrode diameter.14
The current resulting from the reduction of oxygen at a hemispherical electrode is given by (2.12).
i = 2nFDkPona (1 +
a
(2.12)From (2.12), the electrode current in the steady-state ( t = oo) is proportional to the solution properties (Dk), the electrode radius (a), and the bulk solution oxygen tension (Po). This electrode is a sensor of solution oxygen tension. (2.12) also shows the time to reach steady-state is dependent on electrode radius. For an aqueous solution where D is about 2 x 10⁻⁵ seconds an electrode with a 0.5 mm radius will be within 10% of its steady-state value in about 4000 seconds, too long a period to be useful in an analytic device. When the electrode radius is reduced to 5 jgm, the time to reach within 10% of
14. Fatt, Irving, Polarographic Oxygen Sensors, Malabar, Florida: Robert E. Krieger Publishing Company, 1982, p. 12.
steady-state becomes 0.4 seconds. Polarographic oxygen sensors should ideally have cath-odes on the order of 10 to 50 gm in diameter.15
2.2
Polarographic Oxygen Electrodes
There have been several different designs of polarographic oxygen electrodes. The evolu-tion of the modern sensor began in the 1950's when Clark attempted to correct many prob-lems associated with bare cathode sensors. However, Clark's sensors tended to be large and therefore applicable only for measurement in large fluid bodies. The current genera-tion of polarographic oxygen electrodes takes the form of hypodermic needles in an attempt to minimize the invasiveness of the electrode.
2.2.1 Clark Electrodes
One of the first widely-used polarographic oxygen electrodes was the Clark electrode which contained both an anode and a cathode in a concentrated electrolyte under a gas permeable membrane such as polyethylene. This sensor is one of the most reliable polaro-graphic electrodes available due to its insensitivity to flow and its environment and time independent calibration. However, for applications other than simple laboratory use, the Clark-type sensor lacks ruggedness, long term stability, sterilizability, ease of mainte-nance, and high current output.16
Clark discovered that many of the problems associated with the bare platinum polaro-graphic sensor could be overcome by covering the cathode with a thin membrane of poly-meric material permeable to oxygen, but impermeable to other substances normally present in aqueous solutions. The first Clark electrode had a useful current output, was not
15. Fatt, Irving, Polarographic Oxygen Sensors, Malabar, Florida: Robert E. Krieger Publishing Company, 1982, pp. 11-2.
16. Fatt, Irving, Polarographic Oxygen Sensors, Malabar, Florida: Robert E. Krieger Publishing Company, 1982, p. 35.
"poisoned" by organic materials in solution, and was less sensitive to stirring effects than the bare cathode sensor. 17
A diagram of the original Clark electrode is shown in figure 2.3.
ap port lyte tube &ire solder lene membrane Platinum cathode
Figure 2.3: Diagram of the original Clark electrode18 2.2.2 Needle Electrodes
There needed to be a miniaturization of the sensor for it to be viable for use in vivo. Although larger cathodes had many advantages such as a high current output, negligible zero pO02 current, durability, and ease of manufacture, they were valuable only for use in measuring oxygen tension in bulk liquids, not for in vivo measurements.19 One of the first
17. Fatt, Irving, Polarographic Oxygen Sensors, Malabar, Florida: Robert E. Krieger Publishing Company, 1982, p. 25.
attempts to miniaturize a Clark-type sensor was made by Beebe in 1963. A sensor was cre-ated in which the anode was a silver tube, the end of which was flush with the glass-sup-ported platinum cathode. This is shown in figure 2.4.
Polyethy. .s steel tube
Abe
Layer of 2% KC1
Figure 2.4: Beebe sensor in hypodermic form20
The Clark design, in which both the cathode and anode are close together in the same shaft, has the advantage that the electrical resistance is low and extraneous signals from the patient, experimental animal, or tissue sample are minimized. This is not the case for a polarographic oxygen sensor composed of a coated cathode and a remote anode (used as the reference electrode). The Clark electrode can only be miniaturized to a limited degree, and the Beebe design fits the Clark sensor into an 18-gauge needle is among the smallest versions.
A procedure for making a very small, sharply pointed monopolar platinum electrode is described by Ballintyn in 1961. As described above, this is a polarographic oxygen sensor where the cathode and the anode were separate. Ballintyn's procedure is shown in figure 2.5.
In figure 2.5, the upper left diagram shows a platinum wire electropolished to a point in a saturated sodium or potassium nitrite solution. An AC potential of 1 to 1.5 V is
19. Fatt, Irving, Polarographic Oxygen Sensors, Malabar, Florida: Robert E. Krieger Publishing Company, 1982, p. 30.
applied to the wire and a carbon rod until a point forms. The platinum wire is soldered, or preferably spot welded, to a larger copper wire. The diagram in the upper center shows a piece of glass capillary tubing sealed to the platinum wire. The hook on the glass tube holds the weight that pulls the glass upon heating by a heated wire. The lower diagrams show glass coating and tip configuration.21
Pt wre _ Lv•~ Glas s onto I coil J-P
Figure 2.5: Ballintyn procedure for platinum electrode fabrication22
The bare needle electrode usually does not show a polarographic plateau (see figure 2.2) that is as well defined as for a covered electrode. However, since the bare needle
elec-21. Fatt, Irving, Polarographic Oxygen Sensors, Malabar, Florida: Robert E. Krieger Publishing Company, 1982, p. 64.
22. Ibid.
I
trode is normally used for observing relative changes in tissue oxygen tension, the absence of the polarographic plateau is not critical.23
Collodion was the most popular coating material in early designs. Collodion is perme-able to oxygen and small ions, but impermeperme-able to the large organic molecules that poison the electrode surface. However, collodion does not adhere very well to metallic surfaces. Today, many different coatings are used, including Teflon.
2.3 Complications with In Vivo Polarographic Oxygen Measurements
In vivo measurements were originally performed using dropping mercury electrodes, but
they were cumbersome and inconvenient in routine clinical use24. Many researchers
attempted to circumvent the inconveniences of the dropping mercury electrode by using an amalgamed gold wire as the polarographic cathode. The problem of protein poisoning arose when the metallic surface came into contact with blood. Inch, in 1958, observed that any metallic surface in blood or other body fluids will collect a film of proteinaceous material that can only be cleaned off with dichromate solution.25 Leaving the film on the
cathode leads to a downward drifting current and unreproducible results.
In 1951, Drenckhahn used a collodion-covered platinum cathode for polarographic measurements of oxygen in blood. The collodion coating kept protein and other deleteri-ous materials away from the electrode, but allowed free passage of oxygen and salt ions. The passage of salt ions was essential because an electrical connection via ion conduction to the separate anode was necessary.26
23. Fatt, Irving, Polarographic Oxygen Sensors, Malabar, Florida: Robert E. Krieger Publishing Company, 1982, p. 63.
24. Fatt, Irving, Polarographic Oxygen Sensors, Malabar, Florida: Robert E. Krieger Publishing Company, 1982, p. 47.
25. Fatt, Irving, Polarographic Oxygen Sensors, Malabar, Florida: Robert E. Krieger Publishing Company, 1982, p. 48.
Other methods to eliminate the effects of poisoning were attempted as well. Mochi-zuki and Bartels, in 1955, used a bare platinum cathode in blood, but applied alternating pulses of positive and negative polarity to the cathode. The positive potential applied to the cathode was for the purpose of removing, possibly via oxidation, any organic film that might accumulate on the cathode.27
Chapter 3
The Carbon Fiber Microelectrode
3.1 Design Phase
While designing the carbon fiber microelectrode, several different designs were tested. The final design combined characteristics of the Cespuglio design with some characteris-tics of a Thermal Technologies, Inc. (TTI) butterfly needle microelectrode.
3.1.1 Cespuglio Design
The idea for a carbon fiber microelectrode originated in France and was introduced in the United States by Charles Ruban, a visiting French scholar. Ruban's advisor, Dr. Cespuglio, originally designed the microelectrode, not for oxygen measurements, but for measurements of other molecules in the brain.
One of Cespuglio's designs was the monofiber microelectrode which used only one carbon fiber (a cylinder 5-20 p.m in diameter). This monofiber microelectrode differed from the polarographic microelectrode discussed here in two ways. First, the monofiber microelectrode used a single carbon fiber whereas the polarographic microelectrodes used
multiple fibers which provided the measurement equipment with sufficient signal. Second,
the monofiber microelectrode was fabricated with the carbon fiber protruding from the tip of the microelectrode, exposing not only a cross-sectional area at the tip, but an axial sur-face as well. In contrast, the functional cathode sursur-face of this polarographic microelec-trode was fabricated such that the carbon fibers were flush with the tip of the microelectrode, thereby exposing only the transverse cross-section.
3.1.2 Ruban and Yip Design
When the carbon fiber idea was introduced, it needed to be designed so that a viable polarographic oxygen microelectrode could be fabricated. The first step involved
verify-ing that a bundle of carbon fibers would work as a suitable cathode. The goal in this design was not to optimize the size of the microelectrode, but instead to fabricate a working device.
A polyurethane catheter approximately 700 pm in diameter was used as a housing to encase the cathode. The larger housing allowed more latitude in the design of the cathode since size was not an issue. Following cathode design optimization, the housing could be made smaller to fabricate a minimally invasive device to be used in vivo.
During this phase, a working cathode was fabricated inside a 700 pm catheter. The microelectrode only demonstrated sensitivity to changes in oxygen tension in vitro, not in
vivo. This was most likely due to the size of the catheter which caused significant tissue
compression upon insertion of the microelectrode. In in vitro experiments, changes in the gas concentration of the phosphate buffered solution (PBS) were mimiced by the micro-electrode. However, in vivo, in the rat liver, presumed changes in the rat's partial pressure of oxygen brought about by administration of pure oxygen were not mimiced by the microelectrode.
3.1.3 Yip and Mangin Design
From June, 1995 until August, 1995, the glass needle microelectrode was designed and successfully tested both in vitro and in vivo. This design was a joint effort by the author and Stephan Mangin, another visiting French scholar. The framework for an effec-tive cathode was already in place, and a more effeceffec-tive housing needed to be fabricated.
The glass needle design focused on minimizing the diameter of the tip of the micro-electrode. By pulling glass capillary tubes, the diameter of the resulting necked glass tips was one order of magnitude smaller than that of the polyurethane catheter. The result was a tip diameter slightly larger than the diameter of the carbon fiber bundle used as the cath-ode.
3.2 Specifications for the Final Design
There are several specifications that must be met for a carbon fiber microelectrode to work properly both in vitro and in vivo.
3.2.1 Size
The size of the microelectrode is important for two reasons. First, the diameter of the tip must be sufficiently small to substantially minimize tissue compression effects as the microelectrode is inserted. Secondly, the body of the microelectrode must be sufficiently large to ensure that the user can manipulate it effectively. Manipulation by the user is important because a larger microelectrode body facilitates easy repositioning of the micro-electrode should it become necessary. The glass needle housing for the cathode fulfills these criteria with tips on the order of 100 im in diameter and shafts approximately 5 cm. in length.
3.2.2 Conductivity of the Cathode
The conductivity of the cathode must be within a certain range for it to work effec-tively with the recording equipment, the Thermal Technologies, Inc. TDP-OX. If the con-ductivity is too high, the current recorded by the TDP-OX will be too high and will saturate the TDP-OX's amplifier. If the conductivity is too low, the current will be unde-tectable by the TDP-OX.
The conductivity of the cathode is reasonably simple to optimize. Because the rate of reduction of oxygen at the cathode is dependent on the surface area of the cathode, the number of carbon fibers used in fabrication will determine the conductivity of the cathode. By using between five and forty carbon fibers, the resulting conductivity will be in the 10
MQ2 range and will result in measured currents in the nA range, an acceptable range for
3.2.3 Durability
To endure repeated use, the microelectrode must be sufficiently durable to withstand heavy use. Glass is rather durable, but the tips, being very small in diameter, are not as durable and must be protected. The thin tips are easily broken when exposed to sheer forces. When in soft tissue, this does not pose much of a threat, but when tested in vitro in glass beakers, the threat of broken tips is greater. Although the polyurethane catheter is more durable due to its flexible nature, it has size limitations which make it impractical for
in vivo use.
3.2.4 Reliability
The microelectrode must be fabricated such that it is reliable in repeated testing. Max-imal reproducibility is a goal of this project, therefore, microelectrode reliability is of the utmost importance. In other words, the materials used in the fabrication process must be robust and able to endure the rigors of different fluids. The solution to this lies in the selec-tion of an insulaselec-tion epoxy, a process discussed in 3.3.2.
3.3 Materials Selection
There are several crucial components in a polarographic oxygen microelectrode that, unless they are fabricated properly, can lead to instability and failure of the microelec-trode. It was important to ensure that the materials used in the fabrication of these compo-nents were selected carefully to ensure proper functioning of the microelectrode.
3.3.1 Carbon Junction
The function of the component termed the carbon junction is to provide a highly con-ductive adherent for attaching the carbon fiber bundle to the copper lead wire. This carbon junction is created by mixing a conducting epoxy with carbon powder.
There are three essential properties for this carbon junction. First, the viscosity of the conductive epoxy must be low so that when mixed with the carbon powder, the mixture
remains at a low viscosity. It is important for the viscosity be low enough so that the cath-eter used to hold the fibers and wire together while the epoxy mixture cures (figure A.4.1 in appendix A) can be easily filled with the epoxy-powder mixture. Second, the conduc-tance of the carbon junction must be very high so that the junction is not the limiting resis-tance in the signal travelling from the cathode surface to the recording equipment. Third, the epoxy mixture must have a high adherence to both the bundle of carbon fibers and the stripped copper wire. If the adherence to either substance is not good, the result may be a decreased effective conductance.
Several epoxies were tested for mechanical strength and electrical conductivity. The results are summarized in table 3.1.
Table 3.1: Summary of Carbon Junction Epoxies Tested
Viscosity Adherence to
Resin Conductivity Fragility iscosity Mechanical
Resin
when Cured(after
Polyethylene
when Cured mixing) mixing) Strength CatheterCatheter
Sody Escil Very good Not Fragile Low Fair Low
Trac-Cast Good Not Fragile Low Good Low
BB 3103
Trac- Good Not Fragile Low Very Good Low
Bond BA-FDA2
Although the mechanical properties of the Trac-Cast and Trac-Bond epoxies were better, the superior electrical conductivity of the Sody-Escil epoxy made it the logical choice.
As discussed before, the carbon junction was molded in a catheter. If the catheter were left on the junction, the size of the junction would close to 1000 .m .Therefore, the cathe-ter needed to be removed afcathe-ter the epoxy cured. The cathecathe-ter was removed by using a scal-pel to slice the side of the catheter and carefully removing it from the junction.
Because the catheter needed to be removed from the cured junction without damaging to the carbon fibers, it was important to use a catheter material that did not adhere well to the cured epoxy. Materials tested were silicone, polyurethane, and polyethylene, and it was found that the polyethylene catheter adhered least well to the cured epoxy junction. This polyethylene catheter had an inside diameter of 450 gtm and an outside diameter of
700 pm .
The combination of the Sody Escil resin with a polyethylene catheter was used to fab-ricate the carbon junction.
3.3.2 Insulation Epoxy
The role of the insulation epoxy is to electrically protect the carbon fibers and carbon junction from the fluid or tissue being measured. This is essential for the reliability and durability aspects of the microelectrode. If fluids were to invade interstitial spaces created by degradation of the insulation epoxy, the effective surface area of the cathode may change, leading to unreliable measurements.
There are three properties desired for the insulation epoxy. First, the viscosity must be very low during the fabrication process so that the epoxy completely fills all interstitial spaces. Carbon fiber bundles have inter-fiber spaces on the order of 1 .m , and it is essen-tial for the epoxy to be fluid enough to permeate and fill those spaces. Second, unlike the carbon junction epoxy, the insulation epoxy must be an excellent insulator. Third, the epoxy must adhere very well to both the glass capillary tube and the carbon fibers. If this adherence is weak, interstitial spaces may result.
Several different characteristics were tested. First, the color of the epoxy was a charac-teristic found to be important. Clear or light-colored epoxies are preferable because they allow the carbon fibers and carbon junction to be viewed. Hardness and fragility are also important because if the epoxy is fragile, movement of the microelectrode could snap the
epoxy and the carbon fibers encased within. Viscosity of the epoxy is important to ensure all interstitial gaps are filled. In table 3.2, the adherence to a polyurethane catheter is noted because this search was conducted before the glass needle design was introduced. This adherence is important so that no gaps between the carbon fibers and the catheter exist. The state of the surface after being cut refers to the catheter tip following curing of the epoxy. A sharp scalpel was used to slice across the tip of the catheter to create a sharply beveled edge. If the cut surface is filled with particles or bubbles, then the cathode surface may change over time as particles fall off of the surface.
Seven epoxies were tested, and the results are summarized in table 3.2.
Table 3.2: Summary of Insulation Epoxies Tested
Viscosity Adherence State of
Resin Color Hardness Fragility (after to Surface
mixing) Catheter after Cut
Sody Escil Clear Very Not Low Good Rough
Low Fragile
Trac-Cast Black Very Very Low Poor Very
High Fragile Rough
Trac- Yellow High Not Low Fair Good
-Bond Fragile Bubbles
Epotek Clear Medium Not Low Fair Fair
-301 Fragile Bubbles
Epotek Clear High Fragile Low Fair Fair
-353 Particles
Eccobond Clear Medium Not Low Excellent Very Good
227 Fragile
3.3.3 Encasing Material
The final problem was to find a suitable material to serve as the housing for the cath-ode. Three different materials were tested. In the initial design phase, only a polyurethane and a polyethylene catheter were tested. During the later design phases, a glass capillary tube was also tested.
An effective encasing material must have several properties. First, it must be imper-meable to the fluids that are being measured. If fluids are allowed to compromise the integrity of the cathode housing, problems may result. Second, housing durability is one of the design goals. Problems associated with cracks in the microelectrode due to poor dura-bility may manifest themselves, causing problems. Third, the encasing material must adhere very well to the insulation epoxy described in 3.3.2. This is to ensure that none of the fluid being measured can seep through the epoxy-catheter interface. If fluid travels in channels between the epoxy and the housing, the ability of the housing to act as a barrier from the measured fluid would be destroyed. Lastly, the size of the housing, in particular the tip, is very important. One of the hypothesized problems with larger microelectrodes was probe-induced tissue trauma which states that smaller tipped microelectrodes lead to a smaller degree of tissue compression at the insertion point.
The catheters were first washed clean with alcohol and filled with the Eccobond 27 epoxy. The epoxy was cured and the tips were sliced diagonally. This tip was then exam-ined under the microscope to more closely examine any gaps between the epoxy and the catheter.
The polyurethane catheter was chosen because Eccobond 27 epoxy adhered better to it than to the polyethylene catheter. In later design phases, a pulled glass capillary tube was used due to its smaller tip size. The polyurethane catheter had an outside diameter of 900
rm . With such a small tip, it became impossible to evaluate the adherence of the Ecco-bond 27 epoxy with the glass by examining it in the microscope. Based on in vitro testing, this adherence appeared to be as good as the adherence to the polyurethane catheter.
3.4 Fabrication
Three different variations of the final design were constructed to find the best design. Of these three variations, two used carbon fiber cathodes while the third used a gold wire cathode. The two carbon fiber microelectrodes were constructed in slightly different man-ners. A brief synopsis of the characteristics of each microelectrode is described in 3.4.1,
3.4.2, and 3.4.3, and complete fabrication instructions are shown in appendix A. 3.4.1 The Gold Wire Microelectrode
The fabrication of this design served as a template for the fabrication of the carbon fiber microelectrodes. This is because to construct the carbon fiber microelectrode, only
small changes in the fabrication procedure were needed.
A thin gold wire (50 gtm in diameter) was used as the cathode. The finished micro-electrode was to be of the same type as other commercially available oxygen microelec-trodes such as the TTI butterfly needle microelectrode. The only differences were the cathode housing (glass rather than a 27 gauge stainless steel needle) and the insulation epoxy.
The gold wire is soldered to stripped copper wire which serves as the connection wire. This wire assembly is placed into a glass capillary tube with an outside diameter of approximately 1.5 mm. The capillary tube is then necked in a glass pulling machine, resulting in a necking that forms a tight glass seal around the gold wire. Following neck-ing, the glass breaks, and a sharp tip with the gold wire embedded within results. To
ensure the cathode is sufficiently isolated from the measured environment, the Eccobond 27 insulation epoxy is inserted into the needle using a syringe.
This glass needle assembly is then connected to a flexible polyurethane catheter to ensure flexibility of the microelectrode body. Soldering then connects the copper connec-tion wire to a male connector for interfacing with the TDP-OX.
3.4.2 The Carbon Fiber Microelectrode
This design was the first of the two carbon fiber cathode designs fabricated. A bundle of carbon fibers was inserted into a glass capillary tube and the glass was necked around the fibers in the same manner as the gold wire microelectrode. This is different from the prebundled carbon fiber microelectrodes described in 3.4.3.
Instead of solder, a carbon junction connects the carbon fibers to the copper connec-tion wire. This carbon juncconnec-tion is made using the Sody-Escil epoxy and carbon powder. After the bundle of carbon fibers is attached to the copper wire, the carbon fibers are placed into a glass capillary tube, and the glass is necked around the fibers. A syringe is used to fill the tip of the glass needle with Eccobond 27 epoxy to ensure fluid imperme-ability.
This glass needle assembly is then connected to a flexible polyurethane catheter to ensure flexibility of the microelectrode body. Soldering then connects the copper connec-tion wire to a male connector for interfacing with the TDP-OX.
3.4.3 The Prebundled Carbon Fiber Microelectrode
The second carbon fiber cathode design differs only slightly from the fabrication pro-cess described in 3.4.2. Before the carbon junction is made, the bundle of carbon fibers is premixed with Eccobond 27 epoxy, hypothetically eliminating all inter-fiber spaces.
These carbon fibers are dried to form a bundle which is connected to the copper con-nection wire using the carbon junction. Instead of necking the glass around this bundle,
the glass capillary tube is pulled without anything inside. The resulting neck is carefully broken so that the bundle can fit through the tip. The resulting interface between the car-bon fibers and the glass tip is not as tight as in the other two designs. A syringe is used to fill the glass needle with Eccobond 27 epoxy.
This glass needle assembly is then connected to a flexible polyurethane catheter to ensure flexibility of the microelectrode body. Soldering then connects the copper connec-tion wire to a male connector for interfacing with the TDP-OX.
Chapter 4
In Vitro and In Vivo Experiments
4.1 Objectives
Two different types of experiments were conducted using the fabricated carbon fiber microelectrodes, the in vitro experiments in phosphate buffered saline solution (PBS) and
in vivo experiments done to test the data obtained against that of commercially available
microelectrodes.
4.2 In Vitro Experiments
Two different types of in vitro experiments are described in appendix B. One is the long term experiment, a set of studies that tests the fabrication and integrity of the micro-electrode. The second is the short term experiment which provides data used to calibrate the microelectrode to "directly" measure in vivo p0
2-4.2.1 Experimental Setup
The equipment needed to conduct measurements with the fabricated microelectrodes included the following:
* IBM PC compatible computer with JCOX program * TDP-OX oxygen measurement box
* TDP-100 oxygen measurement box * Power supply for TDP boxes * Thermoregulated water bath * Ring stand(s)
* Phosphate-buffered saline solution (PBS) * Flasks to hold PBS
* Gas tanks with different concentrations of 02 * Reference electrode
* Fabricated microelectrode
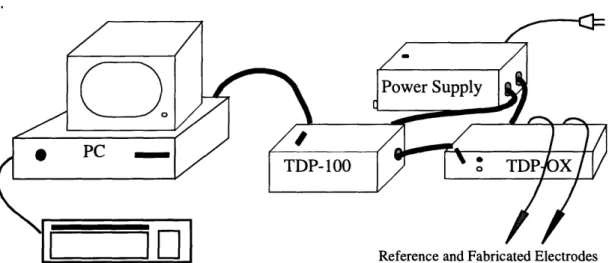
A schematic diagram of the measurement system is shown in figure 4.1, and a diagram of the in vitro laboratory setup is shown in figure 4.2
Figure 4.1: Schematic diagram of measurement system
02 measurements are done using two electrodes, the working electrode (the gold wire microelectrode, the carbon fiber microelectrode, etc.) and the reference electrode (Ag/ AgCl). The working electrode, or cathode, is negatively polarized with respect to the ref-erence electrode which forces reduction of oxygen at its surface. The measurement appa-ratus used in these experiments are controlled by an IBM PC compatible computer which also stores the acquired data.
0%
02
I --- 4u.u SuI JLxUUUV
Figure 4.2: Schematic diagram of in vitro experimental setup
I
The water bath and ring stand are placed on foam rubber pads to minimize vibration which may cause convection. Convection would provide a second method through which oxygen could be transported to the cathode surface, leading to an inflated pO0 2 current. The
thermally regulated water bath is kept at 37 "c to simulate the in vivo measurements tem-perature. The water bath has floating spheres that cover the surface for minimal heat loss. The level of the PBS in the flask must be kept lower than the water surface in the bath to ensure that all of the PBS is heated to the water bath temperature.
The calibrated gasses that are bubbled in the PBS contain various levels of oxygen. Measurements made at 0% 02 require that calcium chloride be added to the PBS to com-pletely consume the oxygen in the solution. To ensure the oxygen concentration in the PBS has reached equilibrium, gasses should be bubbled in the PBS for at least one hour. 4.2.2 The Long Term Experiment
In the long term experiment, the microelectrodes are tested for at least 24 hours in seg-ments ranging from three to twenty hours in length. The purpose is to determine if the fab-rication of the microelectrode created a durable and reliable cathode.
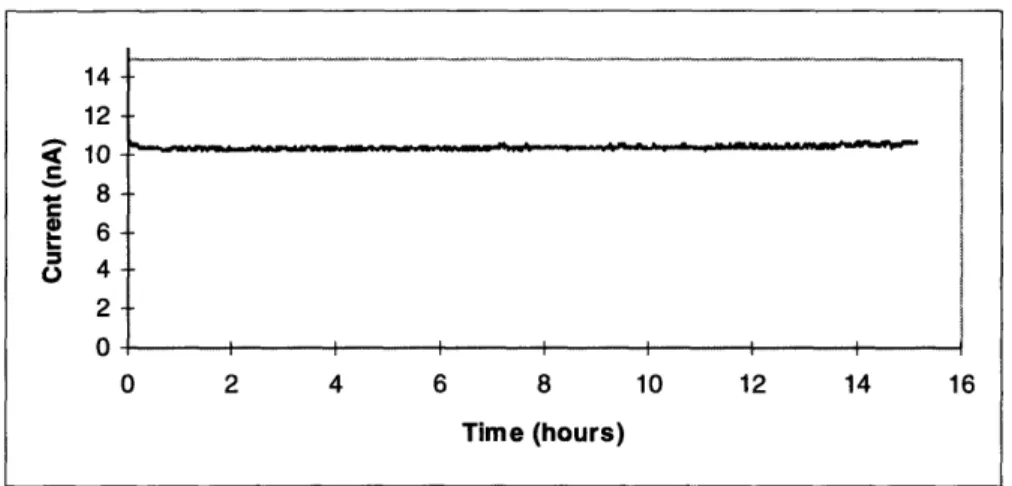
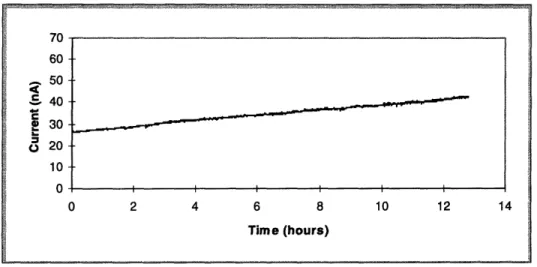
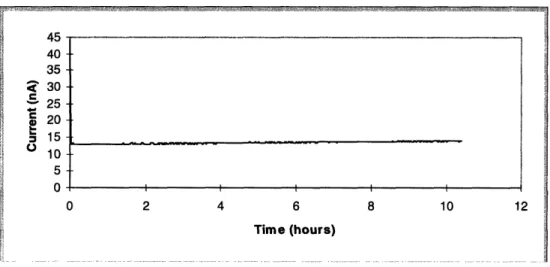
The long term experiment examined the integrity of the interfaces between the insula-tion epoxy and the carbon fibers and between the insulainsula-tion epoxy and the glass. If the microelectrodes were well fabricated, no fluid from the experimental medium should per-meate the interstices. The current recorded should be steady, remaining at the same level at the beginning as well as at the end of the 24 hour recording period. If there are interface problems, this would most likely manifest itself as a current that increases with time. A comparison of these two different scenarios is shown in figures 4.3 and 4.4.
14-12 -4 10- 8- 6- S4- 2-0- I I I I I I
Figure 4.3: Graph showing a microelectrode that has been well fabricated
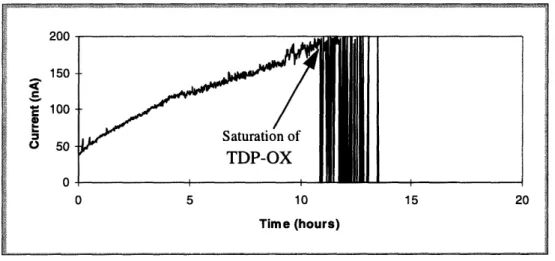
140 120 14 100 80 0 40 20 0 0 5 10 15 20 25 Time (hours)
Figure 4.4: Graph showing a microelectrode that has been poorly fabricated
In figure 4.3, the curve is flat with the current unchanging over time. In contrast, figure 4.4 shows an increasing current over time, with the final current level over two times the initial level. Something is wrong with the microelectrode used in the experiment in figure 4.4, and it was hypothesized that the integrity of one of the two interfaces described above was breached, increasing the cathode surface area, increasing the current measured.
A third hypothesis to explain the increase in current was diffusion of PBS solution through the epoxy. To test this, microelectrodes were fabricated and used in PBS dyed with food coloring. If diffusion of PBS into the insulation epoxy occurred, the microelec-trode tip would change color. This was not observed, and this hypothesis was disregarded.
I I I111
11 1 141141·-1111
0 2 4 6 8 10 12 14 16
4.2.3 The Short Term Experiment
The short term experiment is a series of five minute tests to ensure that the microelec-trode would give reproducible results when tested in a manner similar to that of the in vivo tests. Another purpose was to calibrate the microelectrodes at various oxygen tensions. It was more costly to perform long experiments at non-atmospheric oxygen tensions because large amounts of gas would be expended. Also, it would be difficult to maintain a non-atmospheric oxygen tension without bubbling the gas through the PBS periodically, an action that would introduce convective currents.
A cycle of bubbling the gas through the PBS for five minutes, then measuring the oxy-gen tension for five minutes formed the short term experimental protocol. By performing multiple tests at the same oxygen tension, it was quickly apparent whether results would be reproducible for the given microelectrode. If the steady-state current was the same between runs, the microelectrode could be used in subsequent in vivo studies. If the steady-state current changed between runs, problems with the microelectrode may exist.
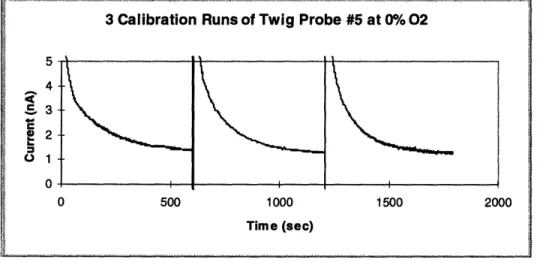
Figure 4.5 shows a series of experiments that led to calibration of that microelectrode. The steady-state currents of all three runs were essentially identical.
Figure 4.5: Series of experiments leading to calibration
3 Calibration Runs of Twig Probe #5 at 0%/ 02
5 4
35--
2-01 0 0 500 1000 1500 2000 Time (sec) AFollowing a series of short term experiments at oxygen concentrations of 0%, 10%, and 21%, a calibration was performed with the results shown in table 4.1 and figure 4.6.
Table 4.1: Calibration Values Measured Current (nA)
0% 1.3 nA
10% 3.95 nA
21% 6.4 nA
Figure 4.6: Calibration graph
4.3 In Vivo Experiments
4.3.1 Experimental Setup
In vivo experiments were performed in rat livers using almost all of the equipment
listed in 4.2.1. The experimental protocol is described in appendix C, and a schematic dia-gram of the experimental setup is shown in figure 4.7.
Calibration Curve for Twig Probe #5
6 4 25 0 5 10 % Oxygen
0i
% Oxygen 1II
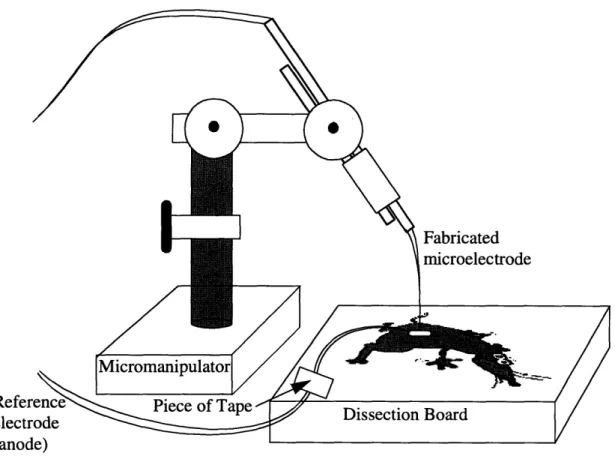
Fabricated microelectrodeFigure 4.7: Schematic diagram of in vivo experiment setup
The microelectrode is attached to a micromanipulator which uses gear differentials to precisely manipulate the position of the microelectrode tip. This is so the microelectrode does not move after being placed in a particular location. Slight compression is placed on the microelectrode tip such that the probe follows the breathing motions of the rat. The
reference electrode is allowed to move and is affixed to the dissection board using tape. 4.3.2 Experiments on the Rat Liver
In vivo experiments were done for two reasons. First, results obtained with fabricated
microelectrodes were compared to results obtained with commercially available micro-electrodes. Second, experiments done with fabricated microelectrodes were analyzed to see if externally induced events involving rat pO0 2 were recorded by the microelectrode.
Externally induced events consisted of pure oxygen gas being administered to the rat via a gas mask (modified syringe). The goal of this pure oxygen administration was to see
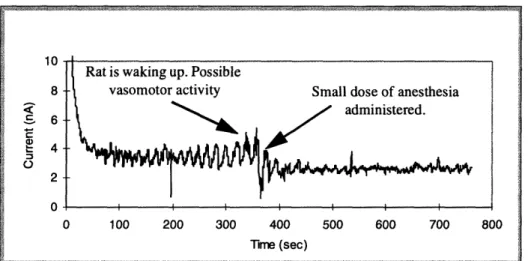
if there was a measured increase in the pO0 2 of the liver. If, within physiological parame-ters, the oxygen tension in the liver did not increase following oxygen administration, either the microelectrode's sensitivity was suspect or the measurement location was not close enough to the major vascular branches to reflect pO02 changes. Another external event was to allow the anesthesia to lighten with time, then to inject additional anesthesia to deepen the level. Vasomotor activity was detected by sensitive microelectrodes.
Results shown in figures 4.8 and 4.9 show examples where the microelectrode mea-sured the rat's response to oxygen administration as well as to injections of anesthesia.
6 5 4 r 3 2 1 0 5 10 15 20 Time (m in)
Figure 4.8: Graph showing the effects of pure oxygen administration
0 100 200 300 400 500 600 700 800
Time (sec)
Figure 4.9: Graph showing temporal response of rat pO02 to low anesthesia levels
0
~aSB~