Energy Laboratory
Report No. MIT-EL 84-021
September 1984 MASSACHUSETTS INSTITUTE OF TECHNOLOGY
THE ENERGY LABORATORY
THE DEVELOPMENT OF A CURB VALVE FLOW METER FOR GAS THEFT DETECTION
by
Kevin Francis Fitzgerald Leon R. Glicksman Carl R. Peterson
THE DEVELOPMENT OF A CURB VALVE FLOW METER FOR GAS THEFT DETECTION
by
KEVIN FRANCIS FITZGERALD
Submitted to the Department of Mechanical Engineering on in partial fulfillment of the requirements for the Degree of Master of Science
in Mechanical Engineering Abstract
As the supply of natural gas continues to dwindle, and government decontrol of pricing progresses, the rising cost of this essential natural resource will drive more individuals to consider various forms of pilferage as a way of reducing their financial burden. Today, according to numerous gas utilities, significant revenues are being lost via theft of service, losses which are ultimately passed on to the businesses' honest customers.
A method to detect such thievery developed at the Massachusetts Institute of Technology for Consolidated Edison of New York, was the design of a
secondary flow metering device. Located outside a suspected concern, and placed within the small confines of a modified valve or pipe structure, its function is to act as a cross reference for the existing positive displacement meter. The concept chosen was the phenomena of vortex shedding, a fluid
oscillatory instability which is used extensively as a measuruing technique in the process control industry. Feasibility studies were carried out using a flat, non-moving bluff shedding element and a piezo-electric bimorph ceramic cantilevered behind it. Both elements were situated within a curb valve based prototype design having a test section inner diameter of one inch. As
predicted, experiments demonstrate a repeatable, linear relationship between frequency of oscillation and volume flow for flow rates between 200 and 1000 CFH. A requirement of less than one inch of water column pressure drop across the test section was also achieved. The output signal of the bimorph varied from millivolts to several volts throughout the same specified flow range. In addition, the oscillations may be simply counted to yield and integration of the total volume delivered.
The success of the concept suggests that a Phase II program, in which the laboratory design is incorporated into a device suitable for rigorous field tests by the utility, should be pursued.
Thesis Supervisors: Dr. Carl Peterson Associate Professor Dr. Leon Glicksman
ACNOWVLEDGEMENTS
To thank everyone who helped and participated in my MIT experience would be quite difficult. My transition from an undergraduate physics background to mechanical engineering was at times quite arduous. The
en-couragement, assistance and advice from many exceptional people made the bumpy road quite a bit smoother and allowed me to reach this goal.
Although a general "Thank you" to all those people is in order, certain special regards must be made.
I would like to thank Consolidated Edison of New York for allowing me to complete my graduate education with their support.
I would also like to thank my research advisors, Dr. Carl Peterson and Dr. Leon Glicksman for their advice, patience and understanding.
Sincere thanks goes to Aubrey Rigby whose instruction, patience and understanding were essential for the building of the prototype.
My thanks and best wishes to my research associatep, apartment mates and office mates for always listening and being a friendly but challenging
sounding Doard.
Thank you to my wonderful typists, Leslie Regan and Joan Gillis. A special thanks is given to my loving family especially my Father, without whom the completion of this thesis would not have been possible. And finally, the biggest thank you goes to Paula Anne, who has borne with me and shared all my joy, frustration, pain and accomplishment
TABLE OF CONTENTS Page TITLE PAGE. ... ... ... 1 ABSTRACT... 2 ACKNOWLEDGEMENTS... ... 3 TABLE OF CONTENTS... 4 LIST OF FIGURES ... 6
CHAPTER 1 : THE MIT/CONSOLIDATED EDISON GAS THEFT DETECTION PROGRAM ... 8
1.1 Introduction...8... 8
1.2 Primary Goals... 8
1.3 Early Work... 9
1.4 The Consolidated Edison Transmission System and Requirements... 9
1.5 Location of the Flow Metering Device... 13
1.6 Selection of the Internal Flow Measuring Technique ... 14
CHAPTER 2 : THE THEORY AND PRACTICAL DEVELOPMENT OF VORTEX SHEDDING ... 19
2.1 Theoretical Background... 19
2.2 Industrial Development... 22
2.3 Industrial Operating Specifications... 23
2.4 Vortex Shedding as a Gas Theft Detection Metering Technique... 25
CHAPTER 3 : THE DEVELOPMENT DESIGN AND CONSTRUCTION OF THE PROTOTYPE... 26
3.1 Sensor Design... 26
3.2 Curb Valve Prototype Selection... 28
3.3 Prototype Construction... 30
CHAPTER 4 : EXPERIMENTAL GOALS AND APPARATUS... 36
CHAPTER 6 : DISCUSSION OF RESULTS... 48
6.1 General Considerations... 48
6.2 "K" Factor Determination... 49
6.3 Pressure Drop Analysis... 50
6.4 Final Remarks... 57 CHAPTER 7 : CONCLUSIONS... 58 REFERENCES... 60 APPENDIX I...63 APPENDIX II ... 65 66 BIBLIOGAPHY...
LIST OF FIGURES FIGURE NUMBER 1 2 3 4 5 6 7 8 9 10 11 12 13 14 15 16 17 18 19 20 21 TITLE PAGE
Typical Hourly Flow Distribution for Commercial
Customers... 11
Typical Hourly Flow Distribution for Residential Customers... 12
Gas Service Line Schematic... 16
The Phenomena of Vortex Shedding... 20
The Foxboro Vortex Shedding/Sensor Element... 27
The Rockwell Polyvalve Design... 29
Prototype Cross Section... 31
Milled "T" Slots of the Prototype Test Section.... 33
Prototype Test Section... 34
Exploded View of the Prototype Test Section... 35
Experimental Test Rig Schematic and Prototype... 37
PVC Pipe and Tapers... 39
Prototype Mounted in Test Rig and Differential Pressure Meter... 39
Blower and Primary Reference Meters... 40
Piezo-electricBimorph Output at 240 CFH... 43
Piezo-electric Bimorph Output at 840 CFH... 43
Frequency versus Volume Flow Rate for a Supported Bimorph... 45
Frequency versus Volume Flow Rate for an Un-supported Bimorph... 46
Individual "K" Factor versus Volume Flow Rate... 51
Percent Deviation from the Mean "K" Factor versus Pipe Reynolds Number... 52
Theoretical and Experimental Pressure Loss Across the Test Section... 55
FIGURE NUMBER TITLE PAGE 22 Theoretical Pressure Loss Across the Test Section
The increasing occurence of gas theft prompted Consolidated Edison of New York to consider ?he development of a means to detect this clandestine activity. The utility desired a secondary method to determine the amount of volume delivered to a customer. This was to be compared with the dwelling's positive displacement meter to note any discrepancy. Consolidated Edison needed only a detection method of limited accuracy, since the primary goal was only to determine if theft was occuring.
Working with an MIT research group, the development of an internal flow sensor was viewed as the best method to achieve detection. This involved the incorporation of a flow measuring technique into the stem of a curb plug valve. A device utilizing vortex shedding was considered the best candidate for the detection meter. As a fluid oscillatory instability, vortex shedding posseses the useful feature of a linear relationship between the frequency of vortex oscillation and volume flow.
Further, its frequency output may be viewed as digital, allowing for easy integration of the volume flow. In this case, each cycle may be recorded electronically as a single pulse which in the linear case, is directly proportional to a specific quantity of flow. Thus the total volume is obtained by simply counting pulses. With this record of integrated volume, the detection
Not only could this device serve as an indicator of theft (if any discrepancy exists), but it also could reveal the efficacy of present prevention methods such as locks, warning stickers, and
seals. In addition, it could be used to determine actual consumption patterns and be of service in plotting long term
strategies on the gas theft problem.
The experimental program carried out by the author was a success. A distinct linear relationship between volume flow and frequency of oscillation is apparent for flows greater than 200 CFH. Experiments have also shown this performance to be repeatable. The low flow resolveability requirement for commercial customers was set at 250 CFH by Consolidated Edison spokesmen. The prototype, patterned after a 1.25 inch Rockwell Polyva]ve Plastic Plugvalve, satisfies this requirement, and thus could feasibly serve as an industrial detection device. Further, the utility's desire not to exceed a one inch of water column pressure drop across the test section has been achieved. The magnitude and uniformity of the piezo-electric ceramic's output signal was astounding throughout the 50-1000 CFH flow range. The sensitivity of the bimorph crystal exceeded all expectations and may be of great help in any electronics design.
Despite these sucesses, the gas theft detection meter is still in its infancy and requires further practical and theoretical development. Although meeting the commercial guidelines, the prototype is unable to satisfy the 90 CFH resolveability
due to the fact that the one inch test section inner diameter is too large to allow the lower volume flow rates to enter the linear regime. Tests must be run for a smaller inner diameter prototype to determine if the residential resolveability requirement can be met. In addition to testing smaller diameter test sections, other plug valve designs, and a functioning plug valve/meter must be tested.
Although further fluid mechanical optimization in terms of the blockage ratio, test section diameter and correlation length is possible, the overriding goal must be the establishment of a detection device suitable for field tests by Consolidated Edison. Phase II research would also concentrate on signal storeage, integration, and retrival. The outstanding performance of the piezo-electric bimorph ceramics should simplify the design of any electronic totalization system.
Chapter 1
The MIT/Consolidated Edison Gas Theft Detection Program
1.1. Introduction
The unexplained loss of purchased gas stocks (estimated as high as 10% in 1981) motivated Consolidated Edison of New York to undertake a major project aimed at resolving this costly problem [I]. The endeavor consisted of a three pronged approach designed to provide better resource management and conservation. One of the three approaches essential to the Consolidated Edison project was gas theft detection. The development of a flow meter suitable for this purpose is the subject of this work.
1.2. Primary Goals
The primary goal of the Gas Theft Detection Program was to develop an independent metering system which would provide a secondary measurement of total gas consumption. The reading obtained from this secondary system would be compared with conventional positive displacement meter readings. Any discrepancy in which the secondary meter value was greater than that of the conventional meter would indicate pilferage [2].
1.3. Early Work
The search for an adequate detection method included a review of both external and internal flow measuring techniques. External methods e.g. a flue gas temperature sensor, proved to be ineffective because of problems with data storage, the distribution of individual appliance gas consumption and overall system operation. This led to the consideration of internal or direct flow measurement. This technique would allow the entire passing flow to be measured and thereby eliminating the difficulties inherent in external methods.
Despite this advantage, the basic questions of how and where to measure the total flow remained. The implementation of a total flow metering technique depended on the nature of the Consolidated Edison gas distribution system and the requirememts expressed by the utility for any internal detection device.
1.4. The Consolidated Edison Transmission System and Requirements
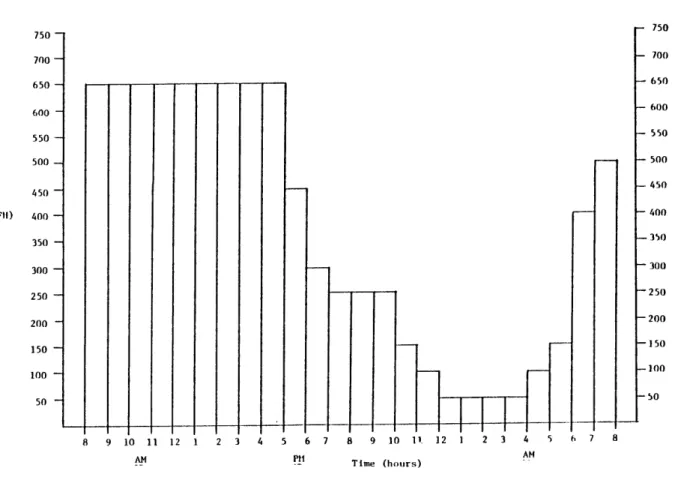
The gas distribution network developed and maintained by Consolidated Edison stretches some 4200 miles, servicing well over three hundred thousand customers [3]. The number of commercial and residential concerns are approximately equal but the average peak and total amounts of gas delivered vary
considerably. Figures 1 and 2 portray typical winter season consumption patterns for regular industrial and residential heating consumers [4].
The gas is distributed through area mains and passed through individual services to the particular concern. A Consolidated Edison report published in 1979 documents that 93% of all service lines are from one-half to two inches in diameter. In addition, 70% of these operate at pressures rated from four (the legal New York State minimum delivery pressure) to twelve inches of water
[5).
Based on these system specifacations, Consolidated Edison established the following requirements for a internal flow metering gas theft detection device:
1) Possess a low flow resolvability of at least 90 CFH in the residential and 250 CFH in the comm-ercial while operating within the range of res-idential (-0-225 CFH) and commercial (50-1000 CFH) Flowrates.
2) Produce a pressure drop acros the unit of no more than one inch of water.
In setting these low flow values, the utility allowed for approximately 30% of the residential and nearly 50% of the industrial gas consumptipon to be non-accountable [6]. A research goal was to decrease this non-accountable portion of
700 -650 -600 -550 -500 -450 Volume Flow Rate (CFII) 400
350 300 -250 200 -150 100 50 8 9 10 11 12 1 AM 700 650 600 550 500 450 400 35() 300 "250 200 150 100 50 2 3 4 5 6 7 8 9 10 11 12 1 2 3 4 5 Time (hours) AM
Figure 1: Typical Hourly Flow Distribution for Commercial Customers
(from Consolidated Edison)
200 -200
180 - - - I80
160 -- I- 160
Volume Flow Rate (CFII) 140 - - -140
120 - I ' -120 100 - 00 60 0-40 -- -40 20 -- I 1 a -20 8 9 10 11 12 1 2 3 4 5 6 7 8 9 10 11 12 1 2 3 4 5 6 7 8 AM PM AM Time (hours)
1.5. Location of the Flow Metering Device
The performance requirements were applicable to any general type of internal detection device. The location of the device resulted in further constraints.
Because of the nature of gas theft, any detection system must maintain some degree of secrecy. Blatant or obvious company
activity may warn a perspective thief, severly undermining the goals of the detection program. There was also a need to minimize construction costs, since to rip up either a street or
sidewalk in order to install such a device would not only be expensive but counterproductive (7].
The utility was also faced with the problem of iurisdiction. Meter spot checks are very difficult to conduct because of the inability to gain access to a dwelling. Although a positive displacement meter located outside a concern would be ideal, it is not a feasible alternative owing to excessive installation costs. Thus, Consolidated Edison concluded that an externally located detection device, even if less accurate than positive displacement meters, was the best immediate solution [8].
Initial considerations varied from street transmission mains to somewhere within the service lines. After further review, the modifacation of an existing valve structure was suggested. The
new valve would possess some means of measuring and storing flow data while simultaneously fulfilling its original function. An
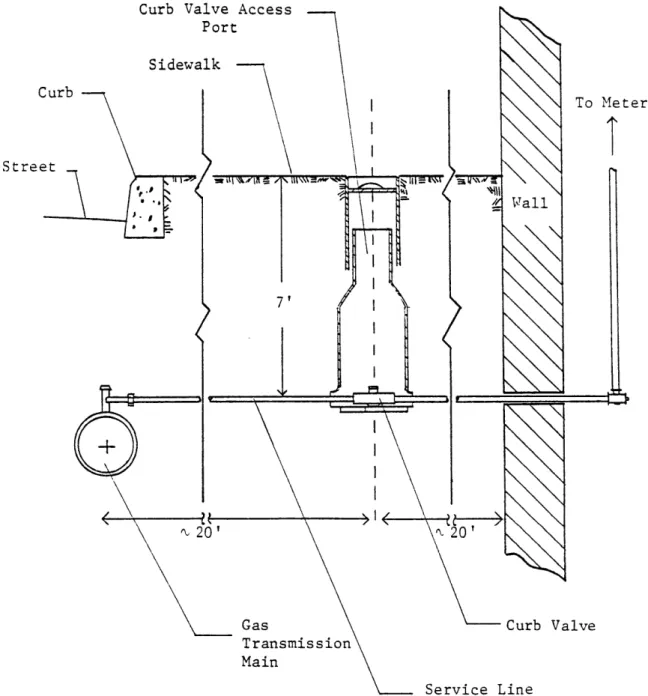
SAeal choice was the curb valve, a plug val.ve located in the service line hetween the main and the customer's positive AIspOacement meter . Acting as an on-off switch, this device is used to remove or start a dwelling's gas flow. The valve is easily accessible through a conduit that straddles the service line (Fig. 3). The device is operated by a T-wrench which is inserted through the same opening.
It was concluded that the placement of a metering tool within the stem or plug of the curb valve was the best approach The periodic replacement of such valves (those curb valves containing
the new flow measuring instrumentation) was a scenario in which Consolidated Edison felt the secrecy goal would be met. Also, the modified curb valve fulfilled the needs of minimized construction costs while being within the utility's jurisdiction.
1.6. Selection of the Internal Flow Measuring Technique
The selection of the appropriate metering technique was the subiect of an intensive literature search and correspondences with industrial manufacturers. The requirements of secrecy, low cost and iurisdiction as well as the curb valves small sizes
forced the consideration of techniques which were simple from both a mechanical design and flow sensing point of view. Due to these considerations, the maiority of "off the shelf" flowmeters, i.e. positive displacement and head meters, were inappropriate
Curb Valve Access Port Street I p . , , / . -7' 20' 20' Gas
CL
Transmission Main Service LinFigure 3: Gas Service Line Schematic
(from Consolidated Edison Drawing Number EO-13087-A)
Meter
T
for theft decection applications.
The determination o4 the cumulative or total amount of gas delivered to a customer was a fundamental requirement of any gas theft detection device. A large segment of industrial meters operate in a continuous or analog fashion, making the integration of flowrate a complicated procedure. These meters were also considered not suitable for detection applications. Certain metering systems however may he thought of as digital. The primary element of such meters (i.e. that which produces the measureable disturbance [91) generates a cyclic or frequency output, this often appearing as a sinusoid. The frequency may be associated with a natural oscillatory phenomena or a manufactured
element such as a rotating turbine wheel. If a linear relationship exists between the frequency and volume flow, then:
Vol cycles time time or: Cycles Pulses = - K .... 2 Vol. Vol
where K is some arbitrary constant and each cycle corresponds to a single pulse produced by some secondary electronic device. It may he seen that the integrated or cumulative volume is simply
the product of some empirically determined constant K and the total number of generated pulses.
The turbine meter, a device with a digital output derived from a set of rotating blades, was thought to be a promising technique. The device is employed extensively in the process industies because of its rangeability, minimal pressure drop, and
linear Frequencv output. The design group conjectured that placing a paddlewheel arrangement within the stem or plug of the curb valve was the best approach. Using reluctance circuits or piezoelectric pickups [111, individual pulses were to be created per cycle of rotation, with each pulse corresponding to a given amount of flow . These pulses could then be incrementally stored, with the total proportional to the total volume delivered.
The operation of the turbine meter however posed some concern. Since it incorporated a rotating wheel, friction problems at low flows were possible. It was determined that a metering technique in which no moving elements were employed, would avoid not only the problem of bearing drag but also wear and fatigue.
The efforts to develop a device with no moving parts and a linear frequency output proceeded to considerations of methods which posessed a natural oscillatory behavior. In this case a primary element generates a phenomena cyclic in character. This would then yield the sinusoidal frequency output deemed necessary for simple integration.
In the early 1970's, a flowmeter was designed using the principle of vortex shedding. Employing a measuring concept akin to that of a flag blowing in the breeze, this device possessed the key features of no moving parts and a linear relationship between frequency and velocity within a certain operating range. The meter's rugged and simple design, in addition to its successes in process control applications [12], suggested a
similar concept might be suitable as an internal flow metering detection device (121. The possibilities of vortex shedding as a simple flow measuring scheme, incorporated into an existing curb valve structure, motivated a design and experimental program aimed at proving the concept's feasibility.
Chanter 2
The Theory and Practical Development of Vortex Shedding
2.1. Theoretical Background
Vortex Shedding is a fluid mechanical oscillatory instability in which a trail of rotational flow zones is formed in the wake of a bluff object [13]. This trail is refered to as the Karman Vortex Street.
The first quantitative analysis of vortex shedding was completed by V. Strouhal in the latter 1870's [14]. Intrigued by "singing wires", or the presence of distinct audio signals when the wind blew through telegraph cables, his results documented the characteristic variation of frequency with velocity. Figure 4, from K. Zanker and T. Cousins paper "The Performance and Design of Vortex Meters", depicts this variation in terms of non-dimensional frequency (Strouhal Number) and non-dimensional velocity (Reynolds Number). In this case:
f'd
S (Strouhal Number)=f-- ... 3 V
V'd
Re (Reynolds Number)=- ... 4
where f is the frequency of oscillation, d some characteristic dimension of the bluff body which sheds the vorticies, V the free
stream elocitv, and v the dynamic viscosity. A schematic representation of the phenomenon is also presented in the same diagrai'. Separated Boundary Karman Layer Vortex Street Incident d zre
Flow
3
<
0.3 0-/ * 0Circular Cylinder 0.2 S = fed Flat Plate - i 3 I I I I 102 103 104 105 106 107 Re = V*dFigure 4: The Phenomena of Vortex Shedding (from K. Zanker, T. Cousins,"The Performance of Vortex Meters")
The formation of the vortex street may be attributable to boundary layer separation and the subsequent curling and eventual detachment of this free jet. From the Kutta- Joukowsky Circulation Theorem, the asymetric growth and shedding of the separated boundary layer generates a sinusoidally oscillating lift force [15]. Today, it is this fluctuation of velocity and pressure which is measured by commercial vortex shedding meters.
begun by Anatol Roshko of the California Institute of technology. In an attempt to understand form drag as revealed in the mechanisms of boundary layer separation and the development of wake structures, his writings presented one of the first in depth and rigorous studies of the phenomenon. His 1954 paper, "On the Development of Turbulent Wakes from Vortex Streets" documented the existence of a flow regime characterized by a direct proportionality between the frequency of vortex shedding and flow velocity. In this region the Strouhal Number is constant and independent of the Reynolds Number, indicated by the horizontal segment of the curve in Figure 4 [16]. This linear behavior is first noted to occur for a circular cylinder at a Reynolds Number of approximately 1000, but varies with the bluff body shape (i.e. linearity begins at approximately 5-6000 for a flat plate [17]). This linearity seemed ideally suited.for development into a flow metering device and in fact was suggested by Roshko in the same paper [18].
Further pioneering work was done at the University of Toronto and by Kent Instruments. Research revealed that the undesireable distortion of the output signal's frequency and amplitude, characteristically noted in earlier investigations, could be reduced by observing certain design constraints and instrument proportions. For example, theoretical studies had revealed the existence of cell-like structures along the length of the bluff body from which the rotational flow zones originated (19]. Using flat plates to isolate a short length of a circular cylinder, Dr.
P.T.
Keefa
oF Toronto demonstrated that the magnitude of the derived lift coefficient significantly increased as the distance between the plates was reduced. This lead to the use of a correlation length concept, defined as the length of a particular cell along the length of a bluff body. The presence of signal distortion was thought to be the result of interactions between adjacent cell formation zones [20] or the presence of free stream turbulence [211. By minimizing these turbulence levels and observing a particular correlation length (3-7 times the bluff body thickness [22]), it was experimentally established that the separated boundary layers behaved as two-dimensional sheets, producing strong uniform vorticles that were easily detectable.Along with the correlation length, the ratio of bluff body thickness to flow passage diameter, denoted as the blockage ratio, appears as the other significant factor in the reduction of signal distortion. Mr. T. Cousins of Kent Instruments showed that the level of signal distortion was greatly reduced and the lift coefficient enhanced when the blockage ratio was between 0.25 and 0.4. It was speculated that these positive results were due to the minimization of wall interference effects
[23].
2.2. Industrial Development
and correlation length, industrial concerns have honed the early designs to develop a vortex shedding flow meter of remarkable performance capabilities. With the generation of a virtual two dimensional shedding phenomena, the output signal has been maximized, thereby eliminating the need for complex electronic processing and enhancing systems [241. Various concepts, differing in bluff body shape and vortex sensor position and type, exist among the suppliers [251. All possess the common feature of a characteristically clean and well-defined output within the linear range of operation. The meters' successes in process control applications over the last ten years, along with their rangeability, ruggedness, and digital output, are quite noteworthy [261.
2.3. Industrial Oerating Specifications
Most commercial meters are produced in sizes that range from two through eight inches. One of the smallest industrial device has an inner diameter of one inch and is suitable only for liquid and two phase water flows [27].
Vortex meters possess a rangability (ratio of high to low flowrate) of approximately fifteen or twenty to one. This is far in excess of many other meters and is limited by the disappearance of the shedding phenomenon at low flows and cavitation or compressibility effects at higher flows [28].
In order to guarentee oerformance and meet the process control industry demands of high accuracy and repeatability, many manufacturers require an operating Pipe Reynolds Number (dependent on the pipe diameter) of at least 10 At values greater than or equal to this, the Strouhal Number (non-dimensional frequency) becomes constant [29]. Operation below 104 requires a calibration of the vortex meter by the manufacturer. Below a Pipe Reynolds Number of 5000 the vortex shedding phenomenon breaks down yielding a sensor output that necessitates complex electronics for analysis [30]. This deterioration of vortex shedding is attributable to a change in the structure of the separated boundary layer and resulting wake.
The performance of vortex meters is specified in terms of a Meter or "K" Factor [31]. This "K" Factor is the ratio of
frequency to volume flow and from Equation 2 is a constant throughout the linear range of operation. For liquids, industrial vendors (i.e. Kent, Yokogawa, and Eastech) guarentee all frequency/volume flow ratios to fit within a 0.5% span about some mean "K" Factor. Because of the difficulty of calibration for gases, specifacations for flowmeters used in gas applications are in the range of 1.5% [32]. The degree of scatter about a mean calibration point is closely tied to the accuracy and degree of linearity. A variation above 2% generally classifies a meter design as being non-linear, and therefore not suitable for
2.4. Vortex Shedding as a Gas Theft Detection Metering Technique
The application of vortex shedding as a gas theft detection metering system was unique compared with commercial development and specifacations. The small sizes of the Consolidated Edison service lines (i.e. 1/2-2 inches in diameter) as well the incorporation of the meter into a curb valve geometry were entirely new. In addition, vortex meters had never been used in conjunction with a gaseous medium in which simplicity of design, small diameter pipes and low flowrate conditions were simultaneous constraints.
The Pipe Reynolds Numbers associated with these flowrates (i.e. Re = 2000-20000 for a one inch diameter section) were below those specified by industrial standards. Thus, the performance of the prototype meter was not comparable to any existing industrial meter.
Since the primary goal of the Gas Theft Detection Program was to develop a simple pilferage indicator, the rigorous performance characteristics of industrial meters were not required. This leeway suggested a detection meter utilizing vortex shedding was worthy of further study. In addition, the meter's lack of moving parts, its use of a natural oscillatory phenomenon and the resulting characteristic digital output (which allows for simple integration to determine total delivered volume) motivated the establishment of a prototype development and experimental program.
Chapter 3
The Development, Design and Construction of the Prototype
3.1. Sensor Design
The observance of blockage ratio and correlation length parameters have produced a two dimensional shedding phenomena that can be easily measured. Commercial meters employ a variety of techniques to detect the local changes in velocity and pressure characteristic of a vortex. Conventional pressure and thermistor temperature sensors have been used by a number of manufacturers. The difficulties of each of these methods (i.e. poor resolvability, non-linear response and excessive power requirements) have led some firms to use more exotic measuring techniques such as ultrasonics.
The Foxboro Company of Foxboro, Massachusetts has developed a commercial vortex meter which uses a piezo-electric ceramic to measure the alterations of the cyclic pressure. Piezo-electricity, refered to as "pressure electricity" arises due to the shifting of polar molecules under an applied stress [34]. This redistribution causes a potential difference to arise across the material, causing it behave as a voltage source. Although inherent to certain crystalline materials, ceramic
structures may be endowed with piezo-electricic properties through the process of poling. This involves heating the material and placing it in an intense electric field, causing the random crystalline domains, characteristic of ceramics, to align along a common axis (351. These ceramic piezo-electric materials possess the same properties as their crystalline counterparts within certain limits of electro-magnetic field strengths and thermal stressing. The primary advantage of these ceramics is their low cost.
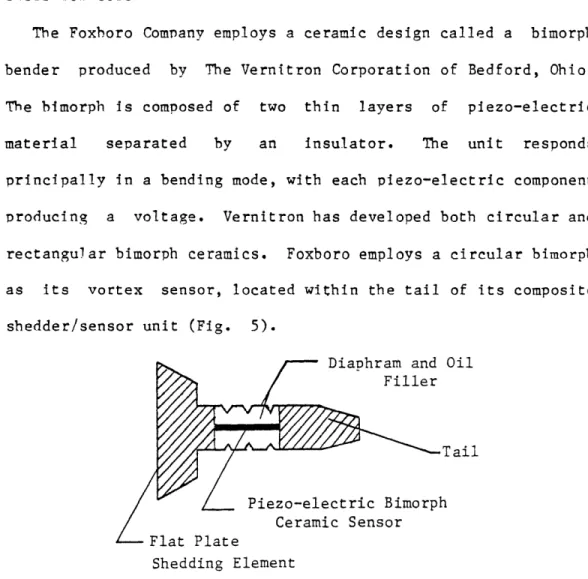
The Foxboro Company employs a ceramic design called a bimorph bender produced by The Vernitron Corporation of Bedford, Ohio. The bimorph is composed of two thin layers of piezo-electric material separated by an insulator. The unit responds principally in a bending mode, with each piezo-electric component producing a voltage. Vernitron has developed both circular and rectangular bimorph ceramics. Foxboro employs a circular bimorph as its vortex sensor, located within the tail of its composite
shedder/sensor unit (Fig. 5).
Diaphram and Oil Filler Tail Piezo-electric Bimorph Ceramic Sensor Flat Plate Shedding Element
Figure 5: The Foxboro Vortex Shedding/Sensor Element (courtesy The Foxboro Company)
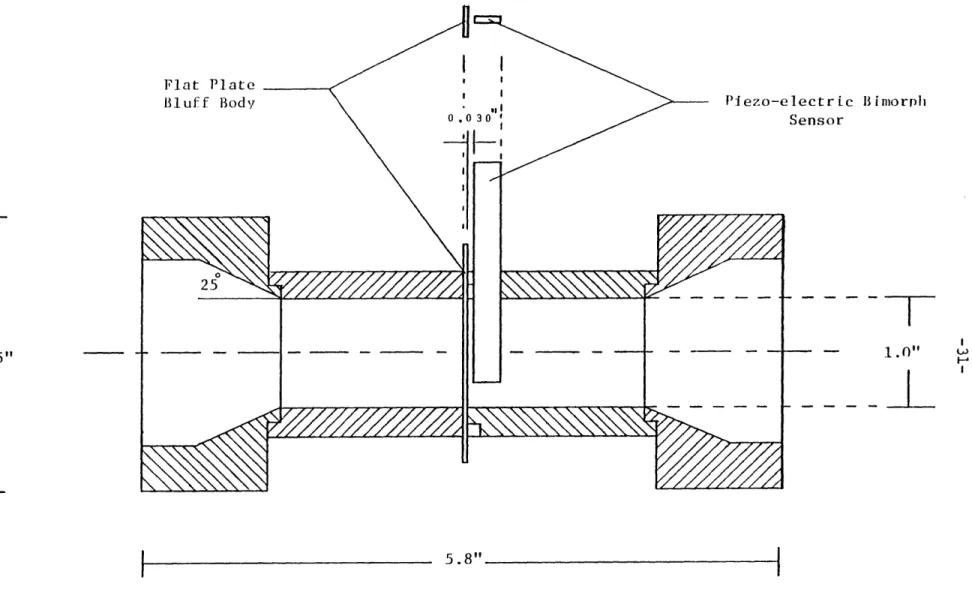
A configuration similar to Foxbcro's which employs a simpler pressure sensing concept has been ucilized in the current design. The unibody sensor/shedder construction of Fcxboro was reolaced by two separate elements, the tail of which was a cantilevered piezo-electric bimorph. In order to maximize the sensor's voltage output, an approximate thirty mil space was placed between the bimorph and bluff body. The bimorph sensor was to extend a certain distance into the test section, behind a bluff body of particular shape and blockage ratio. This vertical distance from the point of cantilevering was refered to as the moment arm.
3.2. Curb Valve Prototype Selection
Curb valves are simply plug valves, so called because of a tapered plug situated within the body of the valve. The plugs or stems of these valves contain either a round or rectangular port with an area 35 to 90% of the area of the connecting pipe. This reduced area section was viewed as a major advantage due to the linear shedding regime's dependence on flow velocity.
Information from Consolidated Edison and various industrial vendors revealed that many such valves possess structural designs that would greatly inhibit the performance of a vortex shedding meter. Short plug lengths, rough wall interiors, and non-uniform cast plug bodies are features that could generate complicated
fluid asymmetries and turbulence . Because of the vortex shedding phenomenon's sensitivity to such disturbances, the use of conventional plug valves was rejected.
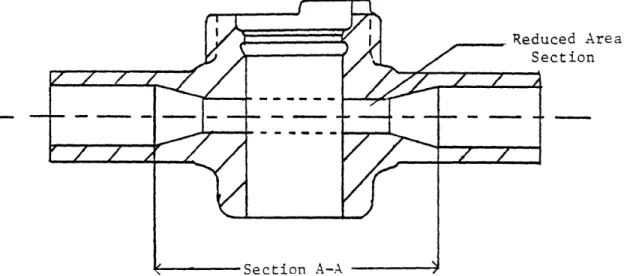
One valve however stood out from the rest. The Polyvalve Plastic Plugvalve, manufactured by Rockwell International, seemed to provide the best geometry for effective vortex shedding. A cross section view of the valve may be seen in Figure 6 .
Reduced Area Section
Section A-A
Figure 6: The Rockwell Polyvalve Design (courtesy Rockwell International)
The valve's long reduced area section (including the plug) and smooth plastic interiors seemed conducive to the establishment a linear two- dimensional shedding phenomenon. In addition, conversations with a Rockwell spokesman indicated a willingness of the company to assist in any developmental work and in the eventual manufacturing of a gas theft detection meter [37].
For these reasons, the Rockwell Polyvalve Plastic Plugvalve was chosen for feasibility experiments. The incorporation of a
vortex shedding meter and its successful linear operation were thought best achieved by patterning the prototype after the Rockwell design.
3.3. Prototype Construction
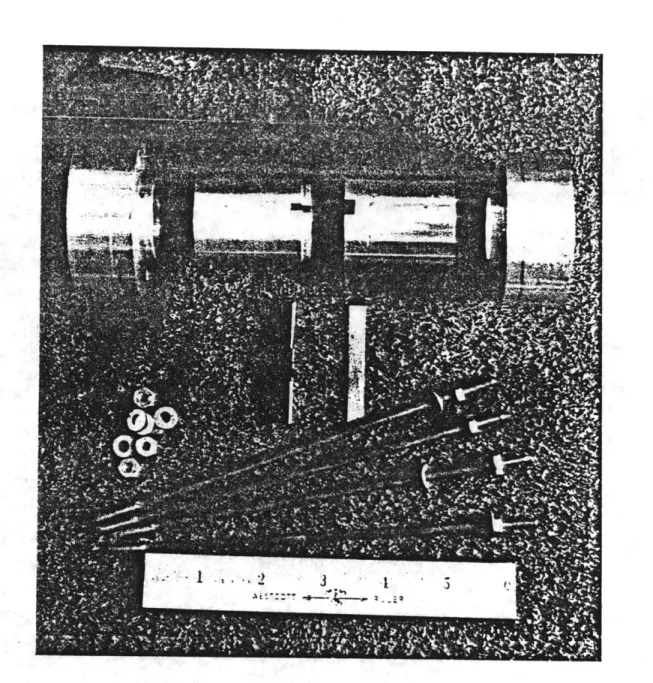
The construction of this test section was completed in the Mechanical Engineering Shop at MIT. Consultations within the design group and with the facilities machinist produced a structure that was divided into four parts, two ends and two center sections. Each was made from aluminum stock and machined by the author.
The test section was patterned after section A-A of the Rockwell valve (Fig. 6). An exploded view of the prototype may
be seen in Figure 7. Its composite length was 5.8 inches, with each of the individual parts held together by four machined seven inch rods.
The end sections were patterned after the entrance and exit cones of the Rockwell valve. Both were designed so that the insertion of a 1.25 inch nominal P.V.C. pipe was possible. Although specified at fifteen degrees, the cones were machined to an angle of twenty-five degrees .
The two separate center pieces were required so that the bluff body and piezo-electric sensor could be installed. Each piece was machined from 1.5 inch aluminum stock and individually bored
.
I
-I
5.8"
Figure 7: Prototype Cross Section
to an internal diameter of approximately one inch. The two sections were distinguished as either double shouldered (holding the bluff body) or conLaining a lip/shoulder arrangement (holding the blmorph).
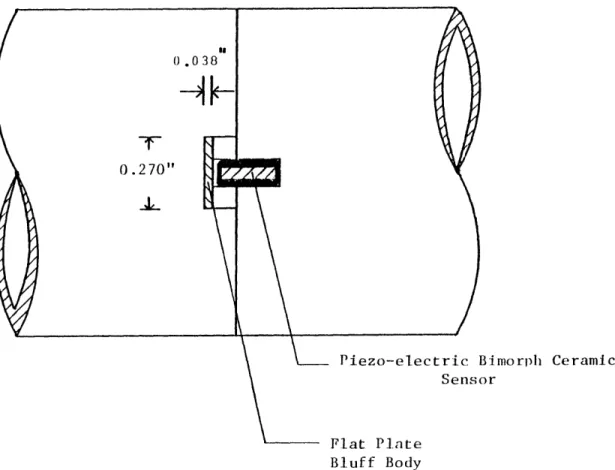
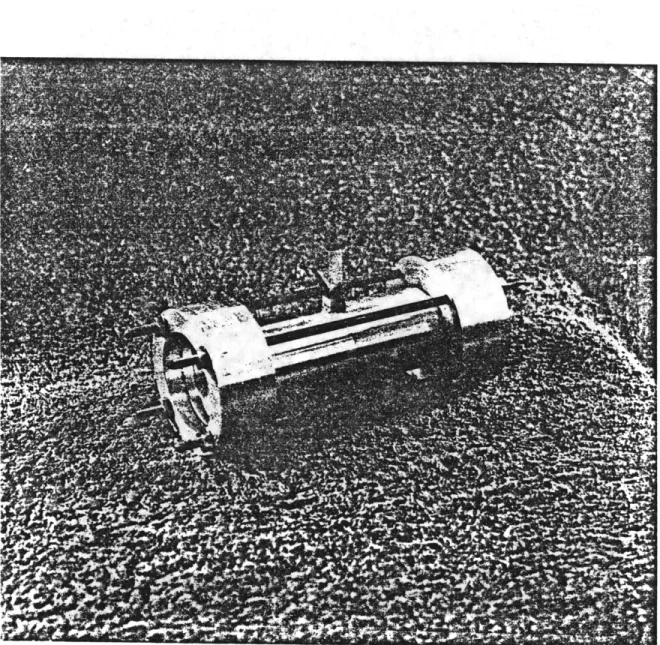
The actual meter design was similar to the Foxboro Concept (Fig.5) but far less complicated. Using sheet steel 0.038 inches thick, a flat plate was made as the bluff body. Machined so that the common industrial blockage ratio of 0.27 was achieved, this was coupled with a sixty-one mil bimorph/copper electrode package. The bimorph was a PZT-5B type, noted for its sensitivity. Electrical tape; while also serving as a necessary spacer acted as an insulator, preventing any shorting of the voltage producing piezo-electric ceramic by the aluminum valve procotype. The vortex meter elements were placed in milled slots that resemble a "T" when the two center sections are placed together (Fig.8). The photographs in Figures 9 and 10 depict the test section used in the vortex shedding gas theft detection meter feasibility experiments.
Piezo-electric Bimorph Ceramic Sensor
Flat Plate Bluff Body
Chapter 4
Experimental Goals and Apparatus
The purpose of experimentation was to determine the feasibility of the vortex shedding curb valve flow meter. The tests were to stress linearity and repeatibility; i.e.: the extent of a linear relationship between volume flow rate and frequency of vortex oscillation and its ability to be reproduced. This particular linear relationship was required in order to simply intergrate a customer's total delivered volume. Since the aim of Consolidated Edison Gas Theft Detection program was the development of a simDie and reliable secondary flow meter for comparison purposes, this straight-forward integration capability was of prime importance.
Initially a variety of bluff bodies and sensor arrangements were to be tested. Studies of a flat plate/piezo-electric sensor unit were eventually suggested for immediate feasibility analysis. The effects of varying the himorph's moment arm or distance from the point of cantilevering, (this increasing or decreasing the amplitude of the voltage output) were also to be examined.
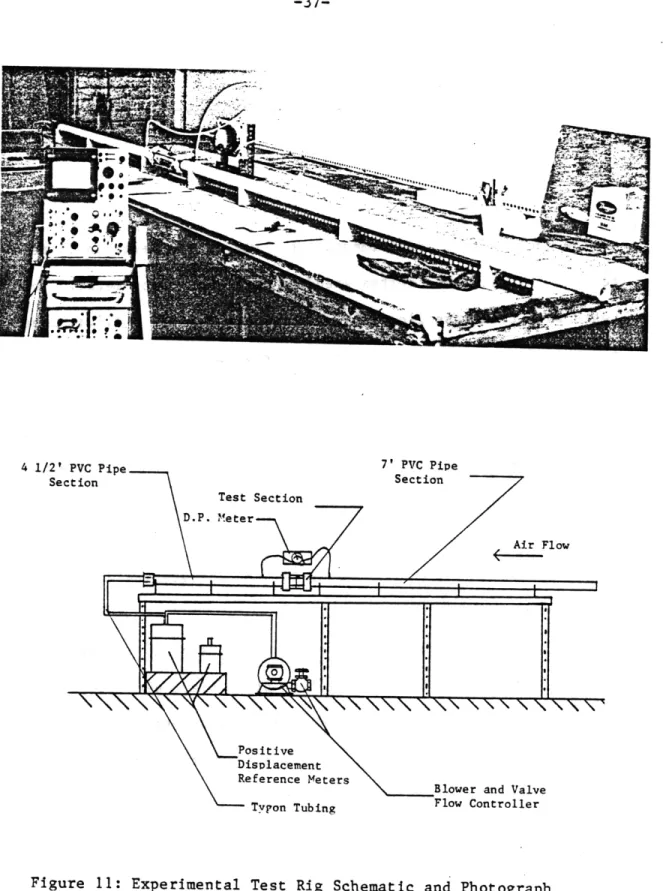
The actual test rig used in the feasibility studies may be seen in Figure 11. It consisted of 1.25 inch P.V.C. piping with
4 1/2' PVC Pipe Section Test Section D.P. 'Meter
_
M---7' PVC Pipe Section Air FlowT.T
1.
\\\\
\
\N N-- x \ N\ \\\ \\\ \~\
\ \ Positive DisplacementReference Meters Blower and Valve
Tyr'on Tubing Flow Controller
STy~on Tubing
Figure 11: Experimental Test Rig Schematic and Photograph
II I 2 N
\\\
\\\1%\
-a straight seven foot upstream seccion and a 4 and 1,'2 foot section downstream of the prototype.
The two ends closest to the test section were tapered to an angle of fourteen degrees (less than the prototype's twentyfive degree cone angles) to avoid any disturbance producing discontinuities. 0 rings were installed adjacent to these tapers in order to provide a sealed friction fit when the prototype was put into position (Fig. 12). Static pressure taps were placed 6
and 1/2 inches from these two ends. Each was connected to the ports of a 0 to 1 inch of water column Dwyer Magnehlic differential pressure meter, to measure the headloss across the test section (Fig 13).
The primary reference meters were conventional gas meters: a Rockwell 250 positive displacement meter for domestic use and a Rockwell Class 1000 positive displacement meter for large demand customers. These meters acted as the measuring standards and were needed to handle the approximate 50-1000 CFH range of flow rates. They were obtained from and calibrated for air by Consolidated Edison. The 1.25 nominal P.V.C. piping was connected to the primary reference meters by a 1.25 to 3/4 inch reducing coupling, and 1 and 1/8 inch outer diameter Tygon plastic tubing.
For simple operation, the Tygon hosing was used to allow for the interchanging of connections between the P.V.C. piping, the flow source, and the primary reference positive displacement meters. The flow source was a blower operating in the suction
mode downstream of the primary meters , in order to reduce compression pulses. The Tygon hosing was chosen to avoid collapsing under the low pressure conditions. It was securely fastened to all connection points via the use of pipe clamps. The blower was rated at 50 CFM, with a maximum differential pressure of approximately seventeen inches of water. Control of the air flow was achieved by throttling with a globe valve placed at the outlet port of the blower (Fig. 14).
Ana
Figure 14: Blower and Primary Reference Meters
Collection of data from feasibility experiments was completed through use of a Tektronix Type 564 storage oscilloscope. Its ability to maintain the piezo-electric voltage trace allowed for simple visual determination of the oscillation frequency. In addition, a Compass Instrument's stop watch was used to determine the time required for a certain amount of volume to be registered by the reference meters.
hapter 5
Experimental Procedures and Results
Each prototype feasibility experiment involved the positioning of a bimorph sensor package within the test section. The free vertical length of the crystal varied from 1/4 to 3/4 of an inch. Machined test section pieces were sealed to prevent leakage by using tape and stopcock grease. Special care was taken near the milled slots that held the flat plate bluff body and
piezo-electric sensor package.
A given experiment consisted of recording data for some fifteen to twenty experimental data points with each point described by three separate trials. A particular point was set by adjustment of the globe valve, this regulating the amount of air flow through the test rig. By specifying the number of revolutions of a *positive displacement meter's dials, and recording the elapsed time with the stop watch, the volume flow rate was deduced.
Each operating point was assumed to be at steady-state, allowing for the independent recording of experimental volume (independent variable) and frequency (dependent variable) data. The storage oscilloscope was triggered to operate in the single sweep mode, recording and maintaining the piezo-electric sensor's
7oltage output trace. By counting the number of peaks and their horizontal extent , individual trial oscillation frequencies could be determined . Each final data point was the average of ,he three separate runs. The pressure drop across the test section was recorded.
Initially, experimental results were difficult to interpret because of noise in the signals. The use of a differential
amplifier module (Tektronix unit 3A3) in the storage oscilliscope greatly reduced the level of electrical noise. This was due to the common mode rejection ratio associated with the amplifier. This value reflects the ability of the unit to perform the difference operation. Since the common mode rejection is large (of the order of 100000) common mode signals (i.e. signals common to both leads) such as 60 cycle A.C. noise are sufficiently subtracted away, thereby reducing the distortion.
Traces also revealed that as the capacity of the smaller positive displacement meter was approached, the signal became
increasingly distorted. Mechanical vibrations, caused by rapidly moving positive displacement meter bellows , were thought to cause the phenomena. The use of the large meter for all readings eliminated this problem.
Using these procedures, the distortion of signal frequency and amplitude was reduced. Figures 15 and 16 depict signal forms at 240 and 840 CFH, respectively. As the pictures document, waveform distortion was more prevalent at low flows.
Figure 15: Oscilliscope Trace of Piezo-electric Bimorph Output at a Flow Rate of 240 CFH
(Amp. Setting: 5mV/cm divison, Time Setting: 10ms/cm divison)
Figure 16: Oscilliscope Trace of Piezo-electric Blmorph output at a Flow Rate of 840 CFH
freauency and flow, beginning at a volume flow rate of aproximately 200 CFH. The numerical data may be found in Appendix I. This data is shown in Figures 17 and 18. It may be noted that for the given flow range, the signal amplitude changed
three orders of magnitude, revealing the sensitivity of the niezo-electric bimornh.
The earlier signal distortion was initially attributed to turbulence and boundary layer effects. Efforts to support the sensor out in the free stream, away from wall interference effects were accomplished by using stiffeners on the sides of the bimorph. These supports stiffened the bimorph to a point approximately 3/16 of an inch from the wall. Figures 17 and 18 both reveal similar linear relations for volume flows greater than 200 CFH. It was concluded that the supports had little to no effect on the overall performance.
Other attempts to clarify the signal included reducing the crystal width. This was done ,according to the manufacturer's recommendations, in order to increase sensitivity and eliminate the possibility of combined torsional and bending stresses. Experiments with widths varying from 1/16 to 1/8 of an inch portrayed an ever worsening performance as the flow increased. At approximately 200 CFH, the signal was completely obscured by noise.
A region of constant frequency at low flow rates may be clearly seen in Figure 18. This thirty hertz oscillation persisted even in the absense of flow . The phenomena was
650-600 - 550-500 - 450400 -350 300 - 250-200 150-100 50-I I I I I I I I I I I I I I~ ~ I I I 1 I I I I I I I I I I I I I I I I L i , 50 100 150 200 250 300 350 400 450 500 550 600 650 700 750 800 850 900 950
Volunre Flow Rate (CFI!)
Figure 17: Frequency versus Volume Flow Rate for a Supported Bimorph
0 0 Oscillation Frequency (liz) 0-t
600 -550 -500 450 400 -Oscillation 350 -Frequency (Hz) 300 250 -200 150 -'100 -50 - 0-i 6 * I 00 I I I I I I I I I I I I I I I 1 50 100 150 200 250 300 350 400 450 500 550 600 650 700 750 800 850 900 9,0)
Volume Flow Rate (CFH) Figure 18: Frequency versus Volume Flow Rate for an Unsupported Bimorph
attributed to vibrations within Building 41 of MIT. Such results further emphasized the highly sensitive character of bimorph ceramics.
Chapter 6
Discussion of Results
6.1. General Considerations
The successful linear and repeatible performance of the vortex shedding detection meter was quite noteworthy. The design is very unique when compared to industrial meters. Particular design and operation features are:
1) Small diameter test section (one inch), patterned after a curb valve geometry.
2) Two part construction of the shedder/sensor arrange-ment with an approximate thirty mil space between the two.
3) The use of a cantilevered voltage generating piezo-electric bimorph ceramic as the sensor. This unit had a variable vertical height in order to maximize the voltage output arising from cyclic pressure fluctuations.
4) Use of a gas (i.e. air) as the fluid medium. 5) Operation at low flowrates (50-1000 CFH) and at
Reynolds Numbers generally avoided with indus-trial meters.
6) The stressing of Fluid Mechanical optimization (i.e. blockage ratio and correlation length) as opposed to
complex signal processing.
An anomoly in the experimental findings is the region of constant frequency throughout a range of low volume flowrates. The inability to record a vortex shedding signal at these low rates was conjectured to be the result of the presense of standing vorticies to the rear of the flat plate. For Reynolds Numbers below that of the linear region (i.e. less than 6000), the vortex shedding phenomenon is described by the Regular and
Transition Regimes [381. In these particular flow regimes, the structure of vorticies behind a bluff body radically changes. Although researchers using flat plates have documented the existence of a non-linear shedding region, it does not appear in the graphical results. The resolution of this inconsistency will require further experimental work. Additional experimental studies might also examine the effect of variable shedder/sensor relative position.
6.2. "K" Factor Determination
The performance of the prototype may be evaluated by determining the "K" Factors associated with each of the frequency and volume flow readings found in Appendix I. Using only those "K" Factors corresponding to frequencies greater than 185 Hertz ,
an average Meter Factor may be calculated. In this case: K= 2499.89 Pulses/ft3
and the standard deviation is:
0= 143.76 Pulses/ft 3 Here, 3 is 5.75% of K.
A separate analysis of the prototype meter performance was conducted for both the supported and unsupported bimorph cases. Both varied only 1.5% from the mean "K" Factor cited above. This again reinforces the conclusion that the supports had no effect
on overall meter performance.
Appendix II lists the individual "K" Factors associated with a particular volume flowrate. In addition, the deviation from the mean (in %) as well as the Pipe Reynolds Number are given. Figure 19 depicts the distribution of individual "K" Factors for various flowrates. Figure 20 portrays the % Deviation from K versus Pipe Reynolds Number. Over 85% of the points are within 6% of the mean (i.e. approximately one standard deviation). Although this is not suitable for industrial practices, it is more than sufficient for application as an indicator of gas theft.
6.3. Pressure Drop Analysis
One of the primary requirements of Consolidated Edison was the minimization of the pressure drop across any internal detection
U 0 Ki (x 103cyc/ft3) 2.6 2.5 2.4 2.3 2.2
-o= 5.75% M i= 2499.89 cyc/ftj 1o I I I I I I I I 0 100 200 300 400 00 600 700 800 900Volume Flow PIlte (CFil)
6.0-5.0 4.0- 3.0-Percent Deviation 2.0-from K (K= 2499.89 cyc/ft3) 1.0 1.0 -1.0- -2.0- -1.0--5.0 - -6.0- -7.0-I: Unsupported Bimorph 0: SunporLed Bimorph
Pipe Reynolds Nuamber
(x O1 )
Figure 20: Percent Deviation from the Mean "K" Factor versus Pipe Reynolds Number
device. The use of vortex shedding caused snecial concern because of the presense of the sharp-edged, non-streamlined bluff body. Situated perpendicular to the incident flow, the resulting headloss across this body was potentially problematic.
The prototype design also complicated the pressure loss question. The two twenty-five degree cones were viewed as likely places for significant pressure drop to occur. Although polished smooth in the machining process, the interiors and the connections between the four separate prototype pieces were also considered to be possible sources of flow separation and
resulting headloss.
Theoretical calculations of the pressure drop were completed before experimental tests were begun. This was to give an order of magnitude determination of the prospective pressure loss across the prototype test section. Numerous industrial sources cite the pressure loss across a vortex shedding element with a blockage ratio of 0.27 to be two velocity heads (i.e. equivalent to a $ = 0.7 Orifice Plate [39]). Other references give appropriate headloss coefficients, i.e.:
k= fL/D [40]
(where f is the particular friction factor, L the pipe length, and D the pipe diameter) for the prototype end sections (diffuser and reduction) and the center section. Assuming turbulent flow conditions, the loss equation may be expressed as:
hL E (2.81 x 10⁻⁷ )kT.s. • fZ * Q2 inches of water ... 5 where kT.S. is the sum of individual head loss terms, p the
particular operating fluid density (lbm/ft3), and Q the volume flowrate (CFH).
For the prototype:
k T.S.= 2.345
with the largest loss associated with the bluff body (kB.B.= 2). Air, employed as the experimental flow medium, has a density:
Pf =pair= 0.0763 Ibm/ft
at 70 degrees Fahrenheit. Thus the final theoretical headloss equation becomes:
hL E(1.39 x 10⁻⁶ )Q inches of water ... 6
Figure 21 is a plot of the theoretical and observed pressure loss. The experimental results (see Appendix I) for both the supported and non-supported bimorph parallel each other very closely, further emphasizing the non-distinguishabilty of the
two. Calculations predict a significantly larger pressure drop than was observed for all flowrates. The calculated values, all
below the one inch of water mark, may be thought to represent an upper bound of pressure loss. This is of particular significance when the theoretical headloss coefficient (i.e. kT.S.) is used in conjunction with lower density (i.e. PN.G. 0.0458 bm/ft3 ) natural gas. Figure 22 depicts theoretical pressure drop for both air and natural gas assuming a constant headloss coefficient of k = 2.345. It should be noted that the natural gas curve ,
T.S.
representing an upper limit to the pressure loss, does not exceed 0.7 inches throughout the 50-1000 CFH range of flowrates. The results of the experimental studies using air suggest that the
0.9 0.8 Pressure Drop (in.w.c.) 0.5 0.4 0.3 0.2
0: Theoretical Pressure Drop assuming kT.S.= 2. 3 4 5
U: Pressure Drop for Unsupported Bimorph *: Pressure Drop for Supported Bimorph
me
U 0
el-
1 1 I I I
200 300 400 600 800
Volume Flow R.ate (CFll)
Figure 21: Theoretical and Experimental Pressure Loss Across
the Prototype Test Section (versus flow rate)
900
0.7
0.6--0.9
0.8
0.7
Pressure Drop (in.w.c.)
O: Theoretical Pressure Drop for Air assuming kT.S.= 2.3 45
I: Theoretical Pressure Drop for Natural
Gas assuming kT.S.=2.3 4 5 0.6 0.5 0.4 -0.3 0.2 0.1 -.. Al -Y .-700 900
Volume Flow Rate (CFH)
Figure 22: Theoretical Pressure Loss (using k = 2.345) Across the Test Section for Air and Natural Gas (versus flow rate)
observed pressure drop for natural gas will be even smaller than the calculated values, and thus well within the Consolidated Edison requirements.
6.4. Final Remarks
The performance of the prototype has conformed to all of Consolidated Edison's requirements. Although its accuracy (measured with respest to variation of the about the mean "K" Factor) could be better, it must be stressed that the primary reference meters and the test stand itself were not designed for rigorous calibration analysis. The method of data acquisition and number of experimental trials also must be revised if this type of performance testing is to be undertaken. Only then can the true merits of this vortex meter design be evaluated.
Chapter 7
Conclusions
The experimental program conducted by the author has proved the viability of the curb valve vortex shedding flowmeter for gas theft detection. The linear and repeatible performance of this meter make it ideally suited for application as a theft detection device.
Despite these sucesses, the gas theft detection meter is still in its infancy and requires further practical and theoretical development. Although meeting the commercial guidelines, the prototype is unable to satisfy the 90 CFH resolveability criterion for residential heating cuscomers. This is most likely due to the fact that the one inch test section inner diameter is too large to allow the lower volume flow rates to enter the
linear regime. Tests must be run for a smaller inner diameter prototype to determine if the residential resolveability requirement can be met. Preliminary calculations reveal that both 1/2 and 3/4 inch test section diameters would generate sufficiently large Reynolds Numbers and a pressure drop less than one inch of water . In addition to testing smaller diameter test sections, other plug valve designs, and a functioning plug valve/meter must be tested.
Although further fluid mechanical optimization in terms of the blockage ratio, test section diameter and correlation length is possible, the overriding goal must be the establishment of a detection device suitable for field tests by Consolidated Edison. Phase II research would also concentrate on signal storeage, integration, and retrival. The outstanding performance of the piezo-electric bimorph ceramics should simplify the design of any
REFERENCES
1) Personal Communication between MIT and Con Edison Research Groups, May 29, 1981.
2) Ibid.
3) Marvin Ringler, "Evaluarion of Service Leakage", AGA Distribution Conference, May 9, 1979, p. 1.
4) Personal Communication with Costas Continos, Meter Engineer, October, 1981.
5) M. Ringler, Ibid., p. 1.
6) Personal Communication with C. Continos, October, 1981.
7) Personal Communication between MIT and Con Edison Resarch Groups, May 29, 1981.
8) Ibid.
9) F. J. Oliver, Practical Instrument Transducers (new York: Hayden Book Company, Inc., 1971).
10) G. A. Watson, "The Application of Turbine Meters to Present Day Flow Metering Requirements", Proceedings of the Symposium: "The Application
of Measuring Techniques", April 20-28, 1977, pp. 89-90, 95-97, 106-110, 126-137.
11) "Flow Measurement", Van Nostrand's Scientific Encyclopedia, 5th Edition, 1979, pp. 1068-1073.
12) T. H. Burgess, "Reliable Flow Measurement Using Vortex Principles", Advances in Instrumentation, Vol. 29, Part 2, (Pittsburgh: ISA Publications Department, 1974) pp. 1, 3-4, 7.
13) T. H. Burgess, "Flow Measurement Using Vortex Principles", Proceedings of the Symposium: "The Application of Flow Measuring Techniques", April 26-28, 1977.
14) Schlicting, H. Boundary Lavyer Theory. New York: McGraw-Hill Book Company, Inc., 1960.
15) M. Potter and J. Foss, Fluid Mechanics (New York: John Wiley & Sons, Inc., 1975), pp. 454-457.
16) A. Roshko, "On the Development of Turbulent Wakes from Vortex Streets", NACA Report 1191, (1954) pp. 1-2, 8-11, 16-18.
17) F. H. Abernathy, "Flow Over an Inclined Plate", Journal of Basic Engineering, (September, 1962) p. 386.
18) A. Roshko, Ibid., pp 1-2, 8-11, 16-18.
19) J. Humphrey, "On a Circular Cylinder in a Steady Wind at Transition Reynolds Numbers", Journal of Fluid Mechanics, Vol. 9, (1960),
pp. 603-612.
20) R. T. Keefe, "An Investigation of the Fluctuating Forces Acting on a Stationary Circular Cylinder in a Subsonic Stream and the Associated Sound Field", UTIA Report No. 76, (September, 1961), pp. 2-6, 26-28. 21) J. Humphrey, Ibid., p. 603-612.
22) B. J. Vickery, "Fluctuating Lift and a Drag on a Long Cylinder of Square Cross Section in a Smooth and Turbulent Steam", Journal of Fluid
Mechanics, Vol. 25 (1966) pp. 481-494.
23) T. Cousins, S. Foster, and P. Johnson, "A Linear and Accurate Flowmeter Using Vortex Shedding", Symposium on Power Fluidics for Process
Control, 1973, pp. 45-53.
24) K. J. Zunker and T. Cousins, "The Performance and Design of Vortex Meters", Fluid Flow Measurement in the Mid 1970's (1977) pp. 197-201. 25) T. H. Burgess, "Flow Measurement Using Vortex Principles", Proceedings
of the Symposium" The Application of Flow Measuring Techniques, April 26-28, 1977, pp. 325-327, 335.
26) D. Lomas, "Application Trends with Vortex Flowmeters", South African Mechanical Engineer, Vol. 29, (December, 1979), pp. 437-442.
27) Personal Communication with the Yokogawa Electric Works, September, 1981. 28) Personal Communication with the Fischer and Porter Company, August, 1981. 29) Personal Communication with the Fischer and Porter Company and the
Foxboro Company, Summer, 1981.
30) Personal Communication with the Fischer and Porter Company, August, 1981. 31) Personal Communication with the Foxboro Company, July, 1981.
32) Personal Communication with Phil Scott, Regional Sales Representative of the Foxboro Company, October 14, 1982.
33) Personal Communication with Joe DeCarlo, Technical Leader for Flow Devices, The Foxboro Company, August 31, 1981.
34) Piezo-electric Technology: Data for Designers, Vernition Piezo electric Division, p. 1.
35) F. M. Polk, nedace Matching Circuits for Piezo-electric Transducers, MSEE Thesis, Massachusetts Institute of Technology, September, 1978,
pD. 13-15.
36) Personal Communication with Rockwell International Flow Control Division Spokesmen, January, 1982.
37) Personal Communication with B. J. Rooney of Rockwell International
38) A. Roshko, Ibid., p. 1-2, 8-11, 16-18.
39) Personal Communication with the Foxboro Company, July, 1981.
40) Flow of Fluids ThroughValves, Fittings, and Pipe, Technical Paper No. 410, New York: The Crane Company, 1969, Chapter
APPENDIX I
The following tables give the reduced data of the curb valve based flow meter feasibility experiments. Table I represents the results for a supported
crystal structure, while Table II the results for a similar unsupported crystal unit. Both piezo-electric elements had a moment arm of 3/4 of an inch.
TABLE I: SUPPORTED BIMORPH OSCILLATION Amplitude max min PP PP 36mV 12mV 15mV 50mV 38mV 105mV 200mV 230mV 380mV 500mV 880mV 1400mV 1350mV 205OmV 16mV 7.6mV llmV 48mV 17mV 70mV 85mV 85mV 160mV 220mV 560mV 460mV 800mV 750mV Avg.Time Freq Cycles (Hz) I- I 1* 5 0.76s 3 3.9 23.4 160.3 213.1 -3 .03-10 1 188.7 257.7 0.016s 5 309.9 0.017s 6 352.9 0.019s 8 416.7 0.009s 4 451.1 0.0084 4 476.2 0.0074 4 538.1 0.0088 5 568.2 0.0083 5 604.8 VOLUME FLOW t avg (sec) 72.23 28.37 18.03 11.93 63.1 45.03 39.53 34.47 29.2 26.47 24.83 22.93 21.47 20.4 Vol (ft3) Q (CFH) 49.8 126.9 199.6 301.7 285.1 399.7 455.3 522.2 616.4 680.1 724.8 784.9 838.5 882.4 TRIAL 1) 2) 3) 4) 5) 6) 7) 8) 9) 10) 11) 12) 13) 14) Ap (in. H20) <0 <0 <0 <0 -0 0.05" 0.10" 0.20" 0.30" 0.40" 0.50" 0.60" 0.70" 0.80"