The Development and Implementation of a Production Information
Collection and Reporting System
by Haitao Liu
Bachelor of Engineering in Metal Forming, Northeastern University (1997)
Submitted to the Sloan School of Management and the Department of Electrical Engineering and Computer Science in Partial Fulfillment of the Requirements for the Degrees of
Master of Business Administration and
Master of Science in Electrical Engineering and Computer Science and In Conjunction with the Leaders for Manufacturing Program at the
Massachusetts Institute of Technology June 2004
@2004 Massachusetts Institute of Technology. All rights reserved.
Signature of Author
Sloan School of Management Department of Electrical Engineering and Computer Science May 2004
Certified by
Arnold Barnett, Thesis Advisor George Eastman Professor of Management Science
Certified by
Stephen Graves, Thesis Advisor Abraham J. Siegel Professor of Management Science and Engineering Systems
Accepted by ,elool
Margaret Andrews, Executive Director of Masters Program Sloan School of Management
Accepted
by-Arthur Smith, Chairman, Graduate Committee Department of Electrical Engineering and Computer Science
MASSACHUSETTS INS E.
The Development and Implementation of a Production Information
Collection and Reporting System
By Haitao Liu
Submitted to the Sloan School of Management and the Department of Electrical Engineering and Computer Science on May 18, 2004 in partial fulfillment of the Requirements for the Degrees of Master of Business Administration and Master of
Science in Electrical Engineering and Computer Science
Abstract
Production information, which includes production counts and line downtime information, is of great importance for automobile assembly plants to diagnose equipment problems and improve line utilization. Outdated information systems at many manufacturing plants are not capable of providing accurate production information in a timely manner. This thesis is a thorough account of an internship project conducted at Ford Motor Company's Kentucky Truck Plant (KTP) which turned a spreadsheet-based production information system into a relational database application, called PICRS.
The first part of the thesis introduces the reader to the background of the internship project, focusing on the importance of accurate and timely production information and the inadequacy of the old system. The second part talks about the development of PICRS. Descriptions about system development approach, software and hardware considerations, database design, and interface design revolve around the low cost, usefulness, and ease-of-use of PICRS. The third part of the thesis recounts the implementation process of PICRS and discusses its benefits and impact on KTP's final assembly area. Lessons and observations on leadership, change management, and corporate culture, as mostly obtained in the implementation process, are also discussed in this part of the thesis.
Thesis Advisor: Arnold Barnett
Title: George Eastman Professor of Management Science
Thesis Advisor: Stephen Graves
Acknowledgements
This thesis is a work made possible by a number of organizations and individuals. First, I would like to thank Ford Motor Company Kentucky Truck Plant and MIT Leaders for Manufacturing Program for sponsoring this internship project. In particular, I would like to acknowledge the valuable instructions and help from the following four gentlemen:
My engineering thesis advisor: Arnold Barnett (MIT) My management thesis advisor: Stephen Graves (MIT) My company supervisor: Glenn Whitfield (Ford) My company advisor: Chris Pereira (Ford)
In addition, I would like to specially thank Chris Delaney, a graduate student majoring in Manufacturing Engineering at the University of Kentucky, with whom I developed PICRS system, a major deliverable of the internship project.
I also owe gratitude to the following individuals who have helped to make all this happen:
Donald Rosenfield, Nancy Yang, and Patty Sullivan at MIT;
Mike Parris, Amy Snider, Ronald Parson, and Will Ware at Ford Motor Company. I dedicate this thesis to my dear wife Joan.
Table of Contents
A b stra ct... 3
Table of Contents ... 5
L ist of F ig u re s ... 6
List of Tables... 7
Chapter One: Introduction ... 9
1.1 Industry Background ... 9
1.2 Ford Kentucky Truck Plant and Its Final Assembly Area... 10
1.3 The Importance of Timely and Accurate Downtime Information... 11
1.4 Summary of Project ... 13
Chapter Two: System Development Part I-Development Approach... 15
2.1 User Requirements ... 15
2.2 System Development Approach... 16
2.3 Hardware and Software Considerations... 16
2.3.1 Hardware consideration ... 16
2.3.2 Software Consideration ... 17
Chapter Three: System Development Part II-System Design ... 20
3.1 Database Design ... 20
3.1.1 Entity Relationship Model ... 20
3.1.2 Queries... 22
3.2 User Interface Design ... 24
3.2.1 User Interface Design for Line Supervisors ... 24
3.2.2 User Interface Design for Managers and Engineers ... 29
3.3 Downtime Codes Structure ... 33
3.4 Summary of System ... 36
Chapter Four: System Implementation... 37
4.1 Im plementation Considerations... 37
4.2 The Im plementation Process... 38
4.3 Change Management and Leadership Lessons... 40
4.3.1 The Sloan Leadership Model ... 40
4.3.2 The PICRS Stakeholder Analysis... 42
4.3.3 Notes on Communication... 45
4.3.4 Notes on Corporate Culture... 47
Chapter Five: Benefits and Impact... 49
5.1 The User Feedback... 49
5.2 Impact on the Supervisors ... 51
5.3 Benefits to the Managers and Engineers ... 53
5.4 Long Term Impact ... 54
5.5 Conclusions and Future W ork ... 55
List of Figures
Figure 1: A sketchy map of KTP final assembly area ... 11
Figure 2: PICRS database ER model ... 21
Figure 3: Input form for daily production reports generation ... 23
Figure 4: An example of daily summary report... 24
Figure 5: Spreadsheet for entering downtime information ... 25
Figure 6: Spreadsheet for entering job numbers ... 26
Figure 7: Sample PICRS input screen... 27
Figure 8: The Break Adjust form... 28
Figure 9: Sample user interface for managers ... 29
Figure 10: Calendar to facilitate the date selection ... 30
Figure 11: Sample report for downtime pareto charts... 31
Figure 12: PICRS interface for maintenance engineers ... 32
Figure 13: Partial sample Excel report automatically generated by PICRS ... 33
Figure 14: Timeline of internship project ... 39
Figure 15: The Sloan leadership model... 41
Figure 16: PICRS Stakeholders' Map... 44
Figure 17: The communication model ... 46
List of Tables
Table 1: System Hardware Overview ... 17
Table 2: Software consideration, Buy v.s. Build... 17
Table 3: Software solution options ... 18
Table 4: Pros and cons of two software solutions ... 19
Table 5: Data Table Descriptions ... 22
Table 6: Explanation of the Classification field... 28
Table 7: The descriptions of additional fields in a downtime record... 35
Table 8: Comparison of the downtime description with the old system and that w ith P IC R S ... . . 35
Chapter One: Introduction
1.1 Industry BackgroundTroubled by overcapacity and huge healthcare and pension liabilities, the US Big Three automakers (GM, Ford, and DaimlerChrysler's Chrysler arm) have been losing ground to foreign competitors, especially the Japanese Big Three (Toyota, Honda, and Nissan). For the last seven years, Detroit's share of US car and light truck Market has dropped from 72.5% in 1996 to 63.9% in 2003, while that of the Japanese Big Three has risen from 17.9% to 22.6%', and the trend is still favoring the Japanese automakers.
America's auto industry has one-fifth more capacity than it needs2. However, its
ability to downsize is restricted by its labor contracts with the unions. Moreover, retirement now brings its own peril of growing pension burden. Add the healthcare liabilities, and US auto industry is at huge competitive disadvantage to its Japanese competitors.
Import tariff could be a protection to US auto industry if the foreign vehicles were made outside of US. But now the foreign automakers have built and are building more plants in the southern states of America. With waning protection from tariffs, and growing burden in pensions and healthcare liabilities, US automakers have to seek ways to survive the fierce competition from foreign competitors.
America's growing appetite for sport utility vehicles (SUVs), minivans, and pickup trucks seems to be a savior. Now about every other passenger vehicle sold in the US is of one of the three categories. On average, SUVs and trucks are in stronger demand in terms of manufacturing capacity and bring higher margins. In recent years, those two types of vehicles have accounted for most of the Detroit Big Three's profits. Therefore, plants that produce SUVs and light trucks are now of elevated importance to US automakers. Many truck plants are producing to capacity to cater to the market. In this light, productivity is of greater importance in those SUV and truck plants than in other Big Three automobile assembly plants.
The competition from Japanese automakers has also urged the US automakers to modernize their plants and imitate the improvement-driven Japanese manufacturing techniques. Specifically, US car makers are becoming more cost-cautious, more meticulous on quality, and more aggressive on product development. Process improvement is a major means to realize better quality and lower cost. Lean manufacturing and continuous improvement concepts and tools have been widely applied in almost all facets of manufacturing in the US automotive industry. Buzz words such as
Lean Manufacturing, and Six Sigma have become common place in most of the
manufacturing plants. In continuous-flow assembly plants, Theory of Constraints are eagerly explored, and at some places, well practiced to identify and manage bottlenecks. Now, every automaker claims to have its own version of the famous Toyota Production
quality, and low cost. However, the results of US automakers imitating Japanese techniques have not been uniform. They vary from one maker to another maker and from one plant to another.
This thesis project was done in a major pickup truck assembly plant of Ford Motor Company in such an industry background. The above information can help the readers to understand the bigger macroeconomic background behind the importance of improving productivity at this particular plant.
1.2 Ford Kentucky Truck Plant and Its Final Assembly Area
Ford Motor Company (Ford) is the second largest automaker in the world with 2002 revenue of a little short of $163 billion, and US passenger vehicles market share of roughly 20%. Ford owns eight brands which include three domestic brands: Ford, Mercury, and Lincoln, and five acquired foreign brands: Jaguar, Land Rover, Aston Martin, Volvo, and Mazda. Ford has been experiencing difficulties for the last few years because of the fierce competitions mentioned earlier and a failed strategy by the previous CEO, Jacques Nasser, to transform the company into a global consumer-services company. In 2001, Ford had a net loss of $5.45 billion. The loss dropped to $980 million for year 2002. For the first three quarters of 2003, Ford has gained a net profit of about $1.3 billion. Current CEO Bill Ford's campaign of "Back-to-basics" seems to be working. In 2002, the North America capacity utilization was increased by 10%, while non-product cost was cut by $2 billion. Also in 2002, Ford was up 12% in J.D. Power and Associates initial quality study. All these numbers reflect the company's efforts to cut cost and improve quality, and, as Bill Ford put it, "Focus on the fundamentals" (Ford's strategy to cut off non-core businesses and focus on vehicle making).3
Ford F-series trucks have been the best selling vehicles in the US for the past two decades. Since their debut in 1948, Ford has sold 27.5 million F-series trucks. These trucks are the major contributor to Ford's profit for years. Even in the recent years of difficulty, the sales of F-series trucks remains strong and have become more important in company profit contribution. Ford F-series trucks for North America market are built in several locations, including Kansas City Assembly, Norfolk (Virginia) Assembly, Ontario Truck, and Kentucky Truck. Norfolk and Kansas City plants are now building the redesigned F-150 on their revamped flexible lines. In addition, a newly-built plant in Ford's heritage Rouge Complex will start assembling the all-new F-150 trucks in mid-2004. Ford Kentucky Truck Plant (KTP), located in Louisville, Kentucky, is the only plant building super-duty F-series trucks for North American market.
KTP is a 4.6 million square-foot facility, which employs roughly 6000 salaried and hourly workers and produced 378,303 vehicles in the year of 2002. The models currently built at KTP include Ford Excursion SUV and Super Duty F-Series trucks (F-250, F-350, F-450, and F-550). Currently, KTP is operating on three shifts. The whole plant is in full production about 20 hours a day, except for a 24-hour shutdown starting at Saturday night for maintenance purposes.
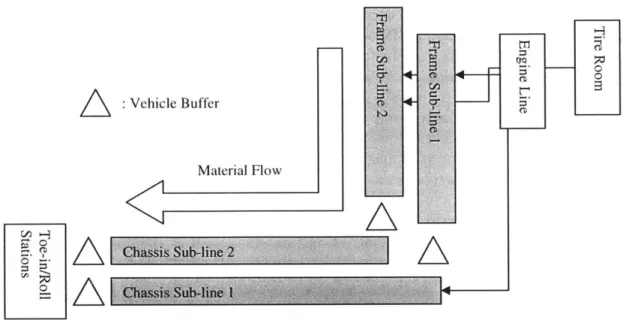
KTP is made up of five main production areas, which are, in the order of material flow, Stamping Area, Body Shop, Paint Shop, Trim Area, and the Final Assembly Area. The Final Assembly Area consists of two parallel assemblies. Each assembly is further divided into two lines. The first line is called frame line, which starts with a bare truck frame and ends with engine, transmission, tires, and other accessories on it. The second line is called chassis line, where cabs and boxes are decked onto the frames and all the other finishing jobs, such as steering wheel install and fuel fill, are done. Each line is moved by a single master conveyor. There is a decoupling buffer between each frame line and its successive chassis line. There is no crossover between the two frame-chassis lines. Besides the four main assembly lines, there are engine line and tire room which feed into the frame and chassis lines. Immediately after the chassis lines, there are five toe-in and seven rolls testing stations, which are, in the strict sense, the very final stage of truck production at KTP. Currently, the final assembly area is the bottleneck of the whole plant. In the final area, the chassis lines are having more downtimes than frame lines. Downtime data indicates that the balancing between frame and chassis is also a very important issue.
: Vehicle Buffer
Material Flow
AkA
CD _ -line___ __ __ ___2
Figure 1: A sketchy map of KTP final assembly area
1.3 The Importance of Timely and Accurate Downtime Information
Currently, the demand for F-Series Super Duty trucks exceeds the capacity of KTP. In this light, increasing throughput is understandably the most pressing issue at KTP. To improve the throughput of a continuous process, one must know where the bottleneck is, and come up with feasible ideas to increase the capacity of the bottleneck. However, in a dynamic manufacturing environment, such as an automobile assembly, the location of
bottleneck can change over time. Even at the same time, there might exist multiple bottlenecks due to the decoupling points.
Actions taken to smooth production and increase capacity have to be data-driven. As the assembly line speed grows increasingly fast, the requirement on the timeliness of the process data is becoming increasingly high.
Downtime information is a very important kind of production information. It is useful in the following ways:
. It is necessary in identifying constraints;
. It provides information to differentiate special causes from common causes of problems;
. It provides information on the conditions of equipment.
Since downtime data is so important, all manufacturing organizations want to collect and use it in some way. However, the collection and analysis of the downtime data is not always an easy job. In the KTP final area, the supervisor of each shift was required by the area managers to jot down the production number and downtime information of his or her line each hour of production. At the end of the shift the supervisor needed to come up with a consolidated report to the area managers based on the downtime information he or she jotted down during the day. Periodically (every week and month), certain engineers needed to create a report on Overall Equipment Effectiveness (OEE) based on the downtime data for that period.
To make all this possible, some engineers, years ago, devised a set of spreadsheets for the supervisors to put in the downtime and production count information and generate the reports. What the supervisors needed to do was to fill out one separate Excel file for every shift. All lines in the final area share the same files through a shared drive.
It might be surprising to know that, in an advanced manufacturing facility such as KTP's final assembly area, important production data, such as that on downtime, had been manually input to simple spreadsheets until this August, when the new database system was implemented. By talking to people at various organizations, the author has learned that Excel Spreadsheet is indeed a very common means of storing important process data even in large organizations with strong IT capabilities.
Spreadsheets can meet the basic requirement of storing data, but there are a number of serious disadvantages associated with it. The following are the disadvantages of using spreadsheet to manage data at KTP's final area.
. A spreadsheet can be a repository of data, but can hardly be a database in a strict sense, because there is no easy way to input, retrieve, and query large amount of data to and from a spreadsheet.
. It was time consuming to input data into the spreadsheets. It was even more so to consolidate the data to generate a regular report on line downtimes. Ad hoc reports on line downtimes were out of the question, because almost nobody in a
busy production environment wanted to spend the time to go through the spreadsheets to come up with some information even though it might be useful. . Manual input was an error-prone process. There was no mechanism to prevent or
reduce the accidental input mistake. The descriptive short sentences about downtime reasons written by line supervisors were of no fixed format, which made it impossible to do any automatic sorting and compiling of the data.
. It was hard to organize and make use of the large amount of Excel files in existence. And the number of files was still growing everyday. So, most of the time those "data" files just sat there untouched by anybody.
1.4 Summary of Project
The thesis project originated with KTP's need to keep track of the large amount of useful downtime information in the final assembly area in order to improve KTP's overall throughput measured by average job per hour (JPH). The initial hope was to obtain the information by implementing a piece of commercial-off-the-shelf software named VisualPlant. Unfortunately, some unsolvable financial issues caused the abortion of the purchase of the software. However, the aborted attempt to use this commercial software only served to create an opportunity for the author of this thesis to build a system that could perform some of the needed functions of VisualPlant, and even can overcome some of its limitations. The in-house built system turned out to be a success, and the descriptions of its development, implementation, and benefits are the centerpiece of this thesis.
The author spent his first month of the internship getting familiar with KTP's manufacturing processes, organization structure, and informal networks. During that month, the author also investigated alternative potential solutions to the problem, and gradually defined the goal, scope, and approach of the project. The second month of the internship saw an intense period of requirements definition, and system design and development. In this month, the author spent the bulk of the time interviewing future users about the requirements, and mapping all the major equipment on the chassis lines in order to compile a comprehensive downtime reason list. The rest of the time was devoted to the design and development of the system, much time being consumed by programming and debugging.
The system was implemented onto the chassis lines and test run by A crew only on August 11 , 2003. After the successful implementation of the system on the chassis lines, the system was further rolled out onto frame lines on September 2" , and engine lines on September 301h. During the implementation processes, the system itself was also constantly being debugged, and improved. Besides the five production lines, maintenance personnel, industrial engineers, and production managers also got involved in the system development process. Some functions were specially designed for these three groups of user to interact with the system.
In the last two month of the internship, the author spent most of the time analyzing the data collected by the system, and assessing the impact of the new system, while still
improving the system based on user feedback. Some efforts were devoted to the improvement of a simulation model on Frame 2- Chassis 2 buffer. Some insights were gained as to how the characterization of the data would affect the accuracy of the model, but due to the limitation of the data, the simulation model remained largely the same.
Toward the end of the internship project, a survey was handed out to all the users of the downtime collection and reporting system. The user feedbacks were compiled and are discussed in Chapter 5 of this paper.
Chapter Two: System Development Part I-Development Approach
The stringent financial situation of Ford Motor Company and the experimental nature of the project determine the principal guideline of system development, which is to achieve maximum effectiveness with minimum cost. Effectiveness can be measured by saved time, improved productivity and quality. Cost includes labor and expenses. The system development was conducted under this guideline, and the following sections describe several major issues in the system development process.
2.1 User Requirements
The first task in developing an information system is to gather user requirements. For this project of developing the Production Information Collection and Reporting System (referred to as PICRS hereafter), we have two avenues to collect the user requirements. Firstly, we can examine the old Excel-based system to find what functions the old system can provide. We deem these functions as the baseline requirements for the new system. Secondly, we can interview the users to find the additional functions that they desire. The users include line supervisors, area managers, industrial engineers, maintenance engineers, and material handling personnel.
A study of the old Excel-based system provides the first list of system requirements. These requirements encompass all the functions that the old system can provide. These requirements, summarized as follows, are deemed as baseline functions of the new system:
" PICRS should provide an easy-to-use means for the supervisors to enter production counts and downtime information.
" PICRS should be able to generate daily summary downtime report, daily detailed report, and the job number report.
. There should be a convenient way for supervisors to send hourly downtime information to managers through electronic pages.
* Managers should have access to PICRS reports from their personal computers. We then interviewed users to gather additional requirements, which they would like to have but the old system could not provide. These additional requirements can be summarized into the following list:
" All the users should have their own customized user interface, and should be able to interact with the system easily.
" Reports about downtime information of any time range should be easily generated.
* Reports about the history of specific downtime reason should be easily available. " The system should be able to communicate with some existing Excel templates
for the purpose of reporting and data analyzing.
* Maintenance personnel should have their own input form for "maintenance actions" and should be able to view the reports with maintenance comments.
. This new system should cover an additional production the engine line-which the old system did not cover.
2.2 System Development Approach
For any information system development project, only systematic approaches can possibly avoid delay and deliver required functions. There are hundreds of information systems development methodologies (ISDM) in existence. hivari et a14 summarizes IS development approaches into five major groups, which include, among others, structured approaches, and information modeling. Among structured approaches, the waterfall model, rapid application development (RAD), the spiral model, and rapid prototyping are the most popular.
We adopt the evolutionary prototyping approach, one of the prototyping techniques, to develop the system. Yao-Chin Huang, in his paper "Prototyping: Throwaway or Evolution"5 enumerates the advantages of evolutionary prototyping as: the improvement of user communication, the reduction of the cost, the decrement of the system development cycle, the increment of the final system's quality, the completion of the prototype being that of the system, and the prototype being used as a training facility.
We built a prototype system in about two weeks, and then implemented the prototype in two of the five lines in KTP's final area. We then upgraded the prototype by adding more functions without changing the basic structure, and expanded the implementation of the system into the rest of the area. Our observations agree with Huang's assertions. In particular, the prototyping approach, by allowing users to interact with the system early on, greatly helped us to acquire further user input two weeks into the development stage. The first prototype was also critical to earn the buy-in from the users at a rather early stage.
2.3 Hardware and Software Considerations 2.3.1 Hardware consideration
It takes both hardware and software to build an information system. The development of PICRS is no exception to this rule. However in this specific case, there was relatively little concern about hardware selection for two reasons. First, purchase of expensive hardware is out of the question because of the very limited budget of the project. Second, the existing hardware has already met the basic requirements of a small-scale, manual system. Bearing these in mind, we built a system using only hardware that was already available at KTP.
The hardware structure is a very simple one. It currently consists of 27 workstations and personal computers (the number of users has been increasing, and each user adds one workstation or PC to the system). all of which have access to a shared drive through
TCP/IP protocol. The users write to and fetch information from the shared drive. The details of the network can be summarized in Table 1.
Location # of PC or Work Station Function
Toe-in and Roll Stations 2 Work Stations Toe-in & Rolls Data Input Chassis Line 1 2 Work Stations Chassis 1 Data Input Chassis Line 2 2 Work Stations Chassis 2 Data Input
Chassis Area Offices 3 PCs Report Generation and Review Frame Line 1 1 Work Station Frame I Data Input
Frame Line 2 1 Work Station Frame 2 Data Input
Engine Line 1 Work Station Engine Data Input
Frame Area Offices 2 PCs Report Generation and Review
Maintenance Offices 2 PCs 1) Maintenance Data Input
2) Report Generation and Review
Plant Manager Office 1 PC Report Generation and Review
Engineer Cubicles 5 PCs 1) Report Generation and Review 2) Data Analysis
Developer Cubicles 2 PCs System development
Table 1: System Hardware Overview
Each PC or work station of the network is equipped with an Intel Pentium 3 or 4 CPU, at least 128 MB RAM, and has a local hard disk of at least 20 GB capacity. The shared drive has the size of 200 GB, and is accessible to each computer in the network with each user's account through Microsoft Windows network. Each computer uses either Windows 2000 or Windows XP operating system and has the full suite of either MS Office 2000 or MS Office XP.
2.3.2 Software Consideration
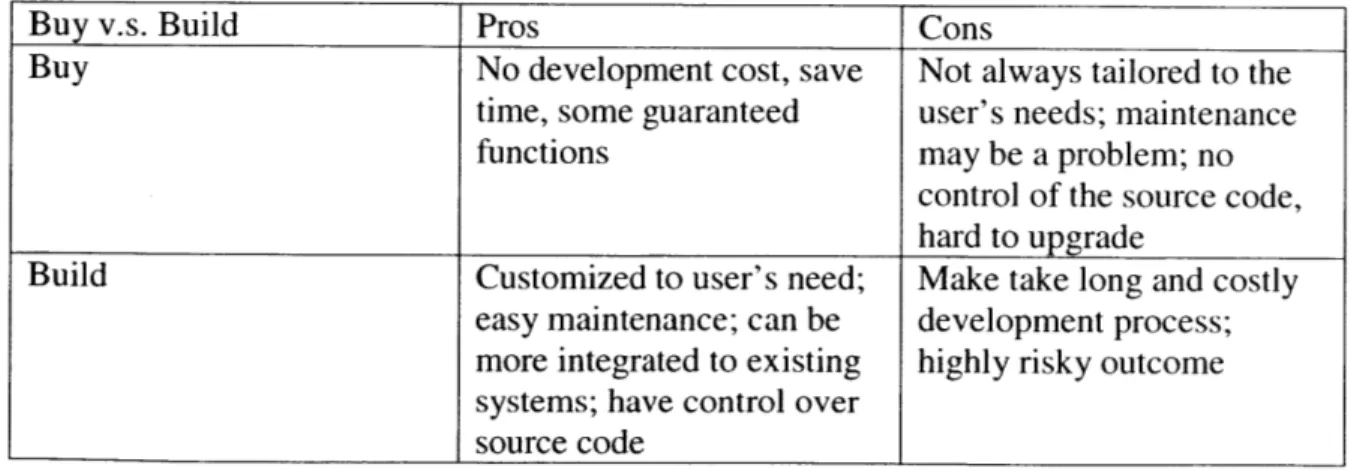
The first question to ask in software consideration is whether to purchase the software off the shelf or to
off-the-shelf (COTS) and table.
build it in house. Normally, the built-in-house software can be
pros and cons of commercial-summarized in the following
Buy v.s. Build Pros Cons
Buy No development cost, save Not always tailored to the time, some guaranteed user's needs; maintenance
functions may be a problem; no
control of the source code, hard to upgrade
Build Customized to user's need; Make take long and costly easy maintenance; can be development process; more integrated to existing highly risky outcome systems; have control over
source code
In this specific case, things are a little different. COTS production software, such as VisualPlant is expensive and takes longer time and more effort to implement, whereas an in-house built application incurs almost no cost and takes much shorter time to develop and implement. A clear advantage of VisualPlant is its powerful functionalities. However, at the same time, there are some functions, such as manual input of specific downtime reasons, that VisualPlant can not do while an in-house built application is easy to accomplish. Ford KTP actually attempted to purchase and implement VisualPlant. The plan eventually collapsed due to financial reasons. Thus, to build in house was actually the only choice.
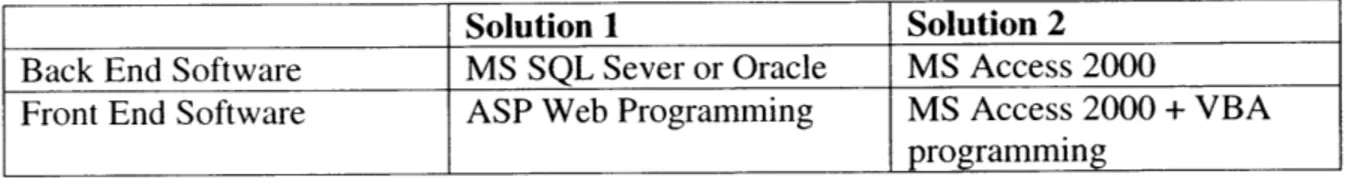
There were two sets of software solutions in consideration at the start of the project. The specifics of both solutions are summarized in table 2.
Solution 1 Solution 2
Back End Software MS SQL Sever or Oracle MS Access 2000
Front End Software ASP Web Programming MS Access 2000 + VBA programming
Table 3: Software solution options
The initial software consideration was affected by our experience with a failed web-based application attempting to achieve similar functions as PICRS provides. The application, named Plant Floor Metrics Reporting system (PFMR), was developed at Ford's headquarter at Dearborn Michigan. Implementation of PFMR was tried at KTP final assembly area but failed due to several serious limitations and flaws.
. The application was not tailored to the needs of KTP final assembly area. Several much needed functions were not provided by PFMR.
. PFMR was cumbersome and time-consuming to use.
. Several limitations, such as the inability to take a fraction of unit loss, hindered the system's capability to provide accurate information.
. The users had no right to modify or improve the system.
We obtained accounts with PFMR and played with it on our PCs for about a week, and found that the limitations were indeed too huge to circumvent. The application's user unfriendliness was especially notable. At the start of each session, the user needs to take about 20 seconds to log into the system. Since it is web-based, each data entry takes a couple of seconds for the packets to be sent to the server. Moreover, after a certain time of idleness, the user will be automatically logged out; and to resume use of the application, the user has to take time to re-login. All these "features" make the system cumbersome to use. We nevertheless recognized that all the limitations are surmountable, except the slow data entry. The time-consuming data input is inherent with the web-based structure. Whereas data transmission speed is a critical concern in a manufacturing environment, data communication means provided by web browsers limit the data transmission speed. The line supervisors just can not afford to wait a couple of seconds after each mouse click. Our experience with the cumbersomeness of the web-based PFMR promoted our doubt about the feasibility of a web-based structure for PICRS.
Moreover, the MS SQL Sever + ASP solution would incur considerable cost in software purchase, while the software required by MS Access + VBA solution is already available on every workstation and PC.
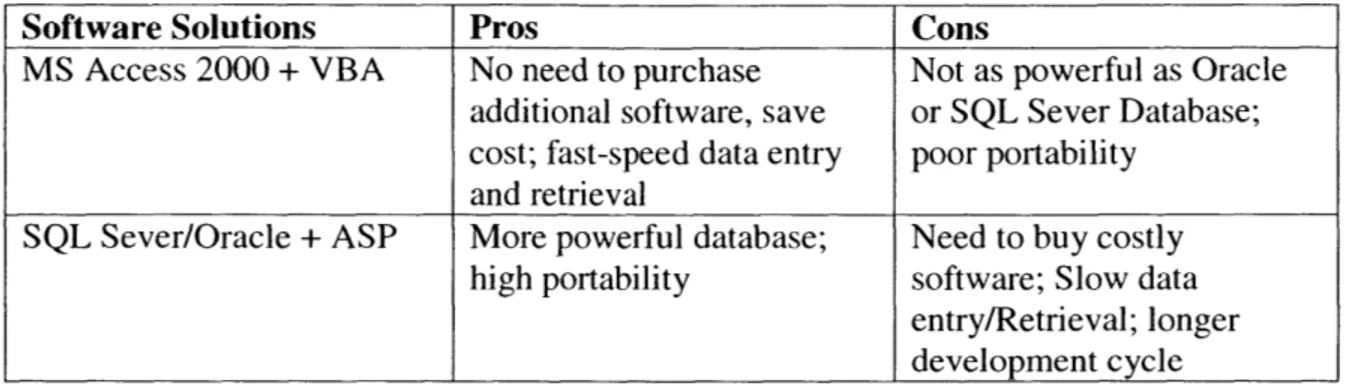
The pros and cons of the two software solutions are summarized in table 4. We chose the MS Access + VBA solution for its cost-saving, speed, and simplicity.
Software Solutions Pros Cons
MS Access 2000 + VBA No need to purchase Not as powerful as Oracle additional software, save or SQL Sever Database; cost; fast-speed data entry poor portability
and retrieval
SQL Sever/Oracle + ASP More powerful database; Need to buy costly high portability software; Slow data
entry/Retrieval; longer development cycle Table 4: Pros and cons of two software solutions
Chapter Three: System Development Part II-System Design
3.1 Database Design
A database is a collection of information that is organized so that it can easily be accessed managed, and updated. Among the various organizational approaches to databases, the relational structure is the most prevalent one. A relational database is a collection of data items organized as a set of formally-described tables from which data can be accessed or reassembled in many different ways without having to reorganize the database tables7.
A relational database, compared to databases using other organizational approaches, such as distributed databases and object-oriented databases, is relatively easy to create, access, and extend. A relational database is often represented as a set of tables containing data of predefined categories. Each column of the table represents a certain category of data, for example, the telephone numbers of all employees of a company; and each row is a unique incidence of the data for the categories defined by the columns. The categories are also calledfields, and a row equals a record.
Data tables in a relational database are related to each other by primary and foreign
Keys. A primary key is a column or columns in a table whose values uniquely identify
each row in a table. A foreign key is a column or columns whose values are the same as the primary key of another table. The relationship is made between two relational tables by matching the values of the foreign key in one table with the values of the primary key in another.8
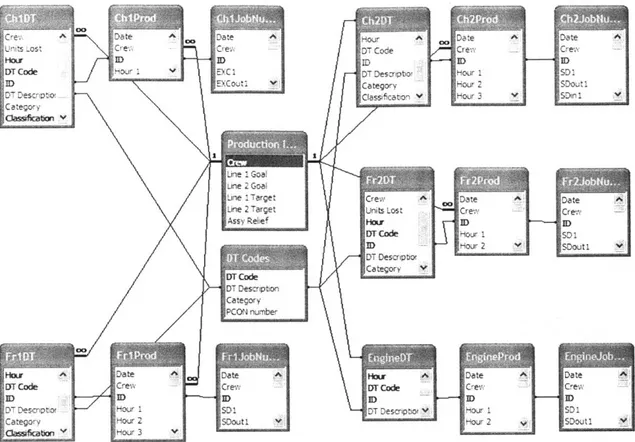
3.1.1 Entity Relationship Model
Data modeling is one of the most critical development processes in database design. Data model is the conceptual representation of the data structures that are required by a database. For relational databases, entity relationship (ER) model is the widely used way to unify the network and relational database views.
The ER model was originally proposed by Chen in 19769. To simply put, ER model is a conceptual model that represents the real world as entities and relationships. The entity relationship diagram is a basic tool to visually depict the data objects and their relationships.
Date A Date Hour A Date Date A
UnitsLos Cre DT Code Crew - Crew
H"u ID ID ED1D)
DT Code Hour I EXC 1 DT Descripbo Hour 1 SD1
D EXCou Category Hour 2 SDoutl
D7 Descripto lassif5catn Hour 3 ' SDotl1
CategOr y
Line 1 Goal Line 2 Goal
Line 1Target Crew Date Date
Line 2 Target Unit Lost Crewv Crel.A
Assy Reiief Haw I
DT Code Hour SD F rHour 2 CaDout 1 DT Descnipbti Categor y DT Descnpt on Category PCON number
Hour Date Date Hour Date Date
DT Code Crew Cre,,,. DT Code Crew1. Crew
DT Descnptof Hour i SDI DT Descripbol Hour I SDI
Category Hour 2SDouti 1H-our 7 V SDout'
ClassifcationHour 3
--Figure 2: MIRS database ER model
From the ER which names and
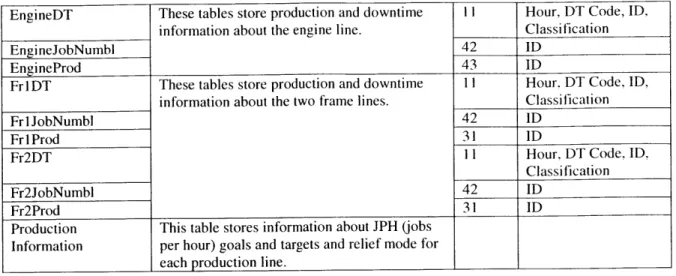
model, we can see that the database consists of seventeen data tables, contents are summarized in the following table.
Table Name Table Content Description # of Primary Key(s) Fields
ChIDT This table contains information about every 11 Hour, DT Code, ID,
downtime occurred on Chassis I line, including Classification
fields such as Hour and Downtime Code.
Chl JobNumbl This table contains information about job 81 ID
numbers for both Super-duty trucks and Excursions for Chassis I line. One record is for one shift, which comprises of 12 hours.
Ch I Prod This table contains information about chassis 1 31 ID
production targets and counts. Each record corresponds to one shift in production.
Ch2DT These tables have the same structures as the 1 Hour, DT Code, ID,
previous three tables, the difference being that Classification
Ch2JobNumbl these tables contain information for Chassis 2 42 ID
Ch2Prod line, and may have different number of fields 31 ID
because of the different types of vehicles it
produce.
DT Codes This table contains all the downtime codes, 4 DT Code
their descriptions, related teams, and the PCON number where applicable.
EngineDT These tables store production and downtime 1I Hour, DT Code, ID,
information about the engine line. Classification
EngineJobNumbl 42 ID
EngineProd 43 ID
FrlDT These tables store production and downtime II Hour, DT Code, ID,
information about the two frame lines. Classification
Fri JobNumbl 42 ID
FrIProd 31 ID
Fr2DT 1 1 Hour, DT Code, ID,
Classification
Fr2JobNumbl 42 ID
Fr2Prod 31 ID
Production This table stores information about JPH (jobs
Information per hour) goals and targets and relief mode for
each production line.
Table 5: Data Table Descriptions
The seventeen tables can be divided into two groups. The first group includes two
tables-DT Codes, and Production Information. These are the tables that store
information such as downtime codes and descriptions, and jobs-per-hour targets. This information is very important to any production line and normally does not change. The second group consists of all the rest of tables. These tables store production and downtime information that grows as production carries on. Records in these tables use data fetched from DT Codes, and Production Information tables.
There are two reasons why different production lines have different set of tables to store production data: 1) this arrangement makes the database structure simpler, more elegant, and easier to understand without incurring too much structural redundancy; 2) some differences between the lines (e.g., line I makes both Excursion and Super Duties, while line two only makes Super Duties) make the integration of the tables troublesome. Therefore, although the principle of least redundancy may suggest using fewer tables, we found the above structure to be optimal under this particular situation.
3.1.2 Queries
The advantages of a database over a spreadsheet data reservoir are not only the more efficient means of inputting and storing data, but also the convenient ways of retrieving data and turning data into useful information. The latter tasks are achieved by well-designed queries on top of a sound database structure.
There are 36 static queries written in the database, and a dozen of dynamic queries embedded in the Visual Basic scripts. Those queries accomplish tasks as simple as "finding the corresponding possible downtimes given a team number", and as complex as "generating a Pareto report on selected number of downtimes for a given line, shift, classification, and time range combination".
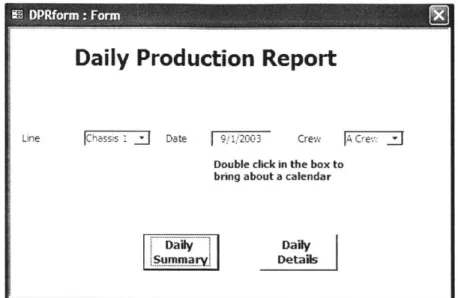
The following example illustrates the design of a typical query and its output. This dynamic query takes user inputs (obtained through an input form as shown in figure 3)-namely line, date, and crew-and generates a daily production report.
Daily Production Report
Line ]Chassqs i _ Date /20 Cre£ JA Cre _:
Double click in the box to bring about a calendar
7~1
DailySUMMaryi Details
Figure 3: Input form for daily production reports generation
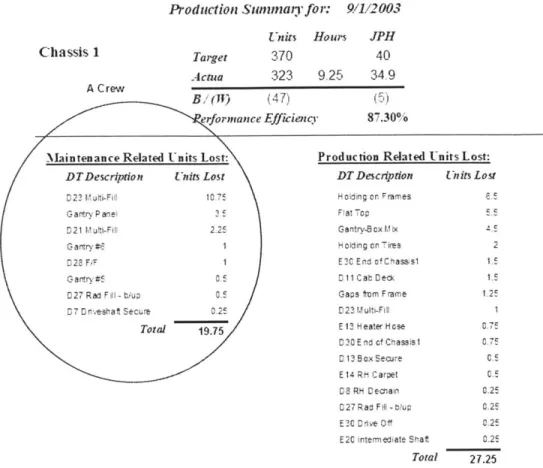
The daily summary for the maintenance related downtimes is generated using the following query.
SELECT date, crew, [dt description], SUM([units lost]) AS lost FROM " &
dailyDetailDT & " WHERE classification = 'equipment' GROUP BY date, crew,[dt description] ORDER BY sum([units lost]) DESC
In this query, dailyDetailDT is a string variable, which is passed a value of the correct table name when the report is opened. Furthermore, upon the opening of the report, certain VB codes will dictate that the query is restricted to the records that are pertinent to the particular line, date, and crew combination inputted through the forms depicted by figure 3.
The result of the query is the circled part of the report shown in figure 4. This typical process of producing an informative and easy-to-read report involves the design of SQL query frame, the programming of VB codes that pass dynamic values to the query input, the design and programming of the data input form, and the design of the report layout.
Production Sunmar for: 9/1/2003 Target Actua A Crew B fr) erform~ance
Maintenance Related Units Lost:
DT Descriplion Units Lost
D22 MultiRF-i 10.75
G antryPeane c e .5
0 21 h uh-kFil' 2.2E G anrtry #*E1
C 2 8 Fi F
0 21 R ad F ill- b'u , G.E
D7 DnveshaftSecure 0. 2 E Total 19.75 Units Hours JPH 370 40 323 9.25 47 Efficimno 34 9 8 730%
Production Related Units Lost: DT Descniption tnits Losr
H c ding on F rames 8.5 Fat Top 5.5 Gantry-B ox Mix E H oding on Tires 2 E 30 End of Chasssl 1.5 D 11 C ab D eok 1.5 Gaps mm Frame 1.25 023 Mutt-Fifl 1
E13 Heater H ose 075
C 30 E nd of Chassis1 0.75
0 13 Box Secure C.E
E 14 RH Carpet 0.5
C8 RH Dechain 0.25
027 Rad Fill -tlup 0.25
E0 Drive Off 0.25
E2C intermediate Shaf 0.25
Total 27.25
Figure 4: An example of daily summary report (numbers in this figure are fictitious for confidentiality reasons)
3.2 User Interface Design
PICRS users can be divided into three groups. The first group consists of all the final area line supervisors who use the application every hour and input all the production related data. The second group of users are the managers who use the application only to view the reports. The third group are the engineers who use the application to view reports as well as analyzing data which may require the interaction of this application with other applications such as Microsoft Excel. This said, the user interface design should serve all of the three groups of users.
3.2.1 User Interface Design for Line Supervisors
The design for the interface for line supervisors is the most demanding for two reasons. First, the line supervisors interact with the application in the most hectic working environment, and thus have very limited time to spare for using the system. Second, the line supervisors are the least computer-literate among the three groups. Moreover, since the line supervisors need to input the data every hour while managers and engineers use
the system much less frequently, a crash of the system on a supervisor's workstation would have far more negative impacts than if it happened on a manager or engineer's PC. Based on the above reasons, the main considerations for designing interfaces for line supervisors are ease of use and reliability. A description of the thoughts behind designing one of the interfaces for supervisors makes the explanation of these principles more clear.
9D Eie Edt Ye- nse t -mat Ios pate Lodow Help
B C 5 T ET
Irctivsso I~sdb~rr Awif
L967 MMMve _ _ IM5 DA.OTME r - X GSH DES'CRPTION ~ I ,aw,
o 6:00 -7:00 7 23 30 10 8 d1l exc. Hung on crossover,2 unit gap 17.6
1 d11 gantry blup,.5 d15 b/f,.5 d7 isolator,.5 d2 repair..5 eol no
2 7:00 -8:00 9 28 37 3 start 5.3
3 8:00 -9:00 10 28 38 I 2 .5 eol no start..5 e16 rad...5 d28 tif ot,.5 d1l gantry blup 3.5
4 9:00 -10:00 3 19 22 I 0 met production goal 0.0
5 10:00 -11:00 12 26 38 1 2 .5 frame flip..5 d25 sir..5 d8 unchain,.25 eol push,.25 d17 old 3.5
s 11:00 -12:00 9 27 36 1 4 3 unit gap..75 frame flip (vin stamp)..25 e2 repair 7.1
7 12:00-1:00 5 4 19 3 3 unit gap 5.3
a 1:00-2:00 7 28 35 5 5 unit gap 8.8
a 200 -3:00 5 17 22 0 met production goal 0.0
1 unit gap.1 d1l gantry fault..5 d22p repair,.5 e5 gun down..5 d19 a 3:00.4:00 9 27 36 4 r/b..5 d25 st mx. 7.1
s 4:00 -5:0 5 17 18 0 met production goal 0.0
t2 5:00 .6:00 0 0 _ _ _ _ _ ____ _ _ _ 0.0 2 3 4 15 16 17 he 19 120 TOTAL I 81 254 331 L PN: 36.8 OEE: 66.87 1 LINE TIME: 10.01 BREAK Imin 60 P.1EETING S Imini 0 33.0
Figure 5: Spreadsheet for entering downtime information (numbers in this figure are fictitious for
confidentiality reasons)
SHIFT 58.2
DATE: 060403 A f
51 e Edt _ev nse-t Format Thols Data yAntdow Hetp - X
A B C D E F G H I J K L M N
CHASSIS LINE #1 PRODUCTION
H O U R EXCURSION
JOB PRODUCTIO CUM CUT LCUT 1JUMEFR, p PER HOUR PRODUCED- ZS-
-2 3 4 L6 7 8 '9 10 11 12 14 15 16 17 18 20 21 22 24 25 Date 6/4/2003 SUPER DUTY
JOB PRODUCTIO CUM CUT CUT TOTAL
1iUl & N PERHOUR PRODUCE Q-J . . OD
40 70 107 145 167 205 241 260 295 317 353 375 23 23 28 28 19 26 27 14 28 17 27 17 51 79 98 124 151 165 193 210 237 254 ~rnzzt 30 67 105 127 120 220 2Z5 3-13-1335
Use ACTUAL Super Duty Chassis Numbers 0001-1999
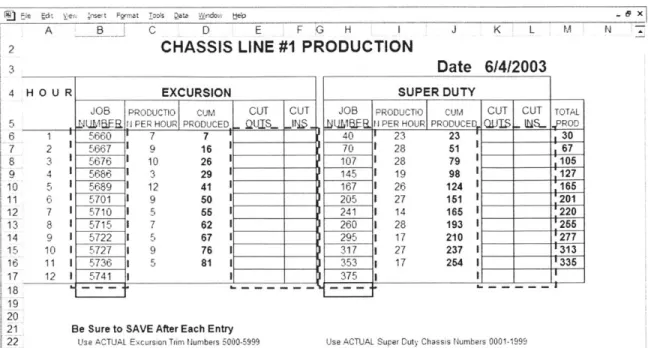
Figure 6: Spreadsheet for entering job numbers (numbers in this figure are fictitious for confidentiality reasons)
Figures 5 and 6 are screenshots for sample spreadsheets used for production data input before the PICRS was implemented. The areas encircled in the dashed blocks are the cells that require input from the line supervisors. The encircled area in figure 5 records downtime information including units lost, and downtime description. The encircled areas in figure 6 record job numbers and cut-in/cut-out units (additions to or removals from the original production plan). Formulas are written in certain cells of the spreadsheet template to calculate each hour's production counts for both super-duty trucks and Excursion SUVs produced. Aside from the inconvenience that one separate Excel file has to be created for each day-shift combination, there are several problems with using the above spreadsheet to input production information:
. There is no mechanism to caution against, or prevent input errors. . The downtime descriptions are time-consuming to enter. As a result, the
supervisors sometimes "simplify" this step by entering very short descriptions or even skipping recording certain downtimes.
. The descriptions of the same downtime vary by each supervisor. This makes it hard to consolidate all the information afterwards.
16 26 29 41 50 55 62 67 76 81 1 2 3 4 5 6 7 8 9 10 11 12 5660 5667 5676 5686 5689 5701 5710 5715 5722 5727 5736 5741 9 10 3 12 9 5 7 5 9 5
Be Sure to SAVE After Each Entry Use ACTUAL Excursion Trim Numbers 5000-5999
Hou Hour2 Hour3 Hour 4 How5 Hou 6 Hour7 Hou8 Hoa9 Hou OHour11 HouL12 Excursion 2219 220 220 2222 2222 2230 2245 2260 2268 2270 2288 2293
Ciew EXC Cut Outs E 0O Lif] [ ]
FAcrew EXC Cut Ins F 0 I) & b ]
DateI_______I
Super Duty, 526 561 j593 628 644 61| 715 7 770 787 824 84
9/1/2003 SD Cut Outs I [1 0 6- 1 0
__ _0_1 LEA [7F LE I]LI LI]L ]LI
SD Cut Ins - 0 0
Enter Target 40 40 4P 20 40 20 40 30 0 tion Total
Data Actual I 35 32 35 1S 37 34 18 37 17 37 25 1 323 I - -- - --- -- -- -- -- - ---- - - - -- I
Hour UnitsLost Team DTDescri Class DTCo roduction Hou
Break 0 25 H5660 D H n 1h 9.25
Adjust jD8 RH Dechain 10t[3i I I JPH
05 L5660 ID13 Box Secure 10thef 121i~35 j
0 75 1K5660 _L ID21 Multi-Fill JEupment _j 4 [21
;rF F 1 ter JHolding on Frames 10thei IT3J I
Remaining DT 0
Units
---.
IV PageSpecific HOur
Figure 7: Sample PICRS input screen (numbers in this figure are fictitious for confidentiality reasons)
The PICRS input screen (Figure 7) can solve the above mentioned problems associated with using spreadsheets, and can bring additional advantages as well. The supervisor uses this input screen for the whole duration of the shift. He first needs to select the data/crew combination located at the upper left corner of the form. This input activates all the fields on this screen and prompts the system to fill in all the default values and retrieve last shift's final job numbers, respectively for Excursions and Super-duty trucks, to appear as the current shift's first two job numbers. In this screen, only the white text boxes and dropdown lists in area I and III need input or selection from the user. The cut-ins and cut-outs fields are pre-filled with zeros, but can be modified when occasionally some planned schedule changes. The actual production numbers, as indicated in the bottom line of area I, are automatically calculated from the job number input in the white text boxes. Text boxes in area II provide the user with several pieces of useful information, such as -numbers of Excursions produced in the current hour, cumulated total production, and cumulated JPH, etc. This information is also calculated from using the job numbers entered by the user with the help of arithmetic formulae imbedded in those textboxes. In area III, the user can, instead of typing in the description, select the downtime description from a dropdown list filtered by the team he has chosen. By doing this, the supervisor saves time as well as ensures the consistency of downtime description input by all the users. Moreover, with the Classification field and an optional
Comment field, the downtime information collected by PICRS is more detailed. The
I F 25 1H5660 I Gantry Panel .JEquipment _ : EPT150 Gantry in Manual
2 [ 1 H5660 J ID11 Cab Deck I QJ _ 2[ [ty
F2 1 1.5 K5660 J D21 Multi-Fill quipment pE zJ r290-84 I
r F2 F 55 Ither ~op j_3 F T 2 ther _J [ EQ1295 ]HighChainFFt
-yellow text box in area III tells the users how many more lost units he needs to account for, thus providing a means to caution against input error.
The Classification field classifies each downtime entry as one of the following six types described in table 6.
Classification Value Meaning
Equipment The downtime is equipment related and maintenance personnel need to respond to this type of downtime
Less Stock The downtime is caused inefficient material handling
Man Power The downtime is caused by the absence of operators or maintenance personnel
Operator The downtime is due to the operator's faulty operation Quality The downtime is due to a faulty part or unqualified material Other All other reasons that don't belong to the above categories
Table 6: Explanation of the Classification field
This PICRS input form also has other handy functions such as break adjust, and page
through email, which were not available with the spreadsheets. The break adjust function
provides a handy way to adjust hourly production targets in case of an unplanned break, such as for an emergency meeting. Figure 8 shows a snapshot of the Break Adjust form. The page through email function enables the supervisor to send text pages about the current hour's production number and downtimes to plant management by simply clicking one of the two buttons at the bottom of figure 7.
:E Target Adjustment Form
1. Select a white box and enter the New target for that hour. Repeat as neccessary. 2. Click "SAVE ADJUSTMENT" button when finished. Date Crew
19/1/2003 JA Crew
Houl Hou2 -o3 Hoz4 Hor5 HewS How7 Hw8 Heur9 Ho1 Howl Hou12
Current Targets 40 40 40 20 20 40 20 40 30 0
New Targets 4 1 4T 20 14 140- 20 140 P30FW-40--20
Units Calculator
Minutes Uris Lost
I I I
Figure 8: The Break Adjust form
Besides all the benefits PICRS provides for data entry, the more powerful functions come from the capability of backend relational database. All the data input goes into the database, which makes the storage and manipulation of the data a lot easier.
3.2.2 User Interface Design for Managers and Engineers
Managers use PICRS primarily for viewing and printing reports. The capability to manipulate data and generate various useful reports is the main consideration in designing the user interfaces for managers.
Figure 9 shows a sample interface for crew and area managers to use to generate downtime pareto reports. Using this form, the manager can choose any line-crew-classification combination, any time range, and a number between 1 to 10 or "all" to designate how many downtime reasons to be shown. She can also choose either list or chart format for the report.
Down
Time
Reporting
Line IChassis I Crew JA Crew's J
Classification AH _:j Dates (mmfdd/yy)
From 9 1 -2003 To 12/1/2003
Double click in the box to bring about a calendar
of Reasons 15 Report Format jChart_:
Show Report
Figure 9: Sample user interface for managers
To facilitated the date input process and make the input consistent, we also built in a programmed calendar as shown in figure 10. The programmed calendar is a small piece of free software that is available from the Internet. By using available free software, we
3r Il 1 2 :JJ
14 15 16 17 113 19 2
21 22 2.3 24 125 2 6 2 7
41 Pv
Isep H
402000, Sunbaked Sof tware Inc.
Figure 10: Calendar to facilitate the date selection
Figure 11 shows what the report looks like based on the input in figure 9. This is only one example of the many reports that managers can generate with easy-to-use interfaces like the one in figure 9. Feedback has shown that managers have found these reports to be very handy and useful (see section 5.1 of this thesis for some quotes of the user feedback). This functionality of PICRS is something that the old spreadsheet
Dovrntime Repo t Chart: Cha r 1 A1 Cre Ffm 9 1 2H3 Tz 121 2M3 o E KfL** Unit5 Lost 44, Oc cwrrnces
Figure 11: Sample report for downtime pareto charts (numbers in this figure are fictitious for confidentiality reasons)
Engineers, including industrial engineers and maintenance engineers, interact with PICRS more analytically. Maintenance engineers need to enter maintenance comments to each downtime that is equipment related. We have created fields in the data tables and separate input forms to enable maintenance engineers to do so. Figure 12 shows the
interface where maintenance can enter comments on line downtimes in a real-time fashion. Managers can also view these comments in the reports they generate. This functionality greatly enhanced the communication between production and maintenance people and is warmly received.
Maintenance Action Form
Hour Units Lost Team DT Description Classification Supervisors Comment Maintenance Action 1 0.25 H!%60 DOSH Dechain other
1 05 LW I D13 Box Sece offhel
1 075 KW6 - D21 EIL" Upper mukifill-brake lill head -adi. Clamp
1 1 Odhw HoI&din oFtwames Other
25 H560 Ganry PaN- Eipmenin
2 1 _H___0 D11_CabDac__ _
Iuai
2 i.s K56M D21 M i - VFD fault on upper mutifll due to cat track
2 5.5 othe" Fat Top Met H DCain F Raised flattop sections -repair in progress
Figure 12: PICRS interface for maintenance engineers (numbers in this figure are fictitious for confidentiality reasons)
Industrial engineers use production information to produce various reports on matters like OEE (Overall equipment effectiveness) and periodic production analysis. PICRS is an effort to automate some of the information processes at KTP. But due to the time and budget constraints of the project, many information processes have to remain the old, Excel-based way. However, we did create some interfaces and wrote VB codes for industrial engineers to automatically populate certain Excel-based reports using data stored in PICRS.
Figure 13 is part of the OEE report automatically generated by PICRS upon clicking a few buttons by the industrial engineers. Before PICRS, it took one industrial engineer at least half a work day to come up with the same report.
Overal 1023.5 Mai ntenance Totai 53 _22 M-..b-Fill O3fF (iality Stops Total 46725 Gan-try -*]x M-9 7 EZL N Stt i G.78 fro r me 2 Engine CelNv23 E2.BPit 39T ,r- S - 9r -f C has s is 1 Summary (8012103 to 8/28103) -7--
~T.-Figure 13: Partial sample Excel report automatically generated by PICRS (numbers in this figure are fictitious for confidentiality reasons)
3.3 Downtime Codes Structure
One of the major drawbacks of the old Excel-based system is that there is no consistent way to describe a downtime. Individual supervisors use somewhat different descriptions for the same downtime reason. For example, for the same downtime reason such as Radiator Install Failure, one supervisor might write "Radiator install down, 2 U"-meaning the time to produce two trucks (if at full speed) is lost due to failure at radiator install station-while another supervisor might just write "2 Rad Inst.".
Differences in descriptions, such as in this case, make automatic manipulation of downtime data, such as grouping and sorting, impossible. In designing the PICRS system, a major task is to develop a list of downtime codes that are well structured, informative, comprehensive, and easy to use.
From the beginning, we thought that PICRS could not only automate the reporting process, but also be a good opportunity to provide information with the level of detail that has never been achieved before.