HAL Id: inserm-00130046
https://www.hal.inserm.fr/inserm-00130046
Submitted on 13 Nov 2007
HAL is a multi-disciplinary open access archive for the deposit and dissemination of sci-entific research documents, whether they are pub-lished or not. The documents may come from teaching and research institutions in France or abroad, or from public or private research centers.
L’archive ouverte pluridisciplinaire HAL, est destinée au dépôt et à la diffusion de documents scientifiques de niveau recherche, publiés ou non, émanant des établissements d’enseignement et de recherche français ou étrangers, des laboratoires publics ou privés.
Sensitivity of four psychometric tests to measure
cognitive changes in brain aging-population-based
studies.
Cécile Proust-Lima, Hélène Amieva, Jean-François Dartigues, Hélène
Jacqmin-Gadda
To cite this version:
Cécile Proust-Lima, Hélène Amieva, Jean-François Dartigues, Hélène Jacqmin-Gadda.
Sensitiv-ity of four psychometric tests to measure cognitive changes in brain aging-population-based stud-ies.. American Journal of Epidemiology, Oxford University Press (OUP), 2007, 165 (3), pp.344-50. �10.1093/aje/kwk017�. �inserm-00130046�
Sensitivity of four psychometric tests to measure cognitive changes in brain
aging population-based studies
Cécile Proust-Lima1,2*, Hélène Amieva2,3, Jean-François Dartigues2,3 and Hélène Jacqmin-Gadda1,2
1
INSERM E0338, 33076 Bordeaux, France.
2
Universite Victor Segalen, 33076 Bordeaux, France.
3
INSERM U593, 33076 Bordeaux, France.
* correspondence to : Cécile Proust-Lima, INSERM E0338, ISPED, Université de Bordeaux2, 146 rue Léo Saignat, 33076 Bordeaux Cedex, France. Tel : (33) 5 57 57 11 36 ;Fax : (33) 5 56 24 00 81 ;e-mail : cecile.proust@isped.u-bordeaux2.fr
Abstract :
Choosing the measure of cognition in an epidemiological study investigating cognitive changes over time is a challenging question. A powerful measure must be able to detect small cognitive changes in all the range of cognition observed in the target population. This work aims at comparing the sensitivity to detect cognitive changes in the observed range of cognition of four widely used psychometric tests in an aging population-based study through a nonlinear latent process model assuming that the psychometric tests are nonlinear noisy transformations of their common factor. On data from the French prospective cohort study PAQUID (1989-2001), we found that the Mini Mental State Examination and the Benton Visual Retention Test exhibited a better sensitivity to cognitive changes in low levels of
HAL author manuscript inserm-00130046, version 1
HAL author manuscript
cognition while the Digit Symbol Substitution Test was more sensitive to changes in high levels of cognition. In contrast, the Isaacs Set Test shortened at 15 seconds appeared to be sensitive to small changes in all the range of cognition and thus, represents an appropriate measure of cognition in population-based studies including both highly normal and severely impaired subjects.
Keywords :
Aging ; cognition; epidemiological methods; dementia; neuropsychological evaluation
Introduction
With the increasing number of people suffering from neurodegenerative diseases, especially Alzheimer’s disease, investigating cognitive changes over time has received a growing attention in population-based cohort studies for understanding natural history of the neurodegenerative diseases as well as in intervention trials designed to assess the effects of drugs on neuropsychological functioning (1, 2). In these studies, cognition is generally assessed through a battery of psychometric tests repeatedly administered to the subjects. Collecting several cognitive tests may be useful because this allows to explore various cognitive domains (memory functioning, attention or executive functions) and because the tests often have different metrological properties. In particular, some tests are very sensitive to small changes in high levels of cognition while others are more sensitive to changes in the lower levels. As a consequence, when studying the effects of drugs or ageing process on cognition, results may differ considerably according to the properties of the test considered (3). A way to deal with this problem is to study the change over time of the common latent cognitive level underlying the battery of cognitive tests used (4).
However administering an extensive battery of neuropsychological tests can turn out to be difficult because of duration (and thus cost) of the evaluation and also because subjects presenting cognitive impairment are more prone to refuse long testing sessions than cognitively intact elderly subjects (5). In this way, it would be of substantial interest to compare the properties of commonly used cognitive tests to highlight arguments for selecting a restricted number of tests and even only one according to the aim of the study.
Brevity and easiness of use are obviously relevant criteria to select a test for population-based studies. Nonetheless it is more crucial to select a test able to detect small changes in cognition in all the range of cognitive levels observed in the target population (1, 2) particularly in cases
of prolonged follow-up or long term prevention studies. Indeed, the range of general cognitive level targeted will be different according to whether the study sample consists in subjects from population-based cohorts, patients consulting Memory Clinics for memory troubles or patients with Alzheimer’s disease enrolled in pharmacological trials. Until now, when a single psychometric test is collected, the Mini Mental State Examination (MMSE) (6) is usually preferred because it gives a brief measure of global cognitive functioning (7). However, as the MMSE suffers from a strong ceiling effect, it is not suitable to identify slight declines in high levels of cognition (7, 8) and thus, is not appropriate to study normal cognitive ageing in prospective studies particularly among highly educated people.
The aim of this work is to compare sensitivity to cognitive change of four tests widely used in clinical practice: the MMSE, the Isaacs Set Test, the Benton Visual Retention Test and the Digit Symbol Substitution Test. More specifically, we would like to identify the most appropriate test to measure cognitive changes over time in heterogeneous populations including both highly normal and severely impaired subjects as encountered in population-based studies. To answer this purpose, we use a nonlinear latent variable model for longitudinal multivariate data in which psychometric tests are assumed to be nonlinear parameterized transformations of a common factor (4). The common factor is a latent process representing the latent cognitive process underlying the psychometric tests. It is related to age through a linear mixed model for describing the latent cognitive evolution according to age. By estimating flexible transformations between the psychometric tests and the common factor, we are able to compare the metrological properties of the psychometric tests.
This approach may be viewed as an extension of Item Response Theory (IRT) (9) to handle repeated measurements of quantitative outcomes (the summary scores of each test) instead of binary outcomes (the individual binary items of one test). The link functions estimate the mean score of each test given the values of the latent process similarly to the Item
Characteristic Curve in IRT models which estimates the probability of correct response given the latent ability. In addition, we are able to estimate evolution with time of the latent process and the test scores.
Methods
Population
PAQUID is a prospective cohort study initiated in 1988 in South Western France (Dordogne and Gironde) to explore functional and cerebral ageing. In brief, 3777 subjects who were 65 years and older and were living at home at enrollment were included in the cohort and were followed up 6 times with a visit at 1 year (V1), 3 years (V3), 5 years (V5), 8 years (V8), 10 years (V10) and 13 years (V13) after the initial visit (V0) except at 1 year in Dordogne. At each visit a neuropsychological evaluation and a diagnosis of dementia were carried out at home. See Letenneur et al. (10) for a detailed description of the PAQUID program.
Neuropsychological evaluation
In PAQUID, a battery of psychometric tests was used to evaluate cognition. In this paper we focus on four tests:
(i) the Mini Mental State Examination (MMSE) (6) is a sum-score evaluating various dimensions of cognition (memory, calculation, orientation in space and time, language and word recognition). It is used as an index of global cognitive performance and ranges from 0 to 30.
(ii) the Isaacs Set Test (IST15) (11) shortened at 15 seconds evaluates verbal fluency abilities and speed of verbal production. Subjects have to give a list of words (with a maximum of 10)
belonging to a specific semantic category in 15 seconds. Four semantic categories were successively used (cities, fruits, animals and colours). The score ranges from 0 to 40.
(iii) the Benton Visual Retention Test (BVRT) (12) evaluates immediate visual memory. After the presentation for 10 seconds of a stimulus card displaying a geometric figure, subjects are asked to choose the initial figure among four possibilities. 15 figures are successively presented. The score ranges from 0 to 15.
(iv) the Digit Symbol Substitution Test (DSST) (13) explores attention and psychomotor speed. Given a code table displaying the correspondence between pairs of digits (from 1 to 9) and symbols, the subjects have to fill in blank squares with the symbol which is paired to the digit displayed above the square. The subjects have to fill in as many squares as possible in 90 seconds. In PAQUID, the score ranges from 0 to 76 even if the theoretical maximum is 90.
Statistical model
The statistical model assumes that the correlation between the tests is induced by a latent common cognitive factor. Thus, each test is a measure with error of a test-specific non linear transformation of the common factor. The evolution of the common factor was modelled using a linear mixed model (14) which aims at evaluating changes over time of a repeated outcome (here the latent common factor) accounting for correlation between the repeated measures on each subject. The linear mixed model included random intercept, age and square age in accordance with other longitudinal ageing studies (15, 16) which showed quadratic cognitive evolutions. We added a Brownian motion to account for individual deviations from this quadratic evolution and thus relaxed the parametric form of the model. Test-specific random intercepts were added to evaluate if, for a same level of the latent common factor, two subjects scored differently at the tests.
We used flexible nonlinear transformations to link each psychometric test with the latent common factor. The chosen flexible transformations were Beta Cumulative Distribution Functions (Beta CDF) which offer a large variety of shapes (concave, convex or sigmoid) using only two estimated parameters per test. The estimated Beta CDFs represent the shapes of the transformations between the latent common factor and each of the four tests and provide interesting metrological properties for each test. The complete methodology was previously detailed in Proust et al (4) and is described in Appendix.
Sample
Measurements at the initial visit (V0) were excluded from the analysis because of a first passing effect previously described (17). Indeed a test-retest improvement was observed between V0 and V1 possibly due to a stress induced by the first evaluation at V0 or a practice effect observed after the first evaluation. From the 3,777 subjects in PAQUID, we retained 3,043 subjects who were followed up after V0 and we studied the evolution of the common factor between V1 and V13. The DSST was not completed at V3. Moreover, a sub-sample of PAQUID completed a nutritional questionnaire at V3 which could impact on the IST15 score for the fruit and animal categories. So we excluded the measurements of IST15 at V3. From the sample of 3,043 subjects, we retained a sample of 2,252 subjects with at least one measure at each neuropsychological test between V1 and V13 to ensure that every subject brought information about each neuropsychological test. The median number of measures was 4 for the MMSE (Interquartile range (IQR)=2-5) and BVRT (IQR=2-5) and respectively 3 and 2 for the IST15 (IQR=1-4) and the DSST (IQR=1-4).
Results
Description of the sample
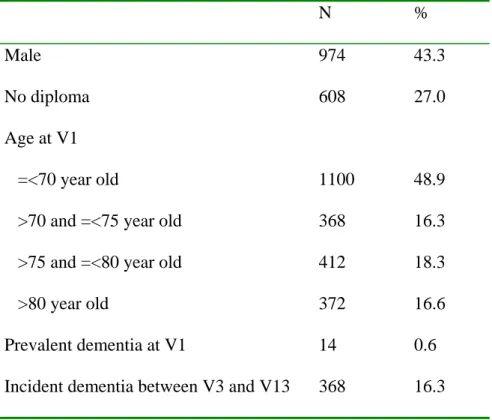
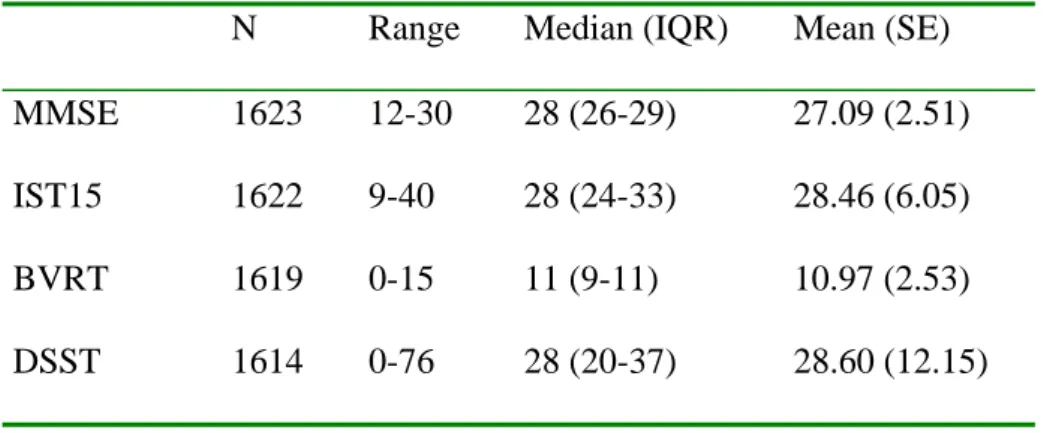
Characteristics of the subjects in the sample are described in table 1: 56.7% of the subjects were women and 73% had at least graduated from primary school. The mean age at the beginning of the follow-up (V1) was 75.16 (se=6.24). Among the 2,252 subjects, 14 had a positive diagnosis of dementia at V1 and 368 subjects were diagnosed as demented during the follow-up. At visit V1, 1,623 subjects completed the MMSE with a median score of 28 (IQR=26-29), 1,622 subjects completed the IST15 (median=28, IQR=24-33), 1,619 subjects completed the BVRT (median=11, IQR=9-13) and 1,614 completed the DSST (median=28, IQR=20-37) (table 2).
Cognitive evolution with age
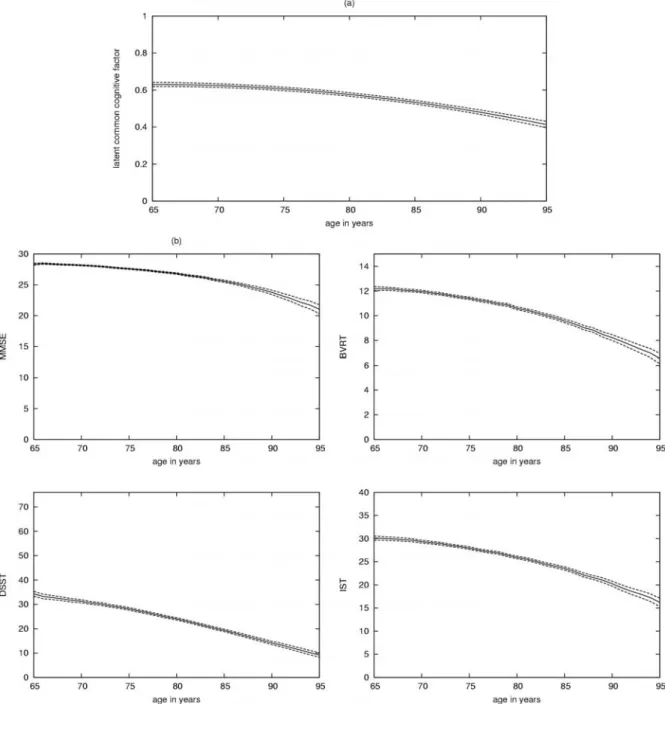
The latent common cognitive factor ranges from 0 to 1; 0 corresponding to a minimal cognitive performance and 1 to a maximal cognitive performance. The predicted mean evolution of the latent common cognitive factor and its 95% confidence bands are displayed in figure 1a. It shows a decline of cognitive performances in the population according to age with an acceleration of the decline in older ages. This evolution can be interpreted as the mean cognitive decline with age in a population of subjects of 65 years and older including both demented and non-demented subjects.
The predicted mean evolutions of the four tests and their 95% confidence bands are displayed in figure 1b. The decline of the DSST is quite linear whereas the decline observed in the other tests is nonlinear with an acceleration in older ages.
Comparison of the sensitivity of the four tests
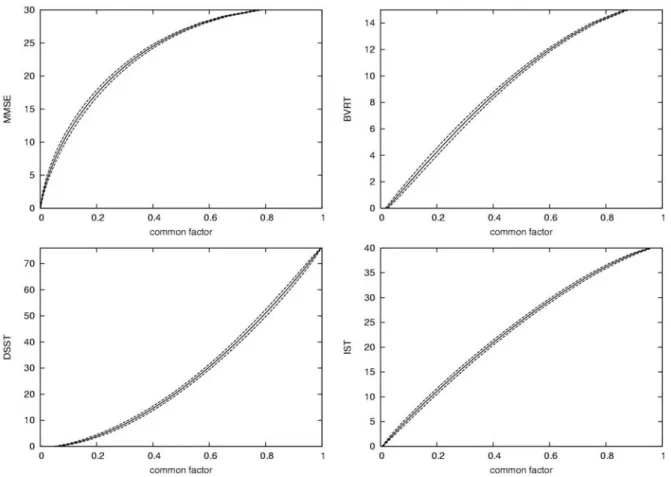
The estimated transformation shapes between each test and the common factor are displayed in figure 2. They are very different for the four tests: the transformation is concave for the
MMSE and the BVRT, convex for the DSST and close to linear for the IST. Moreover the MMSE and the BVRT only cover respectively 78% and 85% of the common factor range while the DSST and the IST cover almost all the entire range with respectively 94% and 95% of the common factor range.
Ceiling effect
For the MMSE and the BVRT, the maximum value of the test is reached for a value of the common factor lower than its maximum (respectively 0.78 and 0.87) which shows that these tests are not appropriate to assess cognitive changes in subjects with very high general cognitive level functioning. This underlines the ceiling effect of these two tests. In contrast, the maximum values of the IST and the DSST are reached for a value of the common factor close to 1 underlining that these tests do not suffer from a ceiling effect and can identify changes in the highest levels of cognition.
The MMSE transformation
The nonlinear shape of the MMSE transformation shows that a decline of the MMSE does not correspond to the same intensity of decline of the common factor in all the range of the test. Indeed, a loss of 0.1 in the common factor scale between 0.7 and 0.6 represents a loss of 1 point for the MMSE whereas the same loss between 0.3 and 0.2 represents a loss of more than 4 points for the MMSE. This shows that a decline in the MMSE can not be interpreted without accounting for the initial value and that the MMSE is more appropriate to detect a decline in low cognitive levels than in high cognitive levels.
The BVRT transformation
The shape of the BVRT transformation is quite linear in the low cognitive levels (corresponding to a value under 10 at the BVRT or under 0.5 on the common factor scale). It reveals that, under a value of 0.5 for the common factor, a decline in the BVRT represents the same intensity of decline for the common factor whatever the initial cognitive level. However,
in the high levels of cognition, the slope of the curve decreases. Thus, in the higher levels of cognition, the BVRT is less sensitive to small cognitive changes.
The DSST transformation
The shape of the DSST transformation is quite linear in the high levels of cognition corresponding to a score upper than 25 or a common factor level upper than 0.54. This means that above this value, whatever the initial cognitive level, a decline of the DSST corresponds to the same decline in the latent cognitive level. In contrast, in the low levels of cognition, the shape is nonlinear revealing that one point lost at the DSST corresponds to a greater decline of the common factor level under a score of 25. In this way, subjects with a very low level of general cognitive functioning (lower than 0.1) tend to score 0 at the DSST. This could be explained by the fact that subjects with a low level of cognition can probably not even understand the instructions of the DSST. Thus, DSST is appropriate to identify small changes in cognition among subjects with high to medium general cognitive level but not among impaired subjects.
The IST15 transformation
In contrast with the other tests, the IST15 transformation is close to linear on the entire range of cognition. This shows that the IST15 proves to be sensitive to change in all the ranges of cognition: one point lost at the IST15 score in higher values of the score has the same interpretation in terms of cognitive decline as one point lost in the lower values of the score. Thus, the IST15 can be useful for evaluating cognition in a heterogeneous population including both subjects presenting high general cognitive functioning and subjects with a severe cognitive impairment.
Discussion
By modelling jointly four psychometric tests and their latent common factor, we have been able to compare their distributions in all the range of cognition. In this way, we showed that MMSE and BVRT were not sensitive to cognitive changes in high levels of cognition and thus were not appropriate to study cognitive ageing in prospective studies including highly educated people. On the contrary, we showed that the DSST was very sensitive to cognitive changes in high levels of cognition. However, as it was less sensitive to cognitive changes in low levels of cognition, it could neither be suitable for measuring cognitive changes in heterogeneous populations consisting of both highly normal and severely impaired subjects. In contrast, the IST15 appeared to be a satisfactory cognitive measure in all the range of cognition which is of substantial interest when studying cognitive ageing in population-based cohort studies.
The IST15 has several assets comparing with the three other tests. Firstly, it does not suffer from a floor effect or a ceiling effect. Indeed, using cognitive measures with border effects can lead to misleading results (especially under-estimated declines) when investigating cognitive changes since initial scores are often differentially distributed among exposure groups and the sensitivity of the tests to identify cognitive changes is thus different among these groups (1). Secondly, the Isaacs Set Test when shortened at 15 seconds as well as the DSST includes a speed component which may explain its high sensitivity to changes in upper levels of cognition. Indeed, the speed component plays a key role in cognitive ageing and it has been shown for example that most of age-related differences in cognition were due to the decrease in the processing-speed (18). Lastly, the IST15 is a very brief test and its instructions are easily understandable. It can therefore be performed in large population-based studies even with severely impaired subjects.
The methodology we proposed in this paper has several advantages that should be discussed. Firstly, the estimated link functions between the test scores and the latent process make it possible to compare properties of the tests and, especially, their sensitivity to detect cognitive changes within the entire range of cognition. This is done by modelling jointly various psychometric tests for which the hypothesis of a common factor is sensible. By the way, it is worth noting that the latent common factor in this model is actually defined according to the pool of psychometric tests used in the analysis. Computing the model with other tests involving different cognitive components could have an impact on the common factor evolution. In this analysis, we used tests which both are frequently used and explore different domains of cognition because we wanted to select one test for exploring general cognitive decline in heterogeneous populations. The methodology could also be used for selecting sensitive measures in a specific domain of cognition. In this case, based on his/her knowledge or on other analyses such as principal component analyses, the researcher must choose the tests which are assumed to measure the same latent cognitive ability in this specific domain and then apply the methodology to the selected tests.
A second asset of the methodology is that, thanks to the estimated transformations of tests, the tests are no longer constrained to follow a Gaussian distribution as in a standard linear mixed model. In this way, even if longitudinal evolutions of the four tests, as presented in figure 1b, could have actually been estimated using linear mixed models, they would have been obtained under the wrong Gaussian assumption .
Lastly, as parameters are estimated using the Maximum Likelihood Estimators, results are robust to data missing at random (i.e. when the probability that a data is missing does not depend on unobserved values given the past observed values). Simpler analyses which aim at comparing empirical means of the tests for different age groups are often biased by the missing data process, especially when the cognitive level and the dropout are linked as it was
previously shown in the Paquid cohort (17). In this previous work, it was also shown that the missing at random assumption was probably not strictly true, but the impact on the estimated evolution was slight (17, 19). Moreover, even if missing data may blur the comparison of evolution of the tests scores, it is very unlikely that they biased the comparison of test sensitivity which is the main objective of this paper. This was checked by comparing transformations estimated on four sub samples defined by the time of dropout (dropout after V3, V5, V8, V10 or complete follow-up) in the spirit of pattern mixture analysis (20). Whatever the pattern of dropout, the estimated transformations were very similar (results not shown).
Some methodological issues of this analysis should however be discussed. Firstly, as the results rely on a parametric model, adequation of the model to the data has been carefully checked using post-fit methods based on the residuals and the predictions developed in Proust et al. (4) (results not shown). An essential part of the model is the link function between the tests and the common factor. The Beta CDF was chosen because this transformation was flexible enough to exhibit very different shapes and depended on only two parameters per test. However, complementary analyses have been performed estimating the link functions on a basis of splines instead of the Beta CDFs ; they have led to very similar results while raising more numerical problems due to the large number of parameters.
Secondly, in the PAQUID study, MMSE was the first test fulfilled during each testing session. Consequently, it was more frequently completed than the three other tests, particularly among impaired subjects. To ensure that test-specific parameters were estimated on the same sample and to maintain comparability between the tests, we required that every subject had at least one measure at each test. The 791 subjects excluded from the sample were older (median of 78.6 vs. 73.1) and less educated (51.5% did not graduated from primary school vs. 27% in the sample) than the subjects included in the selected sample but the range
of the observed scores was the same. Note also that using longitudinal data and keeping incident cases of dementia in the sample increased the observed range of cognition and allowed us to compare evolution of each test over time.
In conclusion, our results show that the Isaacs Set Test shortened at 15 seconds could be a good candidate to measure cognitive changes in a general population. More generally, the methodology used in this study provides some clues to thoughtfully select the appropriate measures of cognition collected in a study according to the nature of the target population and the objective of the study.
Acknowledgements
This study was funded by NOVARTIS pharma, SCOR insurance Agrica, Conseil Général de la Gironde and Conseil général de la Dordogne.
Appendix : model specification
We consider K neuropsychological tests. For each test k, k=1,…,K, each subject i, i=1,…,N and each occasion j, j=1,…,nik, the measure of the neuropsychological test yijk is collected at
time tijk, tijk being different for each test and each subject. The latent process which represents
the common factor of the K neuropsychological tests is modelled using the following linear mixed model including a quadratic function of time and a Brownian motion (wi(t))t≥0 with
variance term σw²×t :
( ) (
t
u
i) (
u
i)
t
(
u
i)
t
w
i(
t
i=
+
+
+
×
+
+
×
+
Λ
2 2 2 1 1 0 0μ
μ
μ
)
The vector of random effects ui=(u0i,u1i,u2i)T follows a multivariate normal distribution with
mean vector 0 and variance covariance matrix D. The mean evolution of the common factor is represented by the fixed effects μ0, μ1 and μ2.
The observed score value yijk is linked to the value of the common factor at the time of
measurement Λi(tijk) through a nonlinear link function hk which is a Beta CDF depending on
two test-specific parameters ηk=(η1k,η2k). This leads to the following measurement model :
(
ijk k)
i( )
ijk ik ijkk
y
t
h
;
η
=
Λ
+
α
+
ε
where the test-specific random intercept αik follows a Gaussian distribution with mean 0 and
variance σαk². It takes into account the residual individual variability between tests after
adjustment on the latent common factor, that is the fact that two subjects with the same latent cognition can score differently at the psychometric tests. At last, εijk are independent Gaussian
errors with mean 0 and variance σεk².
References
1. Morris MC, Evans DA, Hebert LE, Bienias JL. Methodological issues in the study of cognitive decline. Am J Epidemiol 1999;149:789-93.
2. Yesavage JA, Brooks JO, 3rd. On the importance of longitudinal research in Alzheimer's disease. J Am Geriatr Soc 1991;39:942-4.
3. Galasko DR, Gould RL, Abramson IS, Salmon DP. Measuring cognitive change in a cohort of patients with Alzheimer's disease. Stat Med 2000;19:1421-32.
4. Proust C, Jacqmin-Gadda H, Taylor JM, Ganiayre J, Commenges D. A nonlinear model with latent process for cognitive evolution using multivariate longitudinal data. Biometrics 2006;Online publication date: 26-Apr-2006 doi:
10.1111/j.1541-0420.2006.00573.x.
5. Dartigues JF, Commenges D, Letenneur D, et al. Cognitive predictors of dementia in elderly community residents. Neuroepidemiology 1997;16:29-39.
6. Folstein MF, Folstein SE, McHugh PR. "Mini-mental state". A practical method for grading the cognitive state of patients for the clinician. J Psychiatr Res 1975;12:189-98.
7. Tombaugh TN, McIntyre NJ. The mini-mental state examination: a comprehensive review. J Am Geriatr Soc 1992;40:922-35.
8. Commenges D, Gagnon M, Letenneur L, Dartigues JF, Barberger-Gateau P, Salamon R. Statistical description of the Mini-Mental State Examination for French elderly community residents. Paquid Study Group. J Nerv Ment Dis 1992;180:28-32.
9. Baker F. The basics of Item Response Theory. University of Maryland, College Park, MD: ERIC Clearinghouse on Assessment and Evaluation, 2001.
10. Letenneur L, Commenges D, Dartigues JF, Barberger-Gateau P. Incidence of dementia and Alzheimer's disease in elderly community residents of south-western France. Int J Epidemiol 1994;23:1256-61.
11. Isaacs B, Kennie AT. The Set test as an aid to the detection of dementia in old people. Br J Psychiatry 1973;123:467-70.
12. Benton A. Manuel pour l'application du Test de Rétention Visuelle. Applications cliniques et expérimentales. Paris: Centre de Psychologie appliquée, 1965. 13. Wechsler D. WAIS-R manual. New York: Psychological Corporation, 1981. 14. Laird NM, Ware JH. Random-effects models for longitudinal data. Biometrics
1982;38:963-74.
15. Hall CB, Lipton RB, Sliwinski M, Stewart WF. A change point model for estimating the onset of cognitive decline in preclinical Alzheimer's disease. Stat Med
2000;19:1555-66.
16. Amieva H, Jacqmin-Gadda H, Orgogozo JM, et al. The 9 year cognitive decline before dementia of the Alzheimer type: a prospective population-based study. Brain
2005;128:1093-101.
17. Jacqmin-Gadda H, Fabrigoule C, Commenges D, Dartigues JF. A 5-year longitudinal study of the Mini-Mental State Examination in normal aging. Am J Epidemiol
1997;145:498-506.
18. Salthouse TA. The processing-speed theory of adult age differences in cognition. Psychol Rev 1996;103:403-28.
19. Jacqmin-Gadda H, Commenges D, Dartigues J. [Analysis of longitudinal Gaussian data with missing data on the response variable]. Rev Epidemiol Sante Publique 1999;47:525-34.
20. Little R. Pattern-mixture models for multivariate incomplete data. Journal of the American Statistical Association 1993;88:125-34.
Figure 1: (a) Predicted mean evolution of the latent common factor with age (solid line) with
the 95% confidence bands obtained by a Bootstrap method (dashed lines) (b) predicted mean evolution (solid line) with the 95% confidence bands obtained by a Bootstrap method (dashed lines) for the MMSE, BVRT, DSST and IST15 : the PAQUID study, France, 1989-2001.
Figure 2: Estimated link function (Beta transformation) between each test and the latent
common factor (solid line) and the 95% pointwise confidence interval obtained by Bootstrap (dashed line) : the PAQUID study, France, 1989-2001.
Table 1: demographic and health characteristics in the sample (N=2252) : the PAQUID study, France, 1989-2001. N % Male 974 43.3 No diploma 608 27.0 Age at V1 =<70 year old 1100 48.9
>70 and =<75 year old 368 16.3 >75 and =<80 year old 412 18.3
>80 year old 372 16.6
Prevalent dementia at V1 14 0.6 Incident dementia between V3 and V13 368 16.3
Table 2: Description of the cognitive performances for the four psychometric tests at V1:
number of measures (N), range, median with interquartile range (IQR) and mean with standard error (SE) : the PAQUID study, France, 1989-2001.
N Range Median (IQR) Mean (SE) MMSE 1623 12-30 28 (26-29) 27.09 (2.51) IST15 1622 9-40 28 (24-33) 28.46 (6.05) BVRT 1619 0-15 11 (9-11) 10.97 (2.53) DSST 1614 0-76 28 (20-37) 28.60 (12.15)