HAL Id: insu-01664627
https://hal-insu.archives-ouvertes.fr/insu-01664627
Submitted on 15 Dec 2017
HAL is a multi-disciplinary open access
archive for the deposit and dissemination of
sci-entific research documents, whether they are
pub-lished or not. The documents may come from
teaching and research institutions in France or
abroad, or from public or private research centers.
L’archive ouverte pluridisciplinaire HAL, est
destinée au dépôt et à la diffusion de documents
scientifiques de niveau recherche, publiés ou non,
émanant des établissements d’enseignement et de
recherche français ou étrangers, des laboratoires
publics ou privés.
Photochemical Escape of Oxygen from Mars:
Consequences for Climate History
R. Lillis, Justin Deighan, J. L. Fox, S. Bougher, Y. Lee, M. Combi, François
Leblanc, T. Cravens, A. Rahmati, H. Gröller, et al.
To cite this version:
R. Lillis, Justin Deighan, J. L. Fox, S. Bougher, Y. Lee, et al.. Photochemical Escape of Oxygen from
Mars: Consequences for Climate History. Fourth International Conference on Early Mars: Geologic,
Hydrologic, and Climatic Evolution and the Implications for Life, Oct 2017, Flagstaff, Arizona, United
States. pp.LPI Contribution No. 2014. �insu-01664627�
PHOTOCHEMICAL ESCAPE OF OXYGEN FROM MARS: CONSEQUENCES FOR CLIMATE HISTORY. R. J. Lillis1, J. Deighan2, J. L. Fox3, S.W. Bougher4, Y. Lee4, M. Combi4, F. Leblanc5, T. E. Cravens6, A. Rahmati6, H. Gröller7, B. M. Jakosky21UC Berkeley Space Sciences Laboratory (rlillis@ssl.berkeley.edu), 2Laboratory for Atmos-pheric and Space Physics, University of Colorado Boulder, 3Department of Physics, Wright State University,
4Department of Atmospheric, Oceanic and Space Sciences, University of Michigan, 5Laboratoire de Météorologie
Dy-namique, Jussieu, Paris 6Department of Physics and Astronomy, University of Kansas. 7Lunar and planetary laboratory, University of Arizona.
Introduction: One of the primary goals of the MAVEN mission is to characterize rates of atmospher-ic escape at the present epoch and relate those escape rates to solar drivers. One of the major escape pro-cesses is known as photochemical escape, which is broadly defined as a process by which a) an exothermic reaction in the atmosphere results in an upward-traveling neutral particle whose velocity exceeds plane-tary escape velocity and b) the particle is not prevented from escaping through any subsequent collisions. At Mars, photochemical escape of oxygen is expected to be a significant channel for atmospheric escape, partic-ularly in the early solar system when extreme ultravio-let (EUV) fluxes were much higher. Thus characteriz-ing this escape process and its variability with solar drivers is central to understanding the role escape to space has played in Mars’ climate evolution [1, 2].
Dataset: we use near-periapsis (<400 km alti-tude) data from three MAVEN instruments: the Lang-muir Probe and Waves (LPW) instrument measures electron density and temperature [3], the Suprathermal And Thermal Ion Composition (STATIC) experiment measures ion temperature [4] and the Neutral Gas and Ion Mass Spectrometer (NGIMS) measures neutral and ion densities [5]. We use data from the MAVEN primary mission: February 1, 2015 to July 31, 2016 comprising ~78% of a Mars year.
Calculating instantaneous escape fluxes. For each profile of in situ measurements, we make several calculations, each as a function of altitude. The first uses electron and ion temperatures and simulates the dissociative recombination of O2+ to calculate the
probability distribution for the initial energies of the resulting hot oxygen atoms. The second is a Monte Carlo hot atom transport model that takes that distribu-tion of initial O energies and the measured neutral den-sity profiles and calculates the probability that a hot atom born at that altitude will escape. The third takes the measured electron and ion densities and electron temperatures and calculates the production rate of hot O atoms. We then multiply together the profiles of hot atom production and escape probability to get profiles of the production rate of escaping atoms. This is inte-grated with respect to altitude to give us the escape flux of hot oxygen atoms for that periapsis pass. Figure 1 shows how we calculate hot oxygen escape fluxes for each MAVEN periapsis pass, using a combination of measured quantities, experimental laboratory data and models.
Figure 1: Flowchart explaining calculation of hot oxygen escape from measured altitude profiles of neutral densi-ties and ion and electron densidensi-ties & temperatures.
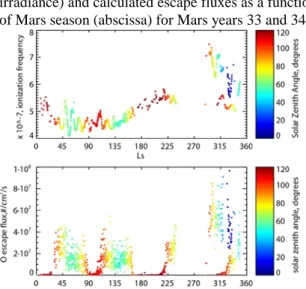
Hot Oxygen total escape fluxes. Figure 2 shows CO2 ionization frequency (calculate from from solar EUV irradiance) and calculated escape fluxes as a function of Mars season (abscissa) for Mars years 33 and 34.
Figure 2: total derived photochemical O escape fluxes are shown as a function of solar zenith angle and season.
We see that escape fluxes are substantially higher in early 2015, when Mars is comparatively close to the sun and the sun is reasonably active (approximately solar moderate), ranging 4 to 8 x 10⁷ /cm2/s. As Mars recedes and solar activity diminishes, photoionization frequency drops and average escape fluxes drop corre-spondingly during the same period. By the time MAVEN’s periapsis is on the dayside again in October 2015, ionization frequencies have dropped by ~40% from their highest values and derived escape fluxes have dropped by a factor of two or more. From then
3023.pdf Fourth Conference on Early Mars 2017 (LPI Contrib. No. 2014)
until mid-2016, both ionization frequencies and day-side escape fluxes stay generally low.
Factors of ~2-3 variability within a short time span arises from both natural variability in the physical sys-tem and our sampling of that syssys-tem. Relative neutral density changes due to gravity waves and atmospheric tides cause variability in escape probabilities and O2
+
densities[6,7]. In addition, plasma transport and iono-spheric currents are another source of variability [8,9].
Figure 3:All 594 individual dayside derived escape flux values (small pink dots) and binned values (black dia-monds) with standard errors. All power law fits to these binned averages that fall within the 1-sigma and 3-sigma error ellipsoid are shown as dark and light gray lines respectively. The best fit (power law index of 2.64) is shown in black.
Dependence on EUV flux. Figure 3 shows how pho-tochemical escape of oxygen depends on photoioniza-tion frequency over the range of values that have been measured by MAVEN. Despite a substantial spread in values, it is clear that a positive correlation exists. Best-fit power laws are larger than 2, with a linear de-pendence [10] providing a possible but unlikely fit to the data.
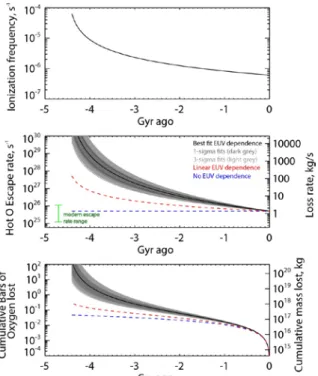
Consequences for Mars climate history. If we ex-trapolate this power law dependence of photochemical escape flux on photoionization frequency, we can esti-mate photochemical escape rates in the past when the sun was much brighter in the EUV [11]. Figure 4 shows, as a function of time in the past, photoioniza-tion frequency, extrapolated photochemical oxygen escape rates and cumulative atmospheric loss, under our best fit conditions (including 1-sigma and 3-sigma uncertainties), the linear assumption and no EUV de-pendence.
These extrapolations show that photochemical escape of oxygen could easily account for several hundred millibars of oxygen escape over the last 3.5 billion years. This, combined with the other escape processes MAVEN is probing (thermal hydrogen escape, pick up ion escape and sputtering escape) makes it clear that atmospheric escape is indeed the primary explanation
for the drastic reduction in Mars’ surface pressure and therefore the lack of stability of liquid water on Mars’ surface since that time.
Figure 4: Extrapolation of photochemical O escape rates over Martian history. Panel a) shows the assumed history of ionization frequency [11] b) and c) shows the resulting escape rates and cumulative oxygen lost respectively, as-suming the best power law fit (2.64) to ionization fre-quency dependence (thick black), the range of 1- and 3-sigma power law fits, a linear dependence (red dashed) [10] and no EUV dependence (blue dashed).
Conclusions and next steps: As well as this effort using in situ data, MAVEN can also constrain photo-chemical escape using remote sensing of the oxygen corona with the Imaging Ultraviolet Spectrograph (IUVS) [12, 13], the Solar Energetic Particle (SEP) instrument and the Solar Wind Ion Analyzer [14]. These multiple methods will eventually allow valida-tion of photochemical escape from Mars and its de-pendence on solar and planetary conditions, enabling confident extrapolation back into the past.
References: [1] McElroy et al., JGR, 1977, [2] Fox and Hac, Icarus, 2009, [3] Andersson et al, SSR, 2015, [4] McFadden et al., SSR, 2015, [5] Mahaffy et al., SSR, 2015, [6] Yigit and Medvedev, JGR, 2012, [7] England et al., JGR, 2016, [8] Morgan et al., JGR, 2008], [9] Riousset et al., JGR, 2013, [10] Cravens et al., JGR, 2016. [11] Ribas et al., ApJ, 2005, [12] Lee at al, GRL, 2015, [13] Deighan et al., GRL, 2015, [14] Rahmati et al., JGR, 2016.
3023.pdf Fourth Conference on Early Mars 2017 (LPI Contrib. No. 2014)