HAL Id: hal-01678537
https://hal.archives-ouvertes.fr/hal-01678537
Submitted on 16 Jan 2021
HAL is a multi-disciplinary open access
archive for the deposit and dissemination of
sci-entific research documents, whether they are
pub-lished or not. The documents may come from
teaching and research institutions in France or
abroad, or from public or private research centers.
L’archive ouverte pluridisciplinaire HAL, est
destinée au dépôt et à la diffusion de documents
scientifiques de niveau recherche, publiés ou non,
émanant des établissements d’enseignement et de
recherche français ou étrangers, des laboratoires
publics ou privés.
Galactic winds with MUSE: A direct detection of Fe ii*
emission from a z = 1.29 galaxy
Hayley Finley, Nicolas Bouche, Thierry Contini, Benoit Epinat, Roland
Bacon, Jarle Brinchmann, Sebastiano Cantalupo, Santiago Erroz-ferrer,
Raffaella Anna Marino, Michael Maseda, et al.
To cite this version:
Hayley Finley, Nicolas Bouche, Thierry Contini, Benoit Epinat, Roland Bacon, et al.. Galactic winds
with MUSE: A direct detection of Fe ii* emission from a z = 1.29 galaxy. Astronomy and Astrophysics
- A&A, EDP Sciences, 2017, 605, pp.A118. �10.1051/0004-6361/201730428�. �hal-01678537�
DOI:10.1051/0004-6361/201730428 c ESO 2017
Astronomy
&
Astrophysics
Galactic winds with MUSE: A direct detection of Fe
ii
* emission
from a z = 1.29 galaxy
?
Hayley Finley
1,2, Nicolas Bouché
3, Thierry Contini
1,2, Benoît Epinat
1,2,4, Roland Bacon
5, Jarle Brinchmann
6, 7,
Sebastiano Cantalupo
8, Santiago Erroz-Ferrer
8, Raffaella Anna Marino
8, Michael Maseda
6, Johan Richard
5,
Ilane Schroetter
1,2, Anne Verhamme
5,9, Peter M. Weilbacher
10, Martin Wendt
10,11, and Lutz Wisotzki
101 Université de Toulouse, UPS-OMP, 31400 Toulouse, France
e-mail: [email protected]
2 IRAP, Institut de Recherche en Astrophysique et Planétologie, CNRS, 14 avenue Édouard Belin, 31400 Toulouse, France 3 IRAP, Institut de Recherche en Astrophysique et Planétologie, CNRS, 9 avenue Colonel Roche, 31400 Toulouse, France 4 Aix-Marseille Univ, CNRS, LAM, Laboratoire d’Astrophysique de Marseille, Marseille, France
5 CRAL, Observatoire de Lyon, CNRS, Université Lyon 1, 9 avenue Ch. André, 69561 Saint-Genis Laval Cedex, France 6 Leiden Observatory, Leiden University, PO Box 9513, 2300 RA Leiden, The Netherlands
7 Instituto de Astrofísica e Ciências do Espaço, Universidade do Porto, CAUP, Rua das Estrelas, 4150-762 Porto, Portugal 8 ETH Zurich, Institute of Astronomy, Wolfgang-Pauli-Str. 27, 8093 Zürich, Switzerland
9 Observatoire de Genève, Université de Genève, 51 Ch. des Maillettes, 1290 Versoix, Switzerland 10 Leibniz-Institut für Astrophysik Potsdam (AIP), An der Sternwarte 16, 14482 Potsdam, Germany
11 Institut für Physik und Astronomie, Universität Potsdam, Karl-Liebknecht-Str. 24/25, 14476 Golm, Germany
Received 12 January 2017/ Accepted 31 May 2017
ABSTRACT
Emission signatures from galactic winds provide an opportunity to directly map the outflowing gas, but this is traditionally challenging because of the low surface brightness. Using very deep observations (27 h) of the Hubble Deep Field South with the Multi Unit Spectroscopic Explorer (MUSE) instrument, we identify signatures of an outflow in both emission and absorption from a spatially resolved galaxy at z = 1.29 with a stellar mass M? = 8 × 10⁹ M , star formation rate SFR = 77+40−25M yr−1, and star formation
rate surface brightnessΣSFR = 1.6 M kpc−2 within the [O
ii
] λλ3727, 3729 half-light radius R1/2, [OII] = 2.76 ± 0.17 kpc. From acomponent of the strong resonant Mg
ii
and Feii
absorptions at −350 km s−1, we infer a mass outflow rate that is comparable to the starformation rate. We detect non-resonant Fe
ii
* emission, at λ2365, λ2396, λ2612, and λ2626, at 1.2−2.4−1.5−2.7 × 10⁻¹⁸erg s−1cm−2respectively. The flux ratios are consistent with the expectations for optically thick gas. By combining the four non-resonant Fe
ii
* emission lines, we spatially map the Feii
* emission from an individual galaxy for the first time. The Feii
* emission has an elliptical morphology that is roughly aligned with the galaxy minor kinematic axis, and its integrated half-light radius, R1/2, Feii∗= 4.1±0.4 kpc,is 70% larger than the stellar continuum (R1/2,?' 2.34 ± 0.17) or the [O
ii
] nebular line. Moreover, the Feii
* emission shows a bluewing extending up to −400 km s−1, which is more pronounced along the galaxy minor kinematic axis and reveals a C-shaped pattern
in a p − v diagram along that axis. These features are consistent with a bi-conical outflow.
Key words. galaxies: evolution – galaxies: formation – galaxies: starburst – galaxies: ISM – ISM: jets and outflows – ultraviolet: ISM
1. Introduction
Galactic winds, driven by the collective effect of hot stars and supernovae explosions, play a major role in regulating galaxy evolution. By expelling enriched matter beyond the halo, galactic winds can address discrepancies between obser-vations andΛCDM models that over-predict the number of low-mass galaxies (Silk & Mamon 2012) and enrich the intergalac-tic medium (Oppenheimer & Davé 2008; Cen & Chisari 2011; Shen et al. 2012; Pallottini et al. 2014; Rahmati et al. 2016; Ford et al. 2016). Likewise, galactic winds may play a major role in regulating the mass-metallicity relation (Finlator & Davé 2008;Lilly et al. 2013;Tremonti et al. 2004). Therefore, quanti-fying the mass fluxes of galactic outflows (and their extents) is necessary to gain a complete understanding of galaxy evolution.
? Based on observations of the Hubble Deep Field South made with
ESO telescopes at the La Silla Paranal Observatory under program ID 60.A-9100(C). Advanced data products are available at http:// muse-vlt.eu/science
However, while galactic winds appear ubiquitous (e.g., Veilleux et al. 2005; Weiner et al. 2009; Steidel et al. 2010; Rubin et al. 2010b, 2014; Martin et al. 2012; Heckman et al. 2015; Zhu et al. 2015; Chisholm et al. 2015; Gallerani et al. 2016;Fiore et al. 2017), observational constraints for the phys-ical properties of galactic outflows, including their extents and mass outflow rates, are sparse. Traditional “down the barrel” 1D galaxy spectroscopy provides direct constraints on the wind speed from the blue-shifted absorption lines but cannot constrain the physical extent of outflows, leading to large uncertainties in outflow rates. Techniques that use a background source can ad-dress this question.
For instance, the background quasar technique provides con-straints on the physical extent of gas flows from the impact parameter between the galaxy and the absorbing gas (e.g., Bouché et al. 2012,2016;Kacprzak et al. 2012;Schroetter et al. 2015,2016;Péroux et al. 2016;Straka et al. 2016). These recent studies have made progress investigating the kinematics, orien-tation, and extent of gas flows around star forming galaxies.
As a variation on this technique, spectroscopy against a back-ground galaxy probes absorption from the foreback-ground galaxy halo over a larger solid angle (e.g., Adelberger et al. 2005; Rubin et al. 2010a; Steidel et al. 2010; Bordoloi et al. 2011, 2014; Diamond-Stanic et al. 2016). However, these constraints on the physical extent of outflows are usually limited due to their 1D nature, except forCazzoli et al.(2016). Mapping the extent of gas flows in 2D is critical to better constrain mass outflow rates.
Mapping outflows in emission, such as for M82 (e.g., Shopbell & Bland-Hawthorn 1998; Lehnert et al. 1999) and other nearby galaxies (e.g., Heckman et al. 1995; Cecil et al. 2001; Veilleux & Rupke 2002; Matsubayashi et al. 2009; Moiseev et al. 2010; Bolatto et al. 2013; Krips et al. 2016), is difficult at high redshift, because the emitting gas inherently has a very low surface brightness. Nonetheless, several studies have detected emission signatures from outflows in galaxies beyond the local universe (e.g.,Genzel et al. 2011;Newman et al. 2012; Förster Schreiber et al. 2014). Currently, rest-frame UV and op-tical spectroscopy use three types of emission signatures to map the extent of outflows: the nebular, resonant, and non-resonant emission lines.
The most common nebular emission lines seen in H
ii
re-gions are hydrogen recombination and forbidden lines, such as [Oii
] λλ 3727, 3729. A transition is resonant when a photon can be absorbed from the ground state and re-emitted to the same lowest level of the ground state, as for Lyman-alpha and the Mgii
λλ2796, 2803 transitions. A transition is non-resonant when the photon can be re-emitted to an excited level of a ground state that has multiple levels due to fine structure splitting. Non-resonant transitions are commonly denoted with a *, like Feii
*. Due to the slight energy difference between the ground and ex-cited states, photons from non-resonant emission no longer have the correct wavelength to be re-absorbed through a resonant tran-sition and instead escape. In other words, the gas is optically thin to photons that are emitted through a non-resonant transition.The first type of emission signature (nebular lines) from out-flows can appear as a broad component in nebular emission lines such as H α. Broad components are regularly seen in local ultra-luminous infra-red galaxies (ULIRGs, e.g.,Soto & Martin 2012;Arribas et al. 2014;García-Burillo et al. 2015) and more recently in normal star-forming galaxies (Wood et al. 2015; Cicone et al. 2016). At high redshifts,Newman et al.(2012) de-tected a broad H α component in composite spectra of z ∼ 2 star-forming galaxies and Genzel et al. (2011) observed this broad component in star-forming clumps from a few individual galax-ies. Similarly,Förster Schreiber et al.(2014) measure broad H α and [N
ii
] components from AGN-driven outflows in seven in-dividual z ∼ 2 galaxies. While the broad component from the AGN-driven outflows presented in Förster Schreiber et al. (2014) is localized near the galaxy nuclei,Newman et al.(2012) found that the broad emission is spatially extended beyond the half-light radius, R1/2.The second possible emission signature of outflows comes from resonant transitions. A common resonant line is Ly α, and deep surveys have shown that Ly α is often more extended than the stellar continuum (e.g., Steidel et al. 2011; Matsuda et al. 2012; Wisotzki et al. 2016) but can be strongly affected by dust absorption because of its large optical depth (Laursen et al. 2009). Emission from resonant metal lines, such as Na
i
D, Siii
, Feii
, or Mgii
, is less affected by dust than Lyα and may be observed as P-cygni profiles (e.g., Erb et al. 2012; Rupke & Veilleux 2015; Scarlata & Panagia 2015). The rela-tive strength between the (mostly) blue-shifted absorption and(mostly) redshifted emission dictates whether the signature ap-pears as a traditional P-cygni profile or as emission “infilling”. The impact of emission infilling varies for different transitions, as discussed inTang et al.(2014) andZhu et al.(2015). Contrary to the resonant Fe
ii
lines observed across a similar wave-length range (Feii
λ2344, λλ2374, 2382, and λλ2586, 2600), the Mgii
λλ2796, 2803 doublet is particularly sensitive to emis-sion infilling, since its lower energy level does not have fine structure splitting. As a result of the different possible relative strengths of the emission and absorption components, observed profiles for the resonant Mgii
λλ2796, 2803 transitions vary greatly for different star-forming galaxies (Weiner et al. 2009; Rubin et al. 2011; Coil et al. 2011; Erb et al. 2012; Talia et al. 2012;Martin et al. 2012,2013;Kornei et al. 2013).The third possible signature of outflows in emission is from non-resonant transitions such as C
ii
*, Siii
* (e.g.,Shapley et al. 2003) or Feii
* (e.g.,Rubin et al. 2011). Detecting non-resonant emission typically requires stacking hundreds of galaxy spectra. Using more than 800 Lyman break galaxies (LBGs) at z > 2, Shapley et al.(2003) first detected Siii
* in the composite spec-trum, andBerry et al. (2012) more recently detected Cii
* and Siii
* in the composite spectrum of 59 LBGs. Since the non-resonant Feii
* lines are at redder wavelengths than Cii
* and Siii
*, they are practical for investigating outflows at lower red-shifts, like z ∼ 1. Based on comparing composite spectra from samples of ∼100 or more star-forming galaxies at z ∼ 1−2 (Erb et al. 2012; Kornei et al. 2013; Tang et al. 2014), Feii
* emission may vary with galaxy properties, such as galaxy mass and dust attenuation.Coil et al.(2011) present individual spectra with different combinations of blue-shifted absorption, resonant Mgii
emission, and non-resonant Feii
* emission. In two notable direct detections of Feii
* emission from galaxies at z = 0.694 and z= 0.9392 (Rubin et al. 2011;Martin et al. 2012), the non-resonant emission is observed along with blue-shifted absorption lines and resonant Mgii
emission, allowing the authors to con-strain and model the outflows. Similarly,Jaskot & Oey (2014) use non-resonant Cii
* and Siii
* emission in UV spectra of four green pea galaxies at z ∼ 0.14−0.2 to infer the geometry of their outflows.These studies provide information about outflow proper-ties on galactic scales, but it is also possible to character-ize outflows from individual star-forming regions across z > 1 galaxies thanks to adaptive optics or gravitational lensing (i.e.,Genzel et al. 2011;Rigby et al. 2014;Karman et al. 2016; Bordoloi et al. 2016; Patricio et al., in prep.). Using adaptive op-tics, Genzel et al. (2011) identify star-forming regions in five z > 2 galaxies and argue that bright regions (or clumps) with a broad component in the nebular emission are the launch sites for massive galactic winds. With the benefit of gravita-tional lensing,Karman et al.(2016) characterize Mg
ii
emission, Feii
* λλ2612, 2626 emission, and Feii
absorption from mul-tiple star-forming regions across a supernova host galaxy at z = 1.49 at locations both associated with and independent of the supernovae explosion.Bordoloi et al.(2016) likewise detect blue-shifted Feii
and Mgii
absorptions, redshifted Mgii
emis-sion, and non-resonant Feii
* λλ2612, 2626 emission in four star-forming regions of a gravitationally lensed galaxy at z= 1.70 but find that the outflow properties vary from region to region. Spa-tially resolved observations suggest that outflow properties could be localized and strongly influenced by the nearest star-forming clump.Despite advances from these diverse studies, we have not yet been able to map the morphology and extent of outflows driven by star formation from individual galaxies beyond the local
ii
universe. The new generation of integral field spectrographs, theMulti Unit Spectroscopic Explorer (MUSE;Bacon et al. 2015) on the VLT and the Keck Cosmic Web Imager (Morrissey et al. 2012), are well suited for studying galactic winds in emission and tackling this challenge. While slit spectroscopy can inad-vertently miss scattered emission if the aperture does not cover the full extent of the outflowing envelope (Scarlata & Panagia 2015), integral field observations eliminate aperture effects for distant galaxies, making emission signatures easier to detect. The combined spatial and spectroscopic data facilitate character-izing the morphology and kinematics of both star-forming galax-ies and the outflows they produce.
In this paper, we analyze galactic wind signatures from a spa-tially resolved star-forming galaxy at z= 1.2902 observed with MUSE. We present the observations in Sect.2 and summarize the galaxy properties in Sect.3. With the integrated 1D MUSE galaxy spectrum, we characterize outflow signatures from Fe
ii
, Mgii
, and Mgi
transitions in absorption and Feii
* transitions in emission in Sect.4. We then investigate the spatial extent and the kinematic properties of the Feii
* emission in Sects.5and6, respectively. In Sect.7, we compare our observations with radia-tive transfer wind models and estimate the mass outflow rate. We review our findings in Sect. 8. Throughout the paper, we assume a ΛCDM cosmology with Ωm = 0.3, ΩΛ = 0.7, andH0 = 70 km s−1Mpc−1. With this cosmology, 1 arcsec
corre-sponds to 8.37 kpc at the redshift of the galaxy.
2. Data
MUSE fully covers the wavelength range 4650−9300 Å with 1.25 Å per spectral pixel. The field of view spans 10× 10with
a pixel size of 0.200. The instrument is notable both for its high
throughput, which reaches 35% at 7000 Å (end-to-end includ-ing the telescope), and its excellent image quality sampled at 0.200per spaxel. While MUSE provides new possibilities for
ad-dressing a wide variety of scientific questions, these two charac-teristics make the instrument optimal for deep field observations. As part of commissioning data taken during July and August 2014, MUSE observed a 10× 10field of view in the Hubble Deep Field South (HDFS) for a total integration time of 27 h. The final data cube was created from a 5σ-clipped mean of 54 individual exposures that were taken in dark time under good seeing condi-tions (0.500−0.900). The 1σ emission-line surface brightness limit for this cube is 1 × 10⁻¹⁹erg s−1cm−2arcsec−2. The MUSE
ob-servations provided spectroscopic redshifts for 189 sources with magnitude I814 ≤ 29.5 (8 stars and 181 galaxies), a
factor-of-ten increase over the 18 previously-measured spectroscopic red-shifts in this field. A catalog of sources in the MUSE HDFS field includes the redshifts, emission-line fluxes, and 1D spectra. The observations, the data cube, and an overview of scientific ex-ploitations are fully described inBacon et al.(2015). Both the data cube and the catalog of sources are publicly available1.
The deep IFU observations reveal emission from Fe
ii
* tran-sitions directly detected from one galaxy in the MUSE HDFS. The galaxy has ID #13 in the MUSE catalog, with coordinates α = 22h32m52.16s, δ = −60◦33023.9200 (J2000) andmagni-tude I814 = 22.83 ± 0.005. It is part of a nine-member group at
z '1.284, discussed inBacon et al.(2015), which also includes two AGN and an interacting system with tidal tails. This direct detection of a galaxy with Fe
ii
* emission offers a new opportu-nity to characterize galactic winds.1 http://muse-vlt.eu/science/hdfs-v1-0/
3. Galaxy properties
Galaxy ID#13 is part of a sample of 28 spatially resolved galax-ies thatContini et al.(2016) selected from the MUSE HDFS ac-cording to the criterion that the brightest emission line covers at least 20 spatial pixels with a signal-to-noise ratio (S/N) higher than 15. For this galaxy, emission from the [O
ii
] λλ3727, 3729 doublet is the dominant feature in the MUSE spectrum. We determined the galaxy systemic redshift from a p-v diagram extracted from the MUSE data cube along the galaxy kine-matic major axis by fitting a double Gaussian profile to the [Oii
] λλ3727, 3729 emission at each position along the slit. The systemic redshift of z = 1.29018 ± 0.00006 is the mean value between the two asymptotes of the rotation curve.Contini et al. (2016) investigated the morphological and kinematic properties of the galaxy ID#13, as part of the MUSE HDFS spatially resolved galaxy sample. They constrained the morphology from HST images in the F814W band by model-ing the galaxy with G
alfit
(Peng et al. 2002) as a bulge plus an exponential disk.Contini et al.(2016) then performed the kine-matic analysis with two different techniques: a traditional 2D line-fitting method with the Camel algorithm (Epinat et al. 2012; Contini et al. 2016) combined with a 2D rotating disk model, which requires prior knowledge of the galaxy inclination, and a 3D fitting algorithm, GalPaK3D(Bouché et al. 2015), whichsi-multaneously fits the morphological and kinematic parameters directly from the MUSE data cube. The parameters from the 2D and 3D models are in good agreement overall (see Table1).
From the morphological analysis on the HST images, we find that galaxy ID#13 is compact with a disk scale length of Rd = 1.25 kpc (correspondingly R1/2 = 2.1 kpc) and has a
low inclination angle of i = 33◦. The inclination from 3D
fit-ting yields a lower value of ∼20◦. The disagreement likely arises from an asymmetric morphology seen in the HST images, since statistically the two techniques measure inclinations that are in good agreement (Contini et al. 2016). The galaxy also shows a misalignment between the morphological position angle mea-sured from the HST image, −46◦, and the MUSE kinematic
po-sition angle, −13◦, again likely due to the asymmetric light
distri-bution that only appears at higher spatial resolution. Regardless, the galaxy has a low inclination with i ∼ 20◦−30◦.
From the kinematic analysis on the MUSE data, the velocity field has a low gradient, ±10 km s−1, a low maximum velocity,
24 km s−1, and a velocity dispersion of 45−50 km s−1. There-fore, non-circular motions dominate the gas dynamics within the disk, with V/σ ≈ 0.5, that is, below the commonly-used V/σ ≤ 1 threshold for identifying dispersion-dominated galax-ies. We note that the different maximum velocities from the 2D and 3D methods are entirely due to the different inclination val-ues (Table1). Nonetheless, the ratio remains V/σ . 1 for the range of possible inclinations, 17◦−33◦.
Contini et al. (2016) estimated the visual extinction, AV =
1.20 mag, stellar mass, M? = 8 × 10⁹ M , and star
forma-tion rate SFR = 77+40−25 M yr−1, from stellar population
syn-thesis using broadband visible and near infra-red photometry2. The galaxy ID#13 is one of the most massive of the 28 spatially-resolved galaxies in the MUSE HDFS sample and also has the highest star formation rate (SFR). This SFR places galaxy ID#13 above the main sequence (Elbaz et al. 2007;Karim et al. 2011; Whitaker et al. 2014;Tomczak et al. 2016) by almost 1 dex, in-dicating that this galaxy is undergoing a starburst with a high
2 The [OII]-derived SFR for aChabrier(2003) IMF is 65 M
yr−1
us-ing theKewley et al.(2004) calibration, which also yields an extinction of AV = 1.5 in the gas.
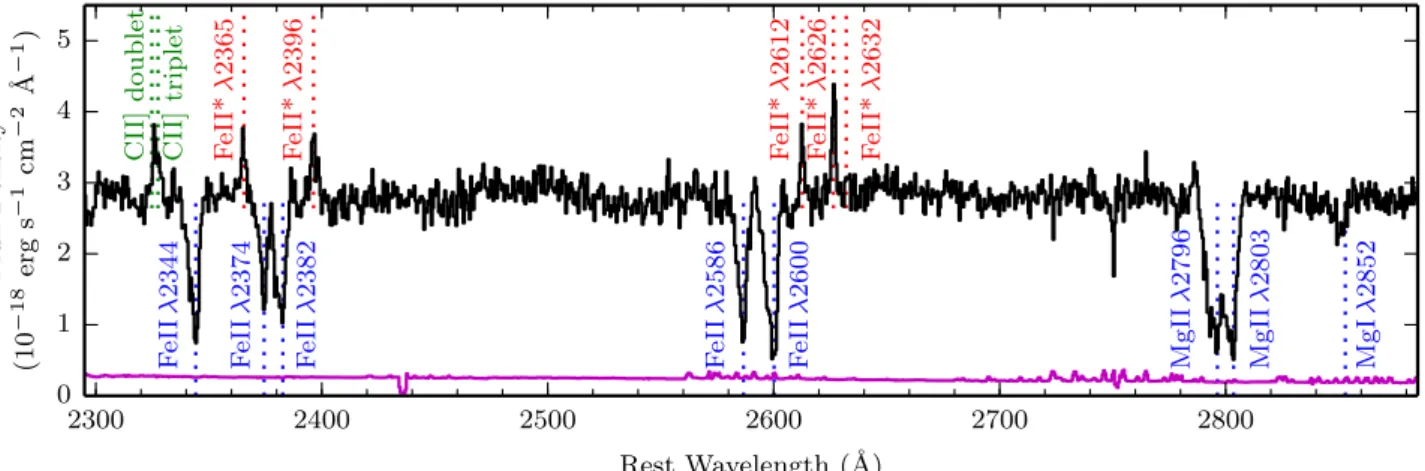
2300 2400 2500 2600 2700 2800 Rest Wavelength (˚A) 0 1 2 3 4 5 Flux Densit y (10 − 18 erg s − 1 cm − 2 ˚ A − 1) F eI I λ 2344 F eI I λ 2374 F eI I λ 2382 F eI I λ 2586 F eI I λ 2600 MgI I λ 2796 MgI I λ 2803 MgI λ 2852 F eI I* λ 2365 F eI I* λ 2396 F eI I* λ 2612 F eI I* λ 2626 F eI I* λ 2632 CI I] doublet CI I] triplet
Fig. 1.Vacuum rest-frame 1D spectrum of the MUSE HDFS galaxy ID#13 covering the Fe
ii
and Mgii
transitions. The spectrum is in black withthe 1σ error in magenta. Resonant transitions detected in absorption are labeled in blue. Non-resonant Fe
ii
* transitions detected in emission are labeled in red. The Cii
] nebular emission, which is a blend of five transitions, is labeled in green.Table 1. Galaxy ID#13 properties fromContini et al.(2016).
Morphological analysis HST+ GALFIT
Position angle (◦) −45.9 ± 1.9
Inclination i (◦) 33 ± 5
Half-light radius (kpc) 2.1 ± 0.03
Kinematic analysis MUSE 2D/3D
Position angle (◦) −14/−13
Inclination i (◦) +28/+17
Max. rotational velocity (km s−1) +24/+44 Velocity dispersion (km s−1) +48/+46
Photometric analysis SED fitting
Visual extinction AV(mag) 1.20+0.59−0.26
log (M?) (M ) 9.89 ± 0.11
log (SFR) (M yr−1) 1.89 ± 0.18
specific SFR of sSFR= 10 Gyr−1. The starburst phase of galaxy
evolution can produce large-scale outflows when many short-lived massive stars explode as supernovae.
The properties of this galaxy are conducive to detecting signatures from galactic winds. The low inclination angle fa-vors observing blue-shifted absorptions, given that this signa-ture increases substantially toward face-on galaxies (Chen et al. 2010;Kornei et al. 2012;Rubin et al. 2014). The [O
ii
] luminos-ity (∼1043erg s−1) and rest-frame equivalent width (∼50 Å, see Table3) indicate that the galaxy ID#13 is also well-suited for investigating winds in emission, since Feii
* and Mgii
emis-sion correlate with LOii or [Oii
] rest-frame equivalent width(Kornei et al. 2013;Zhu et al. 2015).
4. Absorption and emission profiles from the 1D spectrum
In this section, we analyze the galaxy ID#13 1D spectrum extracted from the MUSE data using a white-light weighting scheme. The 1D MUSE spectrum (Fig.1) reveals resonant Fe
ii
, Mgii
, and Mgi
self-absorption, non-resonant Feii*
emission, and Cii
] and [Oii
] nebular emission lines. The Feii
transitions occur in three multiplets3. In the Feii
UV1, UV2, and UV3 multiplets, a photon can be re-emitted either through a resonant3 SeeTang et al.(2014) orZhu et al.(2015) for energy level diagrams.
transition to the ground state, which produces emission infilling, or through a non-resonant transition to an excited state in the lower level, in which case the emission occurs at a slightly dif-ferent wavelength. We investigate the integrated absorption and emission profiles, focusing first on the resonant absorption and emission properties (Sect.4.1), then on the non-resonant emis-sion properties (Sect.4.2).
4.1. Resonant Fe and Mg profiles
Figure 2 presents the velocity profiles of each of the indi-vidual Fe
ii
, Mgii
, and Mgi
transitions relative to the galaxy systemic redshift, for comparison. The self-absorption profiles are asymmetric, with the strongest component centered on the galaxy systemic redshift, and a significant blue wing extend-ing to −800 km s−1. We fit these profiles simultaneously with VPFIT4 v10, using several components and requiring each to have the same redshift and Doppler parameter across the di ffer-ent transitions. The absorptions are well fit with three compo-nents at redshifts 1.28514 ± 0.00021, 1.28752 ± 0.00009, and 1.29024 ± 0.00006, corresponding to shifts of −660 ± 28 km s−1, −349 ± 12 km s−1and+8.5 ± 6.5 km s−1 relative to the galaxysystemic velocity. Table2summarizes the total rest-frame equiv-alent widths for each transition, calculated both from the fit and directly from the flux.
Globally, the Fe
ii
resonant transitions in Fig.2reveal several key features: (1) the Feii
profiles are very similar to one another, and (2) the strongest component is roughly centered at the galaxy systemic redshift. AsProchaska et al.(2011) first demonstrated, emission infilling in resonant absorption lines can alter doublet ratios and mimic partial coverage. However, here we find that emission infilling does not play a significant role in this galaxy for the following two qualitative arguments.First, while strong emission infilling would produce clear P-cygni profiles (which are not observed), moderate amounts of emission infilling would cause a blue-shift to the centroid of the absorption, an effect commonly seen in stacked spec-tra (e.g.,Zhu et al. 2015) or individual cases (Rubin et al. 2011; Martin et al. 2013). None of the absorptions in the galaxy ID#13 spectrum (Fig.2) have blue-shifted centroids.
Second, because Fe
ii
has multiple channels to re-emit the photons (through resonant and non-resonant transitions), theii
Table 2. Absorption rest-frame equivalent widths for the three sub-components in Fig.2.
Components A B C Total
Redshift 1.28514 1.28752 1.29024
∆v (km s−1) −660 ± 28 −349 ± 12 +8.5 ± 6.5
Transition Multiplet W0,fit W0,fit W0,fit W0,fit W0,flux
(Å) (Å) (Å) (Å) (Å) (1) (2) (3) (4) (5) (6) (7) Fe
ii
λ2344 Fe II UV3 0.13 0.93 2.06 3.09 3.47 ± 0.24 Feii
λ2374 Fe II UV2 0.04 0.55 1.70 2.42 2.20 ± 0.22 Feii
λ2382 Fe II UV2a 0.24 1.17 2.36 3.69 3.27 ± 0.22 Feii
λ2586 Fe II UV1 0.10 0.91 2.15 3.14 3.14 ± 0.26 Feii
λ2600 Fe II UV1 0.24 1.24 2.52 3.97 4.28 ± 0.25 Mgii
λ2796 0.98 1.64 2.82 5.51 5.09 ± 0.18 Mgii
λ2803 0.93 1.89 2.63 4.47 4.90 ± 0.17 Mgi
λ2853 0.16 0.49 0.31 0.94 0.86 ± 0.21Notes. Column (1): absorption line. Column (2): Multiplet associated with transition. Column (3): equivalent width for component A. Column (4): equivalent width for component B. Column (5): equivalent width for component C. Column (6): total equivalent width measured from fits. Column (7): total equivalent width measured from the spectrum.(a)Fe
ii
λ2382 is a pure resonant absorption line with no associated Feii
* emission.degree of infilling for a particular Fe
ii
absorption line depends on the likelihood of re-emission through the different channels within a multiplet. Purely resonant transitions, such as Mgii
and Feii
λ2382, are the most sensitive to emission infilling.Zhu et al. (2015) demonstrated that the Feii
resonant absorptions that are the least (most) affected by emission infilling are Feii
λ2374 (Feii
λ2600 and Feii
λ2382) respectively. Figure 2 shows that the Feii
λ2374, λ2600 and λ2382 absorption profiles are all very similar for the galaxy ID#13. The lack of blue-shifted centroids and the consistent absorption profiles suggest that emission in-filling does not have a strong impact.We quantify (and put a limit on) the global amount of in-filling using the method proposed by Zhu et al.(2015), which consists of comparing the observed rest-frame equivalent widths of the resonant lines to those seen in intervening quasar spec-tra (see their Fig. 12). Using the averaged rest-frame equivalent widths of resonant Fe
ii
and Mgii
absorptions from a stacked spectrum of ∼30 strong Mgii
absorber galaxies at 0.5 < z < 1.5 fromDutta et al.(2017, their Table 7), we find that our data could allow for at most <0.9 Å (<1.9 Å) of infilling for Feii
λ2600 (Feii
λ2382), the two transitions most susceptible to infilling (Zhu et al. 2015). This means that at most 22% (55%) of these absorptions could be affected by infilling and that the impact on the other Feii
absorptions is even smaller.In addition, we can estimate the amount of infilling for each of the three sub-components shown in Fig.2(Table2). We are unable to put constraints on the weak component “A”, but the blue-shifted component “B” at −350 km s−1does not allow for emission infilling that would increase the Fe
ii
λ2382 equivalent width by more than 10%. The component “C” at the galaxy sys-temic redshift allows for the largest amount of emission infill-ing with 60% corrections for Feii
λ2600 and Feii
λ2382, 40% for Feii
λ2344 and 20% for Feii
λ2586. As we discuss later in Sect. 7.2, the blue-shifted galactic wind component (“B”) appears to be less affected by emission infilling than the sys-temic component associated with the galaxy interstellar medium (ISM), (“C”).We end this section by mentioning that, as we will argue in Sect.7.2, the Fe
ii
and Mgii
gas is likely optically thick. The ab-sorptions ought to be saturated, and the reason we do not observefully absorbed profiles is either because of a partial covering fraction (rather than emission infilling) or more likely the low spectral resolution. As we will show in the next section, the non-resonant Fe
ii
* emission pattern is also consistent with optically thick gas.4.2. Non-resonant emission
Figure3shows the non-resonant transitions Fe
ii
* λ2365, λ2396, λ2612, and λ2626 that we detect in the MUSE HDFS galaxy ID#13 1D spectrum at 2.5σ−6σ significance. No Feii
* λ2632 emission is detected (Fig. 1). The fluxes in the non-resonant transitions Feii
* λ2365, λ2396, λ2612, λ2626 transitions are 1.2−2.4−1.5−2.7 × 10⁻¹⁸ erg s−1 cm−2, respectively. Table 3gives the emission peak fluxes and rest-frame equivalent widths measured for all of the Fe
ii
* transitions. These flux ratios of 0.5:1.0:0.6:1.0 are consistent with the expectation (0.66:1.0:0.66:1.0) for optically thick gas discussed inTang et al. (2014). In the optically thin regime, the flux ratios should be on the order of approximately one.Regarding the non-detection of Fe
ii
* λ2632, we note that this transition is usually not detected in stacked spectra (Talia et al. 2012;Kornei et al. 2013;Tang et al. 2014;Zhu et al. 2015), except for in theErb et al.(2012) stacked spectrum, but that it is observed in the other individual cases (Rubin et al. 2011;Martin et al. 2013).Tang et al.(2014) explore whether un-derlying stellar absorption suppresses the Feii
* λ2632 emission in their stacked spectra. However, for this starburst galaxy, the F- and G-type stars that produce the underlying absorption are unlikely to significantly contribute to the stellar continuum.We perform a joint Gaussian fit to the four non-resonant Fe
ii
* emission peaks and find that they appear symmetric and centered on the galaxy systemic redshift measured from [Oii
] λλ3727, 3729 (Fig. 3). This is in contrast to Zhu et al. (2015), who found that the Feii
* emission from their stacked spectrum of 8600 galaxies is slightly asymmetric, and in con-trast toRubin et al.(2011), who observed Feii
* emission peaks that are slightly (∼30 km s−1) redshifted relative to the nebular0.25 0.50 0.75 1.00 1.25 Fe ii λ2344 0.25 0.50 0.75 1.00 1.25 Fe ii λ2374 0.25 0.50 0.75 1.00 1.25 Fe ii λ2382 0.25 0.50 0.75 1.00 1.25 Normalized Flux Fe ii λ2586 Velocity (km s−1) 0.25 0.50 0.75 1.00 1.25 Fe ii λ2600 0.25 0.50 0.75 1.00 1.25 Mg ii λ2796 0.25 0.50 0.75 1.00 1.25 Mg ii λ2803 −1500 −1000 −500 0 500 1000 1500 Velocity (km s−1) 0.25 0.50 0.75 1.00 1.25 Mg i λ2853
Fig. 2.Fe
ii
, Mgii
, and Mgi
transitions detected in absorption in the1D MUSE spectrum. Error bars show the 1σ error on the flux (black), and the green curve traces the fit to the absorption profiles. Zero ve-locity is relative to the galaxy systemic redshift, z = 1.2902. Vertical blue dashed lines mark the three components used to fit each absorp-tion, and gray dashed lines show components that are part of neighbor-ing transitions. The asymmetric absorption profiles indicate significant blue-shifted absorption.
5. Morphology of the Fe
ii
* emissionIn this section, we investigate whether the Fe
ii
* emission has a similar spatial extent and morphology as the stellar continuum and the [Oii
] λλ3727, 3729 emission.For the Fe
ii
* emission, first we produced a sub-cube of size 1.500× 1.500for each of the four emission lines and transformedthe wavelength axis to velocity space. We interpolated each sub-cube to the same velocity scale with pixels of 30 km s−1that span
±930 km s−1and zero velocity at the galaxy systemic redshift, z= 1.2902.
We subtracted the continuum and combined the four sub-cubes. To estimate the stellar continuum, we used the mean
−2000 −1000 0 1000 2000
Velocity (km s
−1)
0.25 0.50 0.75 1.00 1.25 1.50Fe ii* λ2365
−2000 −1000 0 1000 2000Velocity (km s
−1)
0.25 0.50 0.75 1.00 1.25 1.50Fe ii* λ2396
−2000 −1000 0 1000 2000Velocity (km s
−1)
0.25 0.50 0.75 1.00 1.25 1.50Normalized
Flux
Fe ii* λ2612
−2000 −1000 0 1000 2000Velocity (km s
−1)
0.25 0.50 0.75 1.00 1.25 1.50Fe ii* λ2626
−2000 −1000 0 1000 2000Velocity (km s
−1)
0 5 10 15[O ii] λ3729
Fig. 3.Fe
ii
* and [Oii
] emission peaks detected in the normalized 1DMUSE spectrum. The green curve traces joint Gaussian fits to the four Fe
ii
* emission peaks and the [Oii
] doublet, respectively. Zero veloc-ity, indicated with the vertical red dashed line, is relative to the galaxy systemic redshift, z= 1.2902, measured from the [Oii
] emission.value from two regions redwards of the Fe
ii
* emission peaks at ∼λ2425 Å and ∼λ2700 Å that span 115 Å and 300 Å respec-tively. The continuum pseudo narrowband (NB) image shown in Fig.4 (middle left) is from the mean of these two continuum regions, which have a flat slope.From the combined Fe
ii
* emission velocity cube, we then extracted a NB image by summing 13 pixels (±390 km s−1). The top left panel of Fig.4shows the pseudo-narrowband Feii
* im-age with 2 × 2 smoothing and without a S/N threshold, which we use for the 2D analysis. For comparison, we also tested an au-tomated extraction with the CubExtractor software (Cantalupo et al., in prep.), shown in Fig.5, which selects connected volume pixels (voxels) that are above a specified S/N threshold (2.7 was optimal in this case) to produce optimally extracted images, as inBorisova et al.(2016). Our morphological results are indepen-dent of the method used to produce the Feii
* NB image.Similarly, we created the [O
ii
] pseudo-narrowband image from a 30 × 30 pixel (1.500× 1.500) sub-cube that spans 18spec-tral pixels (22.5 Å) to cover the λλ3727, 3729 doublet. Again, we subtracted the continuum estimated between ∼3550−3600 Å to obtain the [O
ii
] surface brightness map shown in the bottom left panel of Fig.4.ii
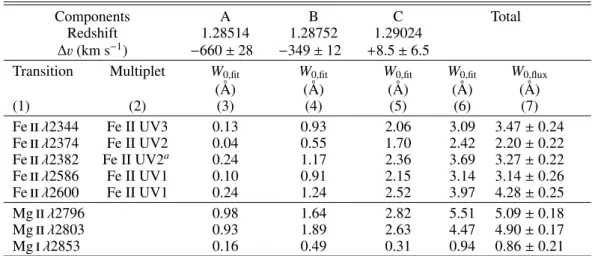
-20.1-13.4 -6.7 0.0 6.7 13.4 20.1 -2.4 -1.6 -0.8 0.0 0.8 1.6 2.4 MUSE Fe ii∗ -20.1-13.4 -6.7 0.0 6.7 13.4 20.1 RA Offset (proper kpc) Model Fe ii∗ -20.1-13.4 -6.7 0.0 6.7 13.4 20.1 -20.1 -13.4 -6.7 0.0 6.7 13.4 20.1 Data− (Model ∗ Seeing)-2.4 -1.6 -0.8 0.0 0.8 1.6 2.4 De c Offse t relati v e to -60 ◦33 23.94 (arcsec)
MUSE Stellar Continuum
Surface Brightness (10−18 erg s−1cm−2arcsec−2)
Model Stellar Continuum
-20.1 -13.4 -6.7 0.0 6.7 13.4 20.1 De c Offse t (pro p er k p c) -2.4 -1.6 -0.8 0.0 0.8 1.6 2.4 -2.4 -1.6 -0.8 0.0 0.8 1.6 2.4 MUSE [O ii] -2.4 -1.6 -0.8 0.0 0.8 1.6 2.4 RA Offset relative to 338◦13 02.26 (arcsec)
Model [O ii] -2.4 -1.6 -0.8 0.0 0.8 1.6 2.4 -20.1 -13.4 -6.7 0.0 6.7 13.4 20.1 0 2 4 6 0 2 4 6 8 10 12 0 15 30 45 60 75 90 105 -2.0 -1.5 -1.0 -0.5 0 0.5 1.0 1.5 2.0 -0.5 -0.25 0 0.25 0.5 −5 −4 −3 −2 −1 0 1 2 3 4 5
Fig. 4.Left panels: Surface brightness maps of Fe
ii
* (top), stellar continuum (middle), and [Oii
] emission (bottom) from pseudo narrowbandimages (see text). Solid contours represent 1/10 of the maximum surface brightness. The dashed line in the top left panel corresponds to the stellar continuum contour from middle left panel. The small black circles represent the seeing at the emission wavelength. Middle panels: Surface brightness maps of the intrinsic emission from an exponential disk model “deconvolved” from the seeing. Ellipses in the middle column are drawn using the model parameters and have a size that corresponds to the half-light radii (see Table4). Right panels: Maps of the residuals between the observed data and the intrinsic model convolved with the seeing. In the left and middle panels, white crosses indicate the galaxy major and minor axes from theContini et al.(2016) kinematic analysis. The Fe
ii
* emission map is more extended than both the stellar continuum or the [Oii
] emission.Table 3. Emission and absorption rest-frame equivalent width and flux values.
Multiplet λ Ehigh Elow J Aul W0 Flux
Å cm−1 cm−1 s−1 Å 10−18erg s−1cm−2 (1) (2) (3) (4) (5) (6) (7) (8) Fe
ii
UV1 2600.17 38458.98 0.00 9/2←9/2 Absorption 4.28 ± 0.25 ... 2626.45 38458.98 384.79 9/2→7/2 3.41E+07 −0.93 ± 0.13 2.67 ± 0.43 2586.65 38660.04 0.00 7/2←9/2 Absorption 3.14 ± 0.26 ... 2612.65 38660.04 384.79 7/2→7/2 1.23E+08 −0.53 ± 0.15 1.47 ± 0.49 2632.11 38660.04 667.68 7/2→5/2 6.21E+07 > − 0.27 <0.78 ± 0.42 2382.76 41968.05 0.00 11/2←9/2 Absorptiona 3.27 ± 0.22 ... Feii
UV2 2374.46 42114.82 0.00 9/2←9/2 Absorption 2.20 ± 0.22 ... 2396.36 42114.82 384.79 9/2→7/2 2.67E+08 −0.84 ± 0.17 2.37 ± 0.49 2344.21 42658.22 0.00 7/2←9/2 Absorption 3.47 ± 0.24 · · · Feii
UV3 2365.55 42658.22 384.79 7/2→7/2 5.90E+07 −0.42 ± 0.15 1.22 ± 0.48 2381.49 42658.22 667.68 7/2→5/2 3.10E+07b · · · · · · Cii
] 2324.21 43025.3 0.00 3/2→1/2 ... −1.03 ± 0.18 2.83 ± 0.50 2325.40 43003.3 0.00 1/2→1/2 ... 2326.11 43053.6 63.42 5/2→3/2 ... 2327.64 43025.3 63.42 3/2→3/2 ... 2328.83 43003.3 63.42 1/2→3/2 ... [Oii
] 3727.10 26830.57 0.00 3/2 →3/2 ... −48.98 ± 0.29 133.46 ± 0.80 3729.86 26810.55 0.00 5/2 →3/2 ...Notes. Column (1): transition name. Column (2): transition wavelength. Column (3): upper energy level. Column (4): lower energy level. Col-umn (5): level total angular momentum quantum number J. ColCol-umn (6): einstein Aulcoefficient for spontaneous emission. Column (7): rest-frame
equivalent width. Column (8): line flux.(a)Fe
ii
λ2382 is a pure resonant transition with no associated Feii
* emission.(b)Feii
*λ2381 emission is blended with Feii
λ2382 absorption.The Fe
ii
* map in Fig. 4 is the first 2D spatial map of the Feii
* non-resonant emission in a individual galaxy at intermediate redshift. Previous studies have searched for signa-tures of extended Feii
* emission in stacked spectra (Erb et al. 2012; Tang et al. 2014). In a stacked spectrum from 95 star-forming galaxies at 1 < z < 2, Erb et al. (2012) found that the Feii
* λ2626 emission line is slightly more spatially extended that the stellar continuum.Tang et al.(2014) performed a similar analysis with 97 star-forming galaxies at 1 . z . 2.6, but were not able to spatially resolve the Feii
* emission.Thanks to the sensitivity of MUSE, we are able to address whether Fe
ii
* is more extended than the continuum and to char-acterize the Feii
* emission morphology for the first time. The top left panel of Fig.4shows that the extended Feii
* emission appears to be more extended than the continuum and has a priv-ileged direction. Comparing the Feii
* emission position angle with the kinematic axis of the galaxy shows that the Feii
* is more extended along the minor kinematic axis of the galaxy.To quantify the extent of the Fe
ii
*, stellar continuum, and [Oii
] λλ3727, 3729 emission, we used a custom Python MCMC algorithm to fit each of the surface brightness maps in the left column of Fig.4with a Sersic profile. The fit provides us with in-trinsic parameters and with an inin-trinsic model of the emitting re-gion, that is, deconvolved from the seeing, because we convolve the Sersic profile with the actual PSF taken from the brightest star in the same data cube, MUSE HDFS ID#1 (seeBacon et al. 2015), across wavelengths corresponding to the galaxy emission lines5. In practice, we fix the Sersic index n to n= 1 or n = 0.55 The PSF can be approximately described by a Moffat profile with
FWHM 0.7000
(0.6300
) at the Fe
ii
* and stellar continuum emission ([Oii
] emission) wavelengths, which corresponds to a half-light radius of 0.5000(0.4400
).
Table 4. Summary of 2D morphological analysis.
Fe
ii
* Stellar [Oii
]continuum
Axis ratio 0.57 ± 0.01 0.90 ± 0.02 0.85 ± 0.01 R1/2(arcsec) 0.49 ± 0.05 0.28 ± 0.02 0.33 ± 0.02
R1/2(kpc) 4.1 ± 0.4 2.34 ± 0.17 2.76 ± 0.17
because the Sersic index n is unconstrained6. The size estimate, R1/2, is nonetheless robust and independent of the Sersic index
n, since it is determined empirically from the flux growth curve, an integrated quantity.
Table4summarizes the results from this analysis and Fig.4 (middle column) shows the modeled profiles for n = 1 for the Fe
ii
*, stellar continuum, and [Oii
] emission. The right column of Fig.4 gives the residual maps, which are the difference be-tween the observed data and the intrinsic model convolved with the seeing.The stellar continuum emission (Fig.4, middle row) appears round and compact. The intrinsic emission from the exponen-tial disk fit yields an inclination of 28 ± 3◦ and a half-light
radius, R1/2, of around 0.28 ± 0.0200 (2.34 ± 0.17 kpc). These
continuum emission properties from MUSE are comparable to the measurements from HST images discussed in Sect. 3 and shown in Table1. The [O
ii
] λλ3727, 3729 emitting region has the same morphology but is slightly more extended than the stel-lar continuum with R1/2,[OII] = 0.33 ± 0.0200 (2.76 ± 0.17 kpc).6 The Sersic n index is unconstrained because the seeing radius is
much larger than the emission. Indeed, the seeing radius is FWHM/2= 0.3500
, corresponding to R1/2 ≈ 0.500for a Moffat profile, whereas the
ii
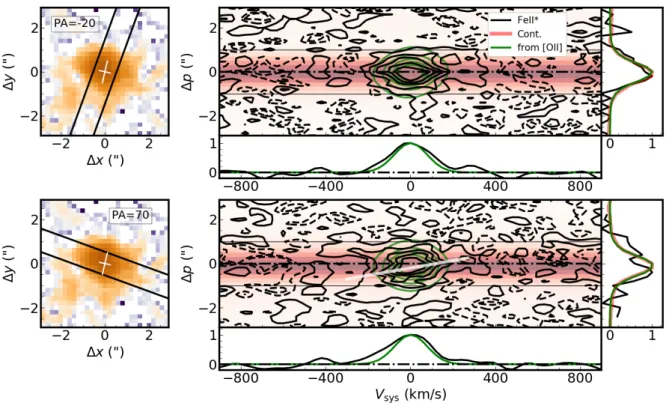
Fig. 5.Left panels: narrowband images of the Fe
ii
* emission optimally extracted from the MUSE cube shown with a 100-wide slit oriented −20◦
(top) and+70◦
(bottom). The+70◦
slit orientation in the bottom panels follows the Fe
ii
* major kinematic axis. The white crosses indicate the galaxy major and minor axes from theContini et al.(2016) kinematic analysis of [Oii
]. Right panels: position-velocity diagrams of the Feii
* emission from a slit oriented −20◦(top) and +70◦
(bottom). Zero velocity is relative to the galaxy systemic redshift, z =1.29018 ± 0.00006, measured from the [O
ii
] emission. Solid black contours trace Feii
* flux levels at 1.2, 3.6, 6, 8.4, and 11 × 10−20erg s−1cm−2. Dashed blackcontours show the negative flux levels at –1.2 and –2.4 ×10⁻²⁰erg s−1cm−2. Green contours represent the ISM component estimated from [O
ii
] (see text). The red gradient indicates the continuum intensity. The right side panel of each p − v diagram compares the spatial profile of the Feii
* emission (black) with that of the stellar continuum (red) and the ISM component (green). The bottom sub-panel of each p − v diagram shows the total 1D flux spectrum integrated across the spatial region between −100and+100
in the p − v diagram with the Fe
ii
* emission in black and the [Oii
] emission in green. In the bottom p − v diagram, the white solid line follows the velocity gradient. This panel also reveals a “C”-shape pattern in the blue wing of the Feii
* emission extending to –400 km s−1. The blue wing of the Feii
* emission is more pronounced along the slit orientation corresponding to the minor-axis (PA= +70◦), whereas the red wing appears for both slit orientations.
The corresponding star formation rate surface density isΣSFR=
1.6 M kpc−2.
The Fe
ii
* emission has a morphology and physical extent that are different from the stellar continuum and [Oii
] emis-sion. The intrinsic Feii
* emission is more elliptical with an axis ratio of b/a = 0.57, compared to the rounder continuum and [Oii
] emission, which both have b/a ' 0.9. The Feii
* emis-sion is elongated along the direction (PA ≈ +60◦) that roughly corresponds to the galaxy minor kinematic axis (PA ≈ +75◦,Table1). Moreover, the intrinsic half-light radius of the Fe
ii
* emission is R1/2, Feii∗ = 0.49 ± 0.0500, that is, about 50% largerthan that of the stellar continuum. In other words, the Fe
ii
* half-light radius, R1/2, Feii∗= 4.1 ± 0.4 kpc, extends &1.5 kpc beyondthe stellar continuum and the [O
ii
] emission, which both have R1/2 ≈ 2.5 kpc (Table4). This is apparent from comparing theextent of the Fe
ii
* emission to the continuum emission in the top left panel of Fig.4. See Table4for the emission properties.6. Kinematics of the Fe
ii
* emissionIn this section, we investigate whether it is possible to trace the kinematics of the Fe
ii
* emission. To do so, we visually in-spected the velocity cube produced in the previous section and found that the kinematic major axis from the Feii
* emissionfollows a PA of about +70◦, which happens to roughly
cor-respond to the galaxy minor kinematic axis. Figure 5 shows p −v diagrams for this +70◦ slit orientation (bottom row) and for a slit oriented at −20◦(top row). In both cases, the slit width
is 100. Following the peak of the Fe
ii
* emission, we see that the Feii
* emission has a velocity gradient along the galaxy minor kinematic axis. This velocity gradient is indicated in the bottom p −v diagram. Figure5also indicates the ISM component of the Feii
* emission, estimated by using the parameters from a 2D fit to the [Oii
] doublet to produce a single Guassian emission line scaled to the maximum intensity of the Feii
* emission.Comparing the contours for the ISM component and the to-tal Fe
ii
* emission in the p − v diagrams, we see that the Feii
* emission is kinematically more extended than the ISM compo-nent, with both red and blue wings. The red wing of the Feii
* emission extends to around+300 km s−1 and is noticeable inthe p − v diagrams from both slit orientations. For the slit orien-tation of+70◦, the blue wing of the Fe
ii
* emission extends to −400 km s−1near+100and −1.500, decreasing to −200 km s−1inbetween, and forms a C-shaped pattern. The red and blue wings suggest a bi-conical outflow and the C-shape pattern could mo-tivate a hollow conical geometry.
Figure6shows the spatial distribution of the Fe
ii
* emission from the blue-shifted (left) and redshifted (right) components−2 0 2 ∆x (”) −2 −1 0 1 2 ∆ y (”) −2 0 2 ∆x (”) −2 −1 0 1 2 ∆ y (”)
Fig. 6.Maps of the Fe
ii
* emission from the blue-shifted (left) and redshifted (right) outflow components with 2 × 2 Gaussian smoothing. Theblack lines show the two slit positions at+70◦
, and −20◦
. The white crosses indicate the galaxy major and minor axes from theContini et al.
(2016) kinematic analysis of [O
ii
]. The strongest emission from both the red and the blue-shifted components is roughly spatially coincident. In the case of a bi-conical outflow, this suggests that we may be observing emission predominantly from the base of the wind, not far from the plane of the galaxy.Fig. 7.Schematic representation of a bi-conical outflow from the minor
axis of a nearly face-on galaxy.
of the outflow after subtracting the ISM component. The Fe
ii
* emission from the blue and redshifted components is roughly spatially coincident. In the case of a bi-conical outflow, this sug-gests that we may be observing emission predominantly from the base of the wind, not far from the plane of the galaxy. Figure 7 presents a schematic representation to visualize a bi-conical out-flow from a nearly face-on galaxy.7. Discussion
From deep MUSE observations of the HDFS, we identify a spatially-resolved galaxy (ID#13) at z = 1.2902 that has a low inclination (i = 33◦), an orientation that may favor detecting
galactic outflows in emission (Rubin et al. 2014). This galaxy has a star formation rate of SFR= 77+40−25M yr−1, which places
it in the starburst category (seeContini et al. 2016, their Fig. 3). Its star formation rate surface densityΣSFR = 1.6 M kpc−2 is
well above the threshold for galactic winds (Newman et al. 2012; Bordoloi et al. 2014). The star formation rate and stellar mass of the HDFS galaxy ID#13 are nearly identical to those of two other
published individual galaxies with non-resonant Fe
ii
* emission at z = 0.694 (Rubin et al. 2011) and z = 0.9392 (Martin et al. 2013).The two galaxies fromRubin et al.(2011) andMartin et al. (2013), like the HDFS galaxy ID#13, also show direct evidence of galactic winds from blue-shifted absorptions. Neither the HDFS galaxy ID#13 nor these two galaxies have Fe
ii
P-Cygni profiles, although they might have moderate resonant Feii
emis-sion infilling. The HDFS galaxy ID#13 differs from the these galaxies in that it lacks any obvious Mgii
emission, whereas the Rubin et al.(2011) andMartin et al.(2013) galaxies have strong Mgii
P-cygni profiles. Among composite spectra that detect non-resonant Feii
* emission (Talia et al. 2012;Erb et al. 2012; Kornei et al. 2013; Tang et al. 2014; Zhu et al. 2015), only the galaxy samples fromErb et al. (2012) andKornei et al.(2013) reveal Mgii
P-cygni profiles.Our analysis of the HDFS galaxy ID#13 is the first to spa-tially map extended Fe
ii
* emission (Sect.5) around an individ-ual galaxy (Fig.4). We showed that this Feii
* emission is also kinematically extended (Fig.5) with blue-shifted emission (ex-tending to −400 km s−1) and redshifted emission (extending to+350 km s−1). The blue-shifted emission forms a C-shaped
pat-tern, suggesting a bi-conical outflow (Fig.7). Furthermore, the strong, asymmetric Fe
ii
and Mgii
absorptions in the 1D galaxy spectrum, which have blue-shifted components at −660 km s−1and −350 km s−1 relative to the systemic redshift (Fig.2), are also a clear signature of outflowing gas. In Sect.7.2, we will es-timate the mass outflow rate and compare it to the galaxy SFR.
First, in Sect.7.1, we compare the absorption and emission properties from the HDFS galaxy ID#13 and the two other in-dividual galaxies with predictions from radiative transfer wind models.
7.1. Comparison with radiative transfer models
The MUSE surface brightness maps (Fig.4) reveal that the Fe
ii
* emission has a more elliptical shape than the stellar continuum and the [Oii
] emission. Along with the kinematic signatures dis-cussed in the previous section (Fig. 5), this indicates that theii
0 1 2 3 4 5 Absor Fe ii λ2600 W0(˚A) 0 −1 −2 −3 −4 Emiss F e ii * λ 2626 + F e ii λ 2600 W 0 (˚A) UV1 DustGeometry ISM+Dust 0 1 2 3 4 5 Absor Fe ii λ2586 W0(˚A) 0 −1 −2 −3 −4 Emiss F e ii * λ 2612 + F e ii * λ 2632 + F e ii λ 2586 W 0 (˚A) UV1Prochaska et al. (2011) models: Fiducial τdust= 1 θb= 80◦ ISM Isotropic τdust= 3 θb= 45◦ ISM + dust 0 1 2 3 4 Absor Fe ii λ2374 W0(˚A) −1.2 −1.0 −0.8 −0.6 −0.4 −0.2 0.0 Emiss F e ii * λ 2396 W 0 (˚A) UV2 0 1 2 3 4 Absor Fe ii λ2344 W0(˚A) 0.0 −0.2 −0.4 −0.6 −0.8 −1.0 −1.2 Emiss F e ii * λ 2365 + F e ii λ 2344 W 0 (˚A) UV3 Direct Detections: This Work Rubin et al. (2011) Martin et al. (2013) This Work Rubin et al. (2011) Martin et al. (2013)
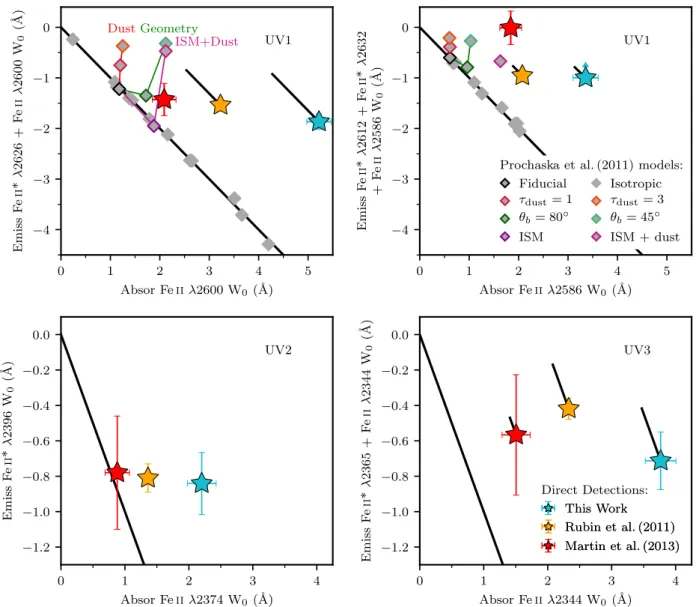
Fig. 8.Comparison of observed and modeled rest-frame equivalent widths from the Fe
ii
UV1, UV2, and UV3 multiplet transitions. Each panelplots the total equivalent width from re-emission as a function of the corresponding resonant absorption equivalent width. The black diagonal “photon-conservation” line indicates equal amounts of absorption and re-emission. Star-shaped points show the infilling-corrected equivalent width values from three direct detections: this work (blue), Rubin et al. (2011; yellow), and Martin et al. (2013; red). The diagonal black lines associated with these points trace the infilling correction. Gray diamonds in the top panels come from radiative transfer model predictions for the UV1 multiplet (Prochaska et al. 2011). Diamonds with colored outlines represent variations to the fiducial isotropic outflow model (black outline) that move the model predictions away from the photon-conservation line. Model predictions for the Fe
ii
UV2 and UV3 multiplets are not currently available.emission is not isotropic. Isotropic outflows are, however, the fiducial geometry for radiative transfer and semi-analytic wind models (Prochaska et al. 2011;Scarlata & Panagia 2015)7.
Another notable difference is that theProchaska et al.(2011) models of galactic outflows all predict resonant Fe
ii
P-Cygni profiles, whereas none of the observations of Feii
* emit-ters, whether in individual (HDFS galaxy ID#13, Rubin et al. 2011;Martin et al. 2013) or composite spectra (Talia et al. 2012; Erb et al. 2012; Kornei et al. 2013; Tang et al. 2014; Zhu et al. 2015), show Feii
P-cygni profiles.Prochaska et al. (2011) produce models for the Fe
ii
UV1 multiplet and Mgii
λλ2797, 2803 doublet to explore how vary-ing model geometries and physical assumptions about the dust content, ISM contribution, gas density, and wind speeds impact the line profiles from the resonant and non-resonant transitions.7 These models can be adapted to explore how the absorption and
emission line profiles vary for different anisotropic configurations.
Varying each of the physical properties individually from the fiducial model is not sufficient to suppress the resonant Fe
ii
and Mgii
P-Cygni profiles, and the only model that substantially suppresses the resonant emission combines an ISM component with dust extinction.We have compared the emission and absorption proper-ties of the MUSE HDFS galaxy ID#13 with predictions from theProchaska et al.(2011) radiative transfer models, following Erb et al.(2012). In Fig.8, we show the total amount of emis-sion (from both resonant and non-resonant channels) versus the total amount of resonant absorption for the Fe
ii
UV1, UV2, and UV3 multiplets. Absorptions from the Feii
λ2600 (UV1), Feii
λ2586 (UV1), Feii
λ2374 (UV2), and Feii
λ2344 (UV3) resonant transitions (clockwise from upper left) can each lead to non-resonant Feii
* re-emission and are presented in the four panels (clockwise from the upper left). The total re-emission in-cludes more or less resonant emission infilling, depending onthe Einstein A coefficients for the transitions (Tang et al. 2014; Zhu et al. 2015). For example, ∼90% of the re-emission fol-lowing Fe
ii
λ2374 absorption is re-emitted as Feii
* λ2396 non-resonant emission, making the emission infilling negligible.In Fig.8, we also include the two previously published di-rect detections of Fe
ii
* emission from individual star-forming galaxies (Rubin et al. 2011;Martin et al. 2013). Along with the points for the three direct detections of Feii
* emission, we plot lines that represent the emission infilling correction. We ap-plied the emission infilling correction following the method from Zhu et al.(2015) described in Sect.4.1. This correction shifts the observed points parallel to the “photon-conservation” line that indicates equal amounts of absorption and re-emission in each panel. For the most part, the three direct detections have similar amounts of total emission, but their absorption equivalent widths span a larger range of values.The top panels of Fig. 8 show the Prochaska et al. (2011) model predictions for the UV1 multiplet. The majority of the models are isotropic with no dust extinction, and they follow the photon-conservation line. These models modify the gas density and velocity laws characterizing the outflow. The models that de-part from the photon-conservation line include dust extinction or geometry variations. The effects of dust and geometry are more noticeable for the FeII λ2600 transition than the FeII λ2586 tran-sition, because the Fe
ii
λ2600 transition is more likely to scatter resonantly multiple times (Fig. 5 ofTang et al. 2014), amplify-ing the effects of dust and geometry.To gain physical intuition for the impact of the individual properties, we now discuss how varying the outflow geome-try, dust extinction, and ISM component affects the total emis-sion and absorption budget. To identify the impact of a bi-conical outflow geometry, we compared the fiducial isotropic model (black outlined diamond in Fig. 8) with two bi-conical outflow models, where the wind fills an opening angle of, re-spectively, 80◦and 45◦(green outlined diamonds) along the line
of the sight to the galaxy. Collimating the outflow suppresses both the resonant and non-resonant emission, and for highly col-limated outflows, absorption dominates the profile. From these two bi-conical outflow models, a trend in how the total emission changes with the opening angle is not clear.
Comparing models that include dust in an isotropic outflow (red-orange outlined diamonds in Fig.8) to the fiducial model shows that dust extinction has a strong impact only on the to-tal emission. Increasing the amount of dust extinction moves the points nearly vertically off of the photon-conservation line, since more re-emitted photons can be absorbed by dust. Dust extinc-tion suppresses the resonant emission slightly more than the non-resonant emission.
Adapting the fiducial model to include an ISM component, that is, centralized gas that lacks a significant radial velocity, simply increases the amount of gas that can absorb and re-emit photons. The point representing this model (dark purple outlined diamond in Fig. 8) stays on the photon-conservation line, since neither the ISM component nor the wind compo-nent contains dust8. Adding the ISM component produces ab-sorption around zero systemic velocity and allows more photons to escape through non-resonant re-emission. The ISM compo-nent suppresses the resonant Fe
ii
emission, while boosting the non-resonant Feii
* emission, each by a factor of about four8 The Fe
ii
λ2586 panel does not have a point for the ISM model,be-cause no values are given for the resonant re-emission in Table 2 of
Prochaska et al.(2011).
compared to the fiducial model. Including an ISM component is essential to re-creating the observations from the galaxy ID#13.
Finally, Prochaska et al. (2011) include dust extinction (τdust = 1) in the ISM component, which again shifts the
point representing this model (magenta outlined diamond in Fig.8) nearly vertically from the photon-conservation line. Com-pared to the dusty wind-only model discussed earlier, this model suffers much more from dust extinction because the simple kine-matic structure of the ISM allows multiple scattering events. Although both the resonant and non-resonant emission lines diminish compared to the ISM model without dust, the ratio between the Fe
ii
* emission and Feii
emission still remains stronger than in the fiducial model. Adapting the ISM+dust model to match the total absorption from the galaxy ID#13 would be an interesting comparison.In summary, collimating a bi-conical outflow or increasing the amount of dust extinction both produce more absorption than emission, shifting the model predictions away from the photon conservation line. For dust extinction, the shift is nearly vertical, affecting primarily the total amount of emission. For a bi-conical outflow, the amount of absorption also increases, although more models would be beneficial to determine how emission varies with opening angle. An ISM component is essential to favor non-resonant emission, suppress resonant emission that creates Fe
ii
P-cygni profiles, and produce line profiles that are qualita-tively similar to observations.The observed galaxies with Fe
ii
* emission are all offset from the photon conservation line and also do not coincide with the model predictions. Model predictions for the UV2 and UV3 mul-tiplets would be useful to compare with the observations and confirm how physical effects impact the absorption and emis-sion equivalent widths. Models combining multiple physical ef-fects, such as the ISM+dust model for UV1, are necessary to re-produce the observations. For the HDFS galaxy ID#13, we suggest that a model combining a dusty ISM with a bi-conical outflow (motivated by our morphological and kinematic obser-vations) would be able to match the data for the HDFS galaxy ID#13. Such a model would address the isotropic outflow ge-ometry and Feii
P-cygni profiles that the observations do not support.7.2. Mass outflow rate estimation
To estimate the mass entrained in the outflow, we consider only the absorption components that are not affected by the ISM. Consequently, we exclude the component “C” at the sys-temic velocity (Fig.2, Table2). The other two components are blue-shifted by −660 km s−1(“A”) and −350 km s−1(“B”), re-spectively. The wind component “B” at −350 km s−1dominates the bulk of the mass flux given the equivalent width ratios be-tween components “A” and “B”. As discussed in Sect.4.1, the wind component ‘B’ is the least affected by emission infilling (at or below the 10% level), whereas the ISM component “C” is the most affected by emission infilling. Hence, emission infilling does not affect our estimate of the mass outflow rate from the wind component “B”.
Similar toRubin et al.(2014), we estimate the mass outflow rate from dM dt ≈ 1 M yr −1 Cf Nflow(H) 1020cm−2 Aflow 45 kpc2 v 300 km s−1 5 kpc D (1)
where Cfis the covering fraction of the outflowing gas, Nflow(H)
is the column density of hydrogen associated with the outflow, Aflowis the projected surface area of the outflow, v is the outflow
![Fig. 3. Fe ii * and [O ii ] emission peaks detected in the normalized 1D MUSE spectrum](https://thumb-eu.123doks.com/thumbv2/123doknet/14798808.605124/7.892.73.436.116.796/fig-fe-emission-peaks-detected-normalized-muse-spectrum.webp)
![Fig. 4. Left panels: Surface brightness maps of Fe ii * (top), stellar continuum (middle), and [O ii ] emission (bottom) from pseudo narrowband images (see text)](https://thumb-eu.123doks.com/thumbv2/123doknet/14798808.605124/8.892.77.823.119.1012/panels-surface-brightness-stellar-continuum-middle-emission-narrowband.webp)