HAL Id: hal-03207270
https://hal.archives-ouvertes.fr/hal-03207270
Submitted on 24 Apr 2021
HAL is a multi-disciplinary open access
archive for the deposit and dissemination of
sci-entific research documents, whether they are
pub-lished or not. The documents may come from
teaching and research institutions in France or
abroad, or from public or private research centers.
L’archive ouverte pluridisciplinaire HAL, est
destinée au dépôt et à la diffusion de documents
scientifiques de niveau recherche, publiés ou non,
émanant des établissements d’enseignement et de
recherche français ou étrangers, des laboratoires
publics ou privés.
Renewed methane increase for five years (2007–2011)
observed by solar FTIR spectrometry
R. Sussmann, F. Forster, M. Rettinger, P. Bousquet
To cite this version:
R. Sussmann, F. Forster, M. Rettinger, P. Bousquet. Renewed methane increase for five years (2007–
2011) observed by solar FTIR spectrometry. Atmospheric Chemistry and Physics, European
Geo-sciences Union, 2012, 12 (11), pp.4885-4891. �10.5194/acp-12-4885-2012�. �hal-03207270�
www.atmos-chem-phys.net/12/4885/2012/ doi:10.5194/acp-12-4885-2012
© Author(s) 2012. CC Attribution 3.0 License.
Chemistry
and Physics
Renewed methane increase for five years (2007–2011) observed by
solar FTIR spectrometry
R. Sussmann1, F. Forster1, M. Rettinger1, and P. Bousquet2,3
1Karlsruhe Institute of Technology, IMK-IFU, Garmisch-Partenkirchen, Germany
2Laboratoire des Sciences du Climat et de l’Environnement, IPSL-LSCE, CEA-CNRS-UVSQ, UMR8212 91191, France 3Universit´e de Versailles Saint Quentin en Yvelines, France
Correspondence to: R. Sussmann ([email protected])
Received: 11 October 2011 – Published in Atmos. Chem. Phys. Discuss.: 16 November 2011 Revised: 16 May 2012 – Accepted: 21 May 2012 – Published: 4 June 2012
Abstract. Trends of column-averaged methane for the time
period (1996, Sep 2011) are derived from the mid-infrared (mid-IR) solar FTIR time series at the Zugspitze (47.42◦N, 10.98◦E, 2964 m a.s.l.) and Garmisch (47.48◦N, 11.06◦E,
743 m a.s.l.). Trend analysis comprises a fit to the de-seasonalized time series along with bootstrap resampling for quantifying trend uncertainties. We find a positive trend dur-ing [1996, 1998] of 9.0 [3.2, 14.7] ppb yr−1 for Zugspitze (95 % confidence interval), an insignificant growth during [1999, mid 2006] of 0.8 [−0.1, 1.7] ppb yr−1 (Zugspitze), and a significant renewed increase during [mid 2006, Sep 2011] of 5.1 [4.2, 6.0] ppb yr−1 for Garmisch, which is in agreement with 4.8 [3.8, 5.9] ppb yr−1for Zugspitze.
The agreement of methane trends at the two closely neigh-boring FTIR sites Zugspitze and Garmisch within the un-certainties indicates a good station-to-station consistency as a basis for future trend analyses by the ground-based mid-IR FTmid-IR network on the global scale. Furthermore, the Zugspitze FTIR trend for the time interval [Jul 2006, Jun 2009] is found to agree with the trend derived from SCIA-MACHY (WFM-DOAS v2.0.2) data within the 95 % con-fidence intervals. In case a 1000-km pixel selection radius around the Zugspitze is used, the confidence interval is nar-rower for the FTIR trend (6.9 [4.2, 9.5] ppb yr−1) compared to SCIAMACHY (7.1 [5.1, 8.6] ppb yr−1). If, however, a loosened pixel selection is used (≈1000-km half-width lat-itudinal band), the SCIAMACHY trend significance interval is narrower (6.8 [5.1, 8.6] ppb yr−1) compared to Zugspitze FTIR (5.7 [3.0, 8.3] ppb yr−1).
While earlier studies using surface network data revealed changes of 8.0 ± 0.6 ppb in 2007, 6.4 ± 0.6 ppb in 2008, and
4.7 ± 0.6 ppb in 2009 (Dlugokencky et al., 2011), our up-dated result proves that the renewed methane increase mean-while has been persisting for >5 years [mid 2006, Sep 2011]. This is either the longest and largest positive trend anomaly since the beginning of systematic observations more than 25 years ago or the onset of a new period of strongly increasing CH4levels in the atmosphere. Several scenarios have been
developed to explain the persistent increase observed, mainly invoking an increase in emissions from natural wetlands, an increase in fossil fuel-related emissions or a decrease in OH concentrations. However, more work is needed to fully at-tribute this increase to a particular source or sink.
1 Introduction
The molecular symmetry of methane (CH4)allows for highly
active vibration-rotation excitation by infrared absorption. Carbon dioxide (CO2)is also infrared-active, however, its
strongest absorption lines are located outside the atmospheric window. These are basic reasons why methane is the second important anthropogenic greenhouse gas in spite of its still relatively small abundance in the atmosphere.
Methane concentrations in the atmosphere have more than doubled since the beginning of industrialization (Forster et al., 2007). After a period of near-zero growth at the begin-ning of this century (Dlugokencky et al., 2003; Bousquet et al., 2006), the growth rate of atmospheric methane started to increase strongly again after 2006 (Rigby et al., 2008; Dlu-gokencky et al., 2009). The attribution of this increase to a particular source or sink is still debated in the scientific
4886 R. Sussmann et al.: Renewed methane increase for five years
community (Rigby et al., 2008; Dlugokencky et al., 2009; EDGAR, 2012; Bloom et al., 2010; Ringeval et al., 2010; Aydin et al., 2011; Bousquet et al., 2011; Spahni et al., 2011). The finding of an atmospheric increase since 2007 is based on highly precise measurements (≈0.2 %) of the methane mixing ratio by atmospheric networks at the surface and in the planetary boundary layer (WMO, 2012). Satellite re-trievals (Crevoisier et al., 2009; Frankenberg et al., 2011; Schneising et al., 2011, 2012) complement these surface ob-servations with a higher spatial coverage, but at the cost of lower precisions (≈2 %). Several studies have focused on how column observations can complement surface networks and help further reduce uncertainties associated with sources and sinks in atmospheric inversions (e.g., Olsen and Ran-derson, 2004 or Bergamaschi et al., 2009, and references therein). Columnar methane retrieved from ground-based Fourier-transform-infrared (FTIR) spectrometry in the mid-infrared (mid-IR) provides a column view of atmospheric methane at a high precision close to that attainable by sur-face networks (≈0.3 %, Sussmann et al., 2011). Hence such ground-based observations are very useful to document at-mospheric methane changes. In this paper, we investigate the persistence of the 2007–2008 anomaly by an updated trend analysis including FTIR data until today (fall 2011) and re-port possible causes of the increase observed.
After describing the mid-IR sounding technique (Sect. 2), methane time series and trends will be presented in Sect. 3.1, and the trends from the neighboring sites of Zugspitze and Garmisch will be compared to each other as well as to SCIAMACHY trends derived with the same analysis method (Sect. 3.2). Section 4 will provide a discussion of the trend behavior derived for the 2007–2011 time period along with some conclusions.
2 Sounding technique
Time series of column-averaged dry-air mole fractions of methane (XCH4) were retrieved from long-term FTIR
so-lar absorption measurements at two northern mid-latitude sites, namely, the Zugspitze high-altitude site (47.42◦N, 10.98◦E, 2964 m a.s.l.) and Garmisch (47.48◦N, 11.06◦E, 743 m a.s.l.). The two sites are located only a few kilometers apart in horizontal distance. However, the levels of integrated water vapor differ strongly (min/max = 0.2 mm/12.7 mm for Zugspitze, 1.9 mm/34.9 mm for Garmisch) because of the al-titude difference.
The Zugspitze FTIR system has been conducting continu-ous measurements since 1995 as part of the Network for the Detection of Atmospheric Composition Change (NDACC, http://www.ndacc.org). It is operated by the Group “Variabil-ity and Trends” of IMK-IFU1, Karlsruhe Institute of
Tech-1Institute of Meteorology and Climate Research – Atmospheric
Environmental Research, http://www.imk-ifu.kit.edu/atmospheric variability.php
nology, at the Zugspitze2. The FTIR system is based on a Bruker IFS125HR interferometer; details can be found in Sussmann and Sch¨afer (1997). The interferograms for the methane retrievals were recorded with an InSb detec-tor using an optical path difference of typically 175 cm. 6 scans were averaged (≈7-min integration time). The pressure-temperature profiles necessary for the inversion were taken from the National Center for Environmental Pre-diction (NCEP) automailer. The Garmisch solar FTIR sys-tem was set up in 2004 at the Garmisch site3 and is part of the Total Carbon Column Observing Network (TCCON, http://www.tccon.caltech.edu/) operating in the near-infrared for high-precision retrieval of column-averaged mixing ra-tios of carbon dioxide and methane. The system performs mid-IR NDACC-type measurements in parallel (in alternat-ing mode on the time scale of several minutes). The latter are utilized for this study. The measurement settings for the Garmisch mid-IR methane measurements are the same as for the Zugspitze.
Retrievals of columnar methane from ground-based FTIR spectrometry in the mid-IR were used previously for trend studies (Zander et al., 1989; Angelbratt et al., 2011) and satellite validation (e.g., Sussmann et al., 2005). However, it became obvious only recently that the methane-column re-trievals at high-humidity (low-altitude) sites may be domi-nated by water vapor (H2O/HDO)-CH4 interference errors
of up to 5 % (Sussmann et al., 2011). Consequently, ar-tifacts dominated the seasonal cycle of methane retrieved with the standard NDACC retrieval strategy. Dry (high-altitude) sites were not affected. Note that water vapor in-terference also perturbed methane retrievals from SCIA-MACHY (Frankenberg et al., 2008). A general formulation of the (water vapor) interference problem was given before (Sussmann and Borsdorff, 2007) and water vapor can be quantified by the FTIR technique itself (e.g., Sussmann et al., 2009). To improve the standard methane retrieval strat-egy used within NDACC, we recently developed a new re-trieval strategy (MIR-GBM v1.0) using systematically se-lected spectral micro windows and spectroscopic parame-ters (Sussmann et al., 2011). MIR-GBM v1.0 was shown to eliminate H2O/HDO-CH4interference errors down to the
≈0.1 % level (i.e., 0.14 % for the wettest test site and 0.10 % and 0.02 %, respectively, for the two dryer test sites). For the first time, a good agreement of the retrieved northern-hemisphere seasonal cycle with SCIAMACHY results was achieved (Sussmann et al., 2011).
In this paper we apply MIR-GBM v1.0 to a trend analy-sis. The basic features of this retrieval strategy are given in Table 1, more details can be found in Sussmann et al. (2011).
2Zugspitze site details can be found at http://www.imk-ifu.kit.
edu/311.php
3Garmisch site details can be found at http://www.imk-ifu.kit.
edu/315.php
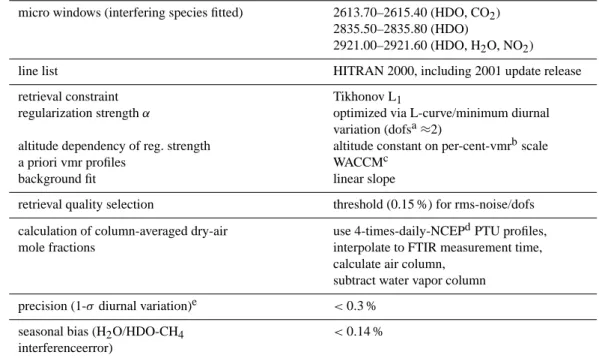
Table 1. Characteristics of the strategy for retrieval of column-averaged methane from mid-IR solar spectra (MIR-GBM v1.0). For more
details, see Sussmann et al. (2011).
micro windows (interfering species fitted) 2613.70–2615.40 (HDO, CO2)
2835.50–2835.80 (HDO)
2921.00–2921.60 (HDO, H2O, NO2)
line list HITRAN 2000, including 2001 update release retrieval constraint
regularization strength α
altitude dependency of reg. strength a priori vmr profiles
background fit
Tikhonov L1
optimized via L-curve/minimum diurnal variation (dofsa≈2)
altitude constant on per-cent-vmrbscale WACCMc
linear slope
retrieval quality selection threshold (0.15 %) for rms-noise/dofs calculation of column-averaged dry-air
mole fractions
use 4-times-daily-NCEPdPTU profiles, interpolate to FTIR measurement time, calculate air column,
subtract water vapor column precision (1-σ diurnal variation)e <0.3 %
seasonal bias (H2O/HDO-CH4
interferenceerror)
<0.14 %
adofs – degrees of f reedom f or signal bvmr – volume mixing ratio
cWACCM – Whole Atmosphere Chemistry Climate Model dNCEP – National Center for Environmental Prediction efor 7-min integration
3 Trend results
3.1 Time series and trend analysis
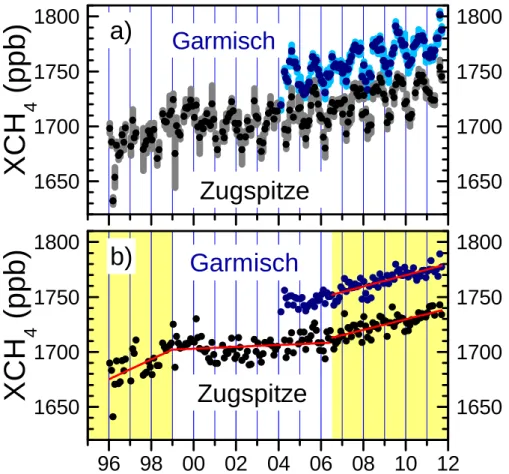
Figure 1a shows the time series of monthly-mean column-averaged methane above Zugspitze and Garmisch. Typically,
n =40–60 individual column measurements per month are recorded on 6–8 clear sky days. Shaded bars in Fig.1a indi-cate the statistical uncertainties of the monthly means cal-culated from the individual measurements (±3σ /sqrt(n)). These suggest that statistically stable monthly means are ob-tained for the trend analysis.
The de-seasonalized time series (Fig. 1b) shows a signifi-cant increase during the 3-years’ time interval [1996, 1998], followed by a period with no significant growth [1999, mid 2006]. Afterwards, a renewed strong increase can be ob-served, which has been persisting for 5 years now [mid 2006, Sep 2011]. The division into 3 time periods is in agree-ment with dedicated trend change points defined and used for methane in earlier work (Dlugokencky et al., 2003, 2009; Angelbratt et al., 2011). Our trend analysis is based on the approach described in Gardiner et al. (2008). See Table 2 for the resulting figures. Briefly, the approach augments a ba-sic linear trend model applied to the indicated parts of the time series after subtraction of a fitted intra-annual function and uses least squares regression in conjunction with a
boot-strap resampling of the residuals in order to determine con-fidence limits associated with the trend estimates. For the intra-annual model, a 3rd-order Fourier series is used.
As a main result from Table 2, the original anomaly of the period [mid 2006, 2008] with a Zugspitze trend of 6.6 [3.5, 9.8] ppb yr−1 and a Garmisch trend of 5.1 [2.0, 8.3] ppby yr−1) is found to persist also over the extended period [mid 2006, Sep 2011] investigated now (Zugspitze trend 4.8 [3.8, 5.9] ppb yr−1, Garmisch trend 5.1 [4.2, 6.0] ppb yr−1).
3.2 Station-to-station consistency and comparison to SCIAMACHY trends
The FTIR trends retrieved for the neighboring sites of Zugspitze and Garmisch (Table 2) are in very good agreement: For the [mid 2006–2008] period, a trend of 6.6 ppb yr−1 with a 95 % confidence interval of [3.5,
9.8] ppb yr−1 is found above Zugspitze, which agrees with 5.1 [2.0, 8.3] ppb yr−1 retrieved from Garmisch measure-ments for the same period. For the [mid 2006–Sep 2011] pe-riod, the trend of 4.8 [3.8, 5.9] ppb yr−1 above Zugspitze is close to the Garmisch trend of 5.1 [4.2, 6.0] ppb yr−1. These numbers indicate a very good station-to-station consistency of the ground-based FTIR trend results.
4888 R. Sussmann et al.: Renewed methane increase for five years
Table 2. Existence and significance of trends of column-averaged mole fractions of CH4.
trend uncertainty significant (ppb yr−1) interval non-zero trend?
[2.5th percentile, (95 % confidence) 97.5th percentile]a (ppb yr−1) Zugspitze FTIR [1996, 1998] 9.0 [3.2, 14.7] yes [1999, mid 2006] 0.8 [−0.1, 1.7] no [mid 2006, 2008] 6.6 [3.5, 9.8] yes
[mid 2006, Sep 2011] 4.8 [3.8, 5.9] yes
Garmisch FTIR
[mid 2006, 2008] 5.1 [2.0, 8.3] yes
[mid 2006, Sep 2011] 5.1 [4.2, 6.0] yes
SCIAMACHYb
(1000 km radius around [Jul 2006, Jun 2009], 7.1 [3.7, 10.4] yes
Zugspitze) 23 months available (missing months Nov–Feb 2007, Nov–Feb 2008, Oct–Feb 2009)
Zugspitze FTIR same 23 months as 6.9 [4.2, 9.5] yes
SCIAMACHY SCIAMACHY
(38.5◦N–56.5◦N) [Jul 2006, Jun 2009], 6.8 [5.1, 8.6) yes
i.e., 36 months
Zugspitze FTIR all 36 months as 5.7 [3.0, 8.3] yes
SCIAMACHY
aunderlying uncertainty distributions based on 5000 bootstrap resamplings for each trend bWFM-DOAS version 2.0.2
The trend of 6.6 [3.5, 9.8] ppb yr−1 derived from our Zugspitze time series for the period [mid 2006, 2008] agrees qualitatively with earlier studies using in-situ data for both hemispheres, according to which the growth rate of atmospheric methane started to increase after 2006 with changes of 8.0 ± 0.6 ppb in 2007, 6.4 ± 0.6 ppb in 2008, and 4.7 ± 0.6 ppb in 2009 (Dlugokencky et al., 2011).
For a quantitative validation of the FTIR trend results, a dedicated intercomparison with SCIAMACHY retrievals of column-averaged mole fractions using the WFM-DOAS al-gorithm version 2.02 (Schneising et al., 2011) was made, see Table 2. The trend intercomparison was performed for the time interval [Jul 2006, Jun 2009]. For a 1000-km pixel selection radius around the Zugspitze, the SCIAMACHY XCH4 data available cover 23 months (typically, the
fall-winter months November to February are missing). For these SCIAMACHY data, the trend and its 95 % confidence in-terval were analyzed with the same (bootstrap) technique as described for the FTIR trend analysis above. The result-ing SCIAMACHY trend is 7.1 [3.7, 10.4] ppb yr−1, see Ta-ble 2. For the same 23 months, an FTIR trend of 6.9 [4.2, 9.5] ppb yr−1is obtained. Both trends agree within the error
bars. The FTIR uncertainty interval is narrower than that of SCIAMACHY.
Using a full latitudinal band of ≈1000 km half-width cen-tered around the Zugspitze latitude (i.e., covering 38.5◦N– 56.5◦N), we obtained a SCIAMACHY trend of 6.8 [5.1, 8.6] ppb yr−1 (Table 2). Note that due to the loosened
spa-tial selection (full latitudinal band), SCIAMACHY retrievals become available for all 36 months of the 3-years’ time in-terval. For the same 36 months, we derived an FTIR trend above the Zugspitze of 5.7 [3.0, 8.3] ppb yr−1 which again agrees to the SCIAMACHY trend. As more SCIAMACHY data are applied in the trend analysis in this case, the SCIA-MACHY confidence interval is narrower than the FTIR con-fidence (Table 2). Overall, the XCH4 trends derived from
ground-based FTIR and SCIAMACHY are in good agree-ment.
4 Discussion and conclusion
The methane increase persisting for 5 years [mid 2006, Sep 2011] as documented in Fig. 1 and Table 2 is either the
9 6
9 8
0 0
0 2
0 4
0 6
0 8
1 0
1 2
1 6 5 0
1 7 0 0
1 7 5 0
1 8 0 0
1 6 5 0
1 7 0 0
1 7 5 0
1 8 0 0
1 6 5 0
1 7 0 0
1 7 5 0
1 8 0 0
1 6 5 0
1 7 0 0
1 7 5 0
1 8 0 0
G a r m i s c h
b )
X
C
H
4
(
p
p
b
)
X
C
H
4
(
p
p
b
)
a )
G a r m i s c h
Z u g s p i t z e
Z u g s p i t z e
Fig. 1. (a) Time series of methane column-averaged mole fractions above Zugspitze and Garmisch (monthly means). Shaded bars indicate
the statistical error of the monthly means calculated from the individual measurements (±3 σ /sqrt(n)), where n is the number of FTIR measurements per month. (b) De-seasonalized time series and linear trends (red lines). See Table 2 for trend magnitudes and significance.
longest and largest positive trend anomaly since the begin-ning of systematic observations more than 25 years ago or marks the onset of a new period of strongly increasing CH4
levels in the atmosphere. Our study cannot identify the mech-anisms behind this increase, but our findings shall be dis-cussed briefly in relation to previous studies on this subject and most reasonable causes shall be proposed.
Previous studies discussed possible causes of the increase in the years 2007 and 2008 (Rigby et al., 2008; Duglokencky et al., 2009; Bloom et al., 2010; van der Werf et al., 2010; Bousquet et al., 2011; Frankenberg et al., 2011; Spahni et al., 2011; Montzka et al., 2011). On the source side, a pos-itive anomaly of CH4 emissions from natural wetlands in
2007–2008 is suggested to be the cause by several authors (Duglokencky et al., 2009; Bloom et al., 2010; Bousquet et al., 2011), with the contribution from boreal regions in 2007 being estimated to amount about 25 % (Bousquet et al., 2011). Indeed, Siberia experienced high abnormally pos-itive temperatures in autumn (+4◦C compared to the 1961–
1990 mean, National Climatic Data Center, Dlugokencky et al., 2009). The remaining 75 % are mostly attributed to tropi-cal natural wetlands. Tropitropi-cal areas which include large
wet-land surface areas on a global scale experienced the 3rd-largest (2007) and the 3rd-largest (2008) positive precipitation anomalies from 1986 to 2008 (Schneider et al., 2008; Dlu-gokencky et al., 2009).These findings are supported by the emission increase computed by two process-based models for natural wetlands (Ringeval et al., 2011; Spahni et al., 2011) because of tropical precipitation changes associated with the La Ni˜na event in these years and because of bo-real positive temperature anomalies in 2007. These findings are also consistent with processes relating to hydrology be-ing the dominant driver of wetland CH4 emissions in the
tropics, whereas temperature is more important at high lat-itudes (Walter et al., 2001; Ringeval et al., 2010). Accord-ing to economic statistics, the EDGAR inventory for anthro-pogenic emissions (EDGAR, 2012) reveals a large increase of fossil fuel emissions after 2000, mainly due to Asian re-gions, of +6–7 Tg yr−1. This finding is supported neither by a recent atmospheric inversion (Bousquet et al., 2011) nor by a study based on ethane trends (Aydin et al., 2011). In addition, the biomass burning contribution is insignificant, because no large CO anomaly is observed in 2007–2008 (van der Werf et al., 2010).
4890 R. Sussmann et al.: Renewed methane increase for five years
On the sink side, Rigby et al. (2008) and Montzka et al. (2011) find a generally declining OH concentration be-tween 2004 and 2007, which might have contributed to the enhanced CH4 in the atmosphere. However, the large,
al-though uncertain, 4 ± 14 % drop between 2006 and 2007 in-ferred by Rigby is much larger than the small drop found by Montzka using several modeling approaches (∼1 %/yr). Small inter-annual variability of OH concentrations is in bet-ter agreement with the results of most climate chemistry models which largely buffer OH changes (Dentener et al., 2003). Having in mind that methane loss by OH radicals is proportional to the product of OH concentrations by the CH4mixing ratio, even a decrease of OH concentration does
not guarantee a decreased loss of methane by OH radicals. CH4has increased by about 0.3 %/yr since 2007, which may,
at least partly, compensate the impact of the potentially de-creasing OH concentrations on CH4mixing ratios.
Attribution of the persistent increase to a particular source or sink after 2009 still is under investigation. On the one hand, a persisting natural wetland anomaly over more than a few years may be in conflict with the understanding that wet-land emissions typically cause inter-annual variability (i.e., 1–2 yr time scale), except for long-term precipitation or tem-perature anomalies. On the other hand, more gradual changes on the time scale of several years would be explained more consistently by changing anthropogenic emissions.
Finally, no evidence of strongly increased emissions from stores of carbon in melting permafrost and from marine hy-drates as a reaction to climate change can be found today from atmospheric observations. However, both will remain potential sources of severely increasing methane emissions in the future, which should be monitored closely by remote sensing at the surface or from space.
Acknowledgements. We thank H. P. Schmid (IMK-IFU) for his
continuous interest in this work. It is a pleasure to acknowledge valuable input from both anonymous referees which helped to significantly improve the paper. The authors are indebted to O. Schneising and J. P. Burrows (IEP Bremen) for providing SCIAMACHY data. Earlier studies which contributed to this paper were funded by the EC within the HYMN project (contract 037048). We acknowledge support by the ESA GHG-cci project under a subcontract with the University of Bremen as well as by the Deutsche Forschungsgemeinschaft and Open Access Publishing Fund of Karlsruhe Institute of Technology.
Edited by: I. Aben
References
Angelbratt, J., Mellqvist, J., Blumenstock, T., Borsdorff, T., Bro-hede, S., Duchatelet, P., Forster, F., Hase, F., Mahieu, E., Murtagh, D., Petersen, A. K., Schneider, M., Sussmann, R., and Urban, J.: A new method to detect long term trends of methane (CH4) and nitrous oxide (N2O) total columns measured within
the NDACC ground-based high resolution solar FTIR network, Atmos. Chem. Phys., 11, 6167–6183, doi:10.5194/acp-11-6167-2011, 2011.
Aydin, M., Verhulst, K. R., Saltzman, E. S., Battle, M. O., Montzka, S. A., Blake, D. R., Tang, Q., and Prather, M. J.: Recent decreases in fossil-fuel emissions of ethane and methane derived from firn air, Nature, 476, 198–201, 2011.
Bergamaschi, P, Frankenberg, C., Meirink, J.F., Krol, M, Vil-lani, M. G., Houweling, S., Dentener, F., Dlugokencky, E.J., Miller, J.B., Gatti, L.V., Engel, A., and Levin, I.: Inverse modeling of global and regional CH4 emissions using SCIA-MACHY satellite retrievals, J. Geophys. Res., 114, D22301, doi:10.1029/2009JD012287, 2009.
Bloom, A. A., Palmer, P. I., Fraser, A., Reay, D. S., and Franken-berg, C.: Large-Scale Controls of Methanogenesis Inferred from Methane and Gravity Spaceborne Data, Science, 327, 322–325, doi:10.1126/science.1175176, 2010.
Bousquet, P., Ciais, P., Miller, J. B., Dlugokencky, E. J., Hauglus-taine, D. A., Prigent, C., Van der Werf, G. R., Peylin, P., Brunke, E. G., Carouge, C., Langenfels, R. L., Lathiere, J., Papa, F., Ra-monet, M., Schmidt, M., Steele, L. P., Tyler, S. C., and White, J.: Contribution of anthropogenic and natural sources to atmo-spheric methane variability, Nature, 443, 439–443, 2006. Bousquet, P., Ringeval, B., Pison, I., Dlugokencky, E. J., Brunke,
E.-G., Carouge, C., Chevallier, F., Fortems-Cheiney, A., Franken-berg, C., Hauglustaine, D. A., Krummel, P. B., Langenfelds, R. L., Ramonet, M., Schmidt, M., Steele, L. P., Szopa, S., Yver, C., Viovy, N., and Ciais, P.: Source attribution of the changes in atmospheric methane for 2006–2008, Atmos. Chem. Phys., 11, 3689-3700, doi:10.5194/acp-11-3689-2011, 2011.
Crevoisier, C., Nobileau, D., Fiore, A. M., Armante, R., Ch´edin, A., and Scott, N. A.: Tropospheric methane in the tropics – first year from IASI hyperspectral infrared observations, Atmos. Chem. Phys., 9, 6337–6350, doi:10.5194/acp-9-6337-2009, 2009. Dentener, F., Peters, W., Krol, M., van Weele, M., Bergamaschi, P.,
and Lelieveld, J.: Inter-annual variability and trend of CH4
life-time as a measure for OH changes in the 1979–1993 life-time period, J. Geophys. Res.-A, 108, 4442, doi:10.1029/2002JD002916, 2003.
Dlugokencky, E. J., Houweling, S., Bruhwiler, L., Masarie, K. A., Lang, P. M., Miller, J. B., and Tans, P. P.: Atmospheric methane levels off: Temporary pause or a new steady-state?, Geophys. Res. Lett., 30, 1992, doi:10.1029/2003GL018126, 2003. Dlugokencky, E. J., Bruhwiler, L., White, J. W. C., Emmons, L.
K., Novelli, P. C., Montzka, S. A., Masarie, K. A., Lang, P. M., Crotwell, A. M., Miller, J. B., and Gatti, L. V.: Observational constraints on recent increases in the atmospheric CH4burden,
Geophys. Res. Lett., 36, L18803, doi:10.1029/2009GL039780, 2009.
Dlugokencky, E. J., Nisbet, E. G., Fisher, R., and Lowry, D.: Global atmospheric methane: budget, changes and dangers, Phil. Trans. R. Soc. A, 369, 2058–2072, doi:10.1098/rsta.2010.0341, 2011.
EDGAR4 database: Emission Database for Global Atmospheric Research (EDGAR), release version 4.2, http://edgar.jrc.ec. europa.eu, European Commission, Joint Research Centre (JRC)/Netherlands Environmental Assessment Agency (PBL), 2012.
Forster, P., Ramaswamy, V., Artaxo, P., Berntsen, T., Betts, R., Fa-hey, D., Haywood, J., Lean, J., Lowe, D., Myhre, G., Nganga, J., R. Prinn, G. Raga, M. S., and Dorland, R. V.: Changes in Atmo-spheric Constituents and in Radiative Forcing, Climate Change 2007: The Physical Science Basis. Contribution of Working Group I to the Fourth Assessment Report of the Intergovernmen-tal Panel on Climate Change (IPCC), 2007.
Frankenberg, C, Bergamaschi, P., Butz, A., Houweling, S., Meirink, J.F., Notholt, J., Petersen, A.K., Schrijver, H., Warneke, T., and Aben, I.: Tropical methane emissions: A revised view from SCIAMACHY onboard ENVISAT, Geophys. Res. Lett., 35, L15811, doi:10.1029/2008GL034300, 2008.
Frankenberg, C., Aben, I., Bergamaschi, P., Dlugokencky, E.J., van Hees, R., Houweling, S., van der Meer, P., Snel, R., and Tol, P.: Global column-averaged methane mixing ratios from 2003 to 2009 as derived from SCIAMACHY: Trends and variability, J. Geophys. Res., 116, D04302, doi:10.1029/2010JD014849, 2011. Gardiner, T., Forbes, A., de Mazi`ere, M., Vigouroux, C., Mahieu, E., Demoulin, P., Velazco, V., Notholt, J., Blumenstock, T., Hase, F., Kramer, I., Sussmann, R., Stremme, W., Mellqvist, J., Strand-berg, A., Ellingsen, K., and Gauss, M.: Trend analysis of green-house gases over Europe measured by a network of ground-based remote FTIR instruments, Atmos. Chem. Phys., 8, 6719–6727, doi:10.5194/acp-8-6719-2008, 2008.
Montzka, S. A., Krol, M., Dlugokencky, E., Hall, B., Jockel, P., and Lelieveld, J.: Small Interannual Variability of Global Atmospheric Hydroxyl, Science, 331, 67–69, doi:10.1126/science.1197640, 2011.
Olsen, S. C. and Randerson, J. T.: Differences between sur-face and column atmospheric CO2 and implications for car-bon cycle research, J. Geophys. Res., 109, D02301, 2004, doi:10.1029/2003JD003968.
Rigby, M., Prinn, R. G., Fraser, P. J. Simmonds, P. G., Langen-felds, R. L., Huang, J., Cunnold, D. M., Steele, L. P., Krum-mel, P. B., Weiss, R. F., O’Doherty, S., Salameh, P. K., Wang, H. J., Harth, C. M., M¨uhle, J., and Porter, L. W.: Renewed growth of atmospheric methane, Geophys. Res. Lett., 35, L22805, doi:10.1029/2008GL036037, 2008.
Ringeval, B., de Noblet-Ducoudre, N., Ciais, P., Bousquet, P., Pri-gent, C., Papa, F., and Rossow, W. B.: An attempt to quantify the impact of changes in wetland extent on methane emissions on the seasonal and interannual time scales, Global Biogeochem. Cy., 24, Gb2003, doi:10.1029/2008GB003354, 2010.
Schneider, U., Fuchs, T., Meyer-Christoffer, A., and Rudolf, B.: Global precipitation analysis products of the GPCC, Global Pre-cip. Climatol. Cent., Dtsch. Wetterdienst, Offenbach am Main, Germany, 2008.
Schneising, O., Buchwitz, M., Reuter, M., Heymann, J., Bovens-mann, H., and Burrows, J. P.: Long-term analysis of car-bon dioxide and methane column-averaged mole fractions re-trieved from SCIAMACHY, Atmos. Chem. Phys., 11, 2863– 2880, doi:10.5194/acp-11-2863-2011, 2011.
Schneising, O., Bergamaschi, P., Bovensmann, H., Buchwitz, M., Burrows, J. P., Deutscher, N. M., Griffith, D. W. T., Heymann, J., Macatangay, R., Messerschmidt, J., Notholt, J., Rettinger, M., Reuter, M., Sussmann, R., Velazco, V. A., Warneke, T., Wennberg, P. O., and Wunch, D.: Atmospheric greenhouse gases retrieved from SCIAMACHY: comparison to ground-based FTS measurements and model results, Atmos. Chem. Phys., 12, 1527–1540, doi:10.5194/acp-12-1527-2012, 2012.
Spahni, R., Wania, R., Neef, L., van Weele, M., Pison, I., Bousquet, P., Frankenberg, C., Foster, P.N., Joos, F., Prentice, I.C., and van Velthoven, P.: Constraining global methane emissions and uptake by ecosystems, Biogeosciences, 8., 643–1665, 2011.
Sussmann, R. and Borsdorff, T.: Technical Note: Interference errors in infrared remote sounding of the atmosphere, Atmos. Chem. Phys., 7, 3537–3557, doi:10.5194/acp-7-3537-2007, 2007. Sussmann, R. and Sch¨afer, K.: Infrared spectroscopy of
tropo-spheric trace gases: combined analysis of horizontal and vertical column abundances, Appl. Opt., 36, 735–741, 1997.
Sussmann, R., Stremme, W., Buchwitz, M., and de Beek, R.: Val-idation of ENVISAT/SCIAMACHY columnar methane by solar FTIR spectrometry at the Ground-Truthing Station Zugspitze, Atmos. Chem. Phys., 5, 2419–2429, doi:10.5194/acp-5-2419-2005, 2005.
Sussmann, R., Borsdorff, T., Rettinger, M., Camy-Peyret, C., De-moulin, P., Duchatelet, P., Mahieu, E., and Servais, C.: Technical Note: Harmonized retrieval of column-integrated atmospheric water vapor from the FTIR network – first examples for long-term records and station trends, Atmos. Chem. Phys., 9, 8987– 8999, doi:10.5194/acp-9-8987-2009, 2009.
Sussmann, R., Forster, F., Rettinger, M., and Jones, N.: Strategy for high-accuracy-and-precision retrieval of atmospheric methane from the mid-infrared FTIR network, Atmos. Meas. Tech., 4, 1943–1964, doi:10.5194/amt-4-1943-2011, 2011.
van der Werf, G. R., Randerson, J. T., Giglio, L., Collatz, G. J., Mu, M., Kasibhatla, P. S., Morton, D. C., DeFries, R. S., Jin, Y., and van Leeuwen, T. T.: Global fire emissions and the contribution of deforestation, savanna, forest, agricultural, and peat fires (1997– 2009), Atmos. Chem. Phys., 10, 11707–11735, doi:10.5194/acp-10-11707-2010, 2010.
Walter, B. P., Heimann, M., and Matthews, E.: Modeling mod-ern methane emissions from natural wetlands: 2. Interannual variations 1982–1993, J. Geophys. Res., 106, 34207–34219, doi:10.1029/2001JD900164, 2001.
WMO World Data Centre for Greenhouse Gases: http://ds.data.jma. go.jp/gmd/wdcgg/introduction.html, last access: 31 March 2012, 2012.
Zander, R., Demoulin, Ph., Ehhalt, D. H., and Schmidt, U.: Secular Increase of the Vertical Column Abundance of Methane Derived from IR Solar Spectra Recorded at the Jungfraujoch Station, J. Geophys. Res., 94, 11029–11039, 1989.