HAL Id: hal-00296381
https://hal.archives-ouvertes.fr/hal-00296381
Submitted on 22 Nov 2007
HAL is a multi-disciplinary open access
archive for the deposit and dissemination of
sci-entific research documents, whether they are
pub-lished or not. The documents may come from
teaching and research institutions in France or
abroad, or from public or private research centers.
L’archive ouverte pluridisciplinaire HAL, est
destinée au dépôt et à la diffusion de documents
scientifiques de niveau recherche, publiés ou non,
émanant des établissements d’enseignement et de
recherche français ou étrangers, des laboratoires
publics ou privés.
Effects of total solar eclipse of 29 March 2006 on surface
radiation
S. Kazadzis, A. Bais, M. Blumthaler, A. Webb, N. Kouremeti, R. Kift, B.
Schallhart, A. Kazantzidis
To cite this version:
S. Kazadzis, A. Bais, M. Blumthaler, A. Webb, N. Kouremeti, et al.. Effects of total solar eclipse of 29
March 2006 on surface radiation. Atmospheric Chemistry and Physics, European Geosciences Union,
2007, 7 (22), pp.5775-5783. �hal-00296381�
www.atmos-chem-phys.net/7/5775/2007/ © Author(s) 2007. This work is licensed under a Creative Commons License.
Atmospheric
Chemistry
and Physics
Effects of total solar eclipse of 29 March 2006 on surface radiation
S. Kazadzis1, A. Bais1, M. Blumthaler2, A. Webb3, N. Kouremeti1, R. Kift3, B. Schallhart2, and A. Kazantzidis1
1Laboratory of Atmospheric Physics, Aristotle University of Thessaloniki, Greece
2Division of Biomedical Physics, Innsbruck Medical University, Austria
3School of Earth Atmospheric and Environmental Sciences, University of Manchester, UK
Received: 1 June 2007 – Published in Atmos. Chem. Phys. Discuss.: 29 June 2007 Revised: 24 October 2007 – Accepted: 1 November 2007 – Published: 22 November 2007
Abstract. Solar irradiance spectral measurements were per-formed during a total solar eclipse. The spectral effect of the limb darkening to the global, direct irradiance and ac-tinic flux measurements was investigated. This effect leads to wavelength dependent changes in the measured solar spectra showing a much more pronounced decrease in the radiation at the lower wavelengths. Radiative transfer model results were used for the computation of a correction for the total ozone measurements due to the limb darkening. This cor-rection was found too small to explain the large decrease in total ozone column derived from the standard Brewer mea-surements, which is an artifact in the measured irradiance due to the increasing contribution of diffuse radiation against the decreasing direct irradiance caused by the eclipse. Cal-culations of the Extraterrestrial spectrum and the effective sun’s temperatures, as measured from ground based direct irradiance measurements, showed an artificial change in the calculations of both quantities due to the fact that radiation coming from the visible part of the sun during the eclipse phases differs from the black body radiation described by the Planck’s law.
1 Introduction
On 29 March 2006 a total solar eclipse was visible along a narrow corridor which traversed half the Earth, starting in Brazil, extending across the Atlantic, through North Africa, and central Asia and ending in northern Mongolia. The um-bra traversed the Mediterranean passing directly over the Greek island of Kastelorizo (36.150◦N, 29.596◦E).
The spectral behaviour of solar radiation reaching the earth’s surface during the course of a solar eclipse can be studied either with ground based (GB) measurements or with Correspondence to: S. Kazadzis
the use of radiative transfer model (RTM) calculations to measure or simulate different radiation quantities. During an eclipse, as the disk of the moon moves across the sun its cov-erage of the limb and centre of the sun varies. Thus, “limb darkening” (LD) becomes relevant and needs to be taken into account. Measurements of radiative quantities (Beletsky et al., 1998; Jerlov et al., 1954; Sharp et al., 1971) and model calculations (K¨opke et al., 2001) have been performed during various eclipse events.
There are only a few studies (Fernandez et al., 1993; Mikhalev et al., 1999) that present the eclipse-induced changes in the spectral solar UV irradiance at the earth’s surface, and even fewer measurements of the extraterres-trial (ET) spectrum at UV wavelengths, exist (Show et al., 1978; Greve and Neckel, 1996; K¨opke et al., 2001; Emde and Mayer, 2007).
Several earlier studies have examined possible effects of a solar eclipse on the ozone column (Bojkov, 1968; Chakrabarty et al., 1997; Jerlov et al., 1954; Svensson, 1958; Zerefos et al., 2001). Ozone observations with Brewer and Dobson instruments have shown a decrease in ozone during the maximum phase of the eclipse. Other studies, however, in which other instruments were used for the determination of total ozone, have shown different results as to the sign and the magnitude of total ozone changes. Bojkov (1968) re-ported results from Dobson spectrophotometric observations during the solar eclipse of May 1966 and concluded that an increase of 14 Dobson units (DU) was observed at the max-imum phase of the eclipse. In that paper a review of total ozone measurements during a solar eclipse was presented, and it was emphasized that similar results were also reported in other studies based on Dobson ozone observations (Svens-son, 1958; Stranz, 1961).
In this study we investigate the effect of the solar eclipse on measurements of several radiation quantities during a
two-day campaign at Kastelorizo. Such quantities are:
5776 S. Kazadzis et al.: Effects of total solar eclipse of 29 March 2006 on surface radiation
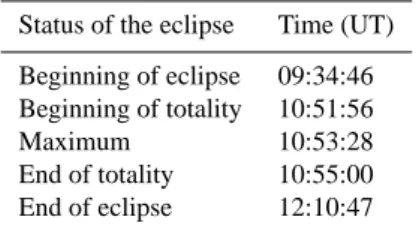
Table 1. Data of the eclipse timing at Kastelorizo.
Status of the eclipse Time (UT) Beginning of eclipse 09:34:46 Beginning of totality 10:51:56 Maximum 10:53:28 End of totality 10:55:00 End of eclipse 12:10:47
a horizontal surface, the direct irradiance (DI), which rep-resents the direct sun irradiance component and actinic flux (AF), which represents the radiation measured by a spherical surface. Also, total column ozone was derived using the DI spectral measurements at selected wavelengths. In addition, RTM System for Transfer of Atmospheric Radiation (STAR) calculations of the ET solar spectrum proposed by K¨opke et al. (2001) were used in order to investigate temporal and spectral variability of UV irradiance during the solar eclipse of 29 March 2006.
2 Campaign information, instruments and modeling
tools
2.1 Site description and eclipse details
The campaign took place at the island of Kastelorizo, Greece, during 28 and 29 (eclipse day) March 2006, with the partic-ipation of three groups: Innsbruck Medical University, Di-vision of Biomedical Physics, Austria (UI), Aristotle Uni-versity, Physics Department, Thessaloniki, Greece (AUTH) and School of Earth Atmospheric and Environmental Sci-ences, University of Manchester, UK (UMAN). The instru-ments were deployed in a field on the north side of the island. Hills obstructed the horizon towards the south and east up to an elevation of about 20◦, and affected the measurements of
GI but caused no obstruction to viewing the sun during the eclipse, as well as for several hours before and after.
The timing of the different phases of the eclipse for the specific location is given in Table 1. In all figures, vertical lines mark the beginning, maximum (totality) and the end of the eclipse.
The weather on 28 March was clear with cloudless skies and excellent visibility. On 29 March cirrus clouds started to form after the beginning of the eclipse. Occasionally, the cirrus clouds obscured the sun, especially after the time of the totality, affecting mainly the measurements of the DI. A few minutes before totality, cumulus clouds started developing, and continued growing as the eclipse progressed. However, on several occasions it was still possible to see the sun and measure the DI.
2.2 Instrumentation
Various instruments were deployed at Kastelorizo during this
two-day campaign. A double monochromator
spectrora-diometer (Bentham DTM 300-UI), operating in the spectral range 290–400 nm in steps of 0.5 nm, was used to measure simultaneously GI, AF and in addition DI. The full width at half maximum (FWHM) for the GI and AF measurements was 0.95 nm, while for the DI it was 0.55 nm. The scanning time for a full spectrum was about 3 min. A second double monochromator spectroradiometer (Brewer MK III-AUTH) was used to measure GI and DI in the wavelength region of 290–366 nm in steps of 0.5 nm and with spectral resolution of 0.55 nm (FWHM). For this study the operating software of the instrument was modified to allow the alternating mea-surement (every 30 s) of global and direct spectral irradiance at 6 wavelengths between 302 and 320 nm. The two instru-ments have been used in many UV monitoring campaigns measuring GI, DI and AF (Bais et al., 2001; Kylling et al., 2005; Webb et al., 2002). From the DI measurements the to-tal ozone column was calculated using the standard Brewer algorithm (differential absorption method). The absolute cal-ibration of both instruments is based on lamps of spectral irradiance traceable to the Physikalisch-Technische Bunde-sanstalt standards. However, in this campaign the emphasis was given to the relative change of the radiation due to the eclipse, and therefore the absolute calibration of the mea-surements was less important.
Two diode arrays (PDA-UMAN) and a coupled charged device (CCD-AUTH) spectrometers (all single monochro-mators) were also used to record spectral measurements of GI, DI, AF and zenith radiance. Their advantage is the in-stantaneous recording of the spectrum, which eliminates dis-tortions from clouds or from the change in the ET irradi-ance during the eclipse. The CCD was used for measure-ments of the DI and the sky radiance in the spectral range of 280–1040 nm with a variable wavelength dependent FWHM (ranging between 1.9 nm and 3.5 nm). Its usual sampling rate
is one measurement every 2 s and the field of view is 1.2◦.
The instrument was mounted on a tracking system capable of following the sun. The first PDA instrument (Ocean Optics S2000) was used for measurements of the GI in the spectral range of 290–850 nm with a FWHM of 1.3 nm, measuring one spectrum every 12 s. A second channel measured zenith sky radiance. The second PDA (Metcon Inc.) was used for measurements of the actinic flux in the spectral range of 290– 700 nm with a FWHM of 2.3 nm, measuring one spectrum every 8 s. A second channel measured DI in parallel with the Bentham.
In addition to the spectral measurements, measurements with broadband radiometers were also available. A NILU (Norsk Intitutt for Luftforskning) ultraviolet multi-filter ra-diometer (owned by AUTH) measured GI at 5 narrow bands (∼10 nm FWHM) in the UVB (305, 312, and 320 nm), the UVA (340 and 380 nm), and the photosynthetically active
radiation (PAR, 400–700 nm) with a frequency of 1 Hz. In addition, an erythemal detector, a UVA detector and a pyra-nometer operated continuously, recording 1 min averages.
Direct sun measurements with 2 handheld
sun-photometers (Microtops) with filters centred at 300, 305, 312, 340, 380, 440, 500, 675, 940 and 1020 nm were used to derive total ozone and aerosol optical depth. Manual measurements were made about every half hour during the day increasing in frequency to every few minutes during the eclipse. Two cameras with fish-eye lenses were taking pictures of the full sky; one camera was equipped with an additional adjustable polarization filter. Pictures were taken every 10 min, with an increased frequency of one picture per min during the eclipse.
The uncertainty on the absolute level of the quantities of all instruments described above is less than 10%, while for the spectroradiometric measurements is less than 5%. Since most of the issues discussed in this paper are described using ratios of quantities measured by the same instrument or rel-ative changes of GI, DI or AF, the uncertainty on the results shown is expected to be lower than the above percentages.
2.3 Modelling of the extraterrestrial irradiance spectrum
during the eclipse
To determine solar radiation quantities reaching the Earth’s surface, the ET solar radiation is used, for which the scatter-ing and absorption processes can be spectrally modeled. In general the ET solar irradiance at each wavelength is given as an average over the whole solar disc. During different eclipse periods, the moon covers different parts of the limb and the center of the sun. Thus the spectral dependence of the limb darkening of the sun becomes relevant. For the conditions of the total eclipse in Kastelorizo, this change of ET solar ir-radiance was calculated with help of one dimensional (1-D) radiative transfer model calculations presented in K¨opke et al. (2001). The model calculations have been carried out for both eclipse and non-eclipse conditions to obtain the vari-ation of various radiative quantities during the eclipse, un-der real atmospheric conditions but without the presence of clouds. The simulations of the radiative processes in the at-mosphere have been performed by an improved version of the radiative transfer model STAR (Schwander et al., 2001). It is based on a one-dimensional radiative transfer algorithm (Nakajima and Tanaka, 1988) that considers absorption and scattering (including multiple scattering) of air molecules, aerosol particles and atmospheric trace gases. The formulas used for taking into account the LD effect, taken from Wald-meier (1941) and Scheffler and Els¨asser (1974), are based on the geometric considerations of the position of the moon rela-tive to the sun during the eclipse combined with a description of the spectral radiance distribution over the solar disk and its dependence on the relative distance from the centre. For the specific study, the 1-D modelled ET was used to compare its theoretical results of the LD effect on the ET, with the
re-sults derived from the measurements performed during the described campaign.
3 Total ozone column
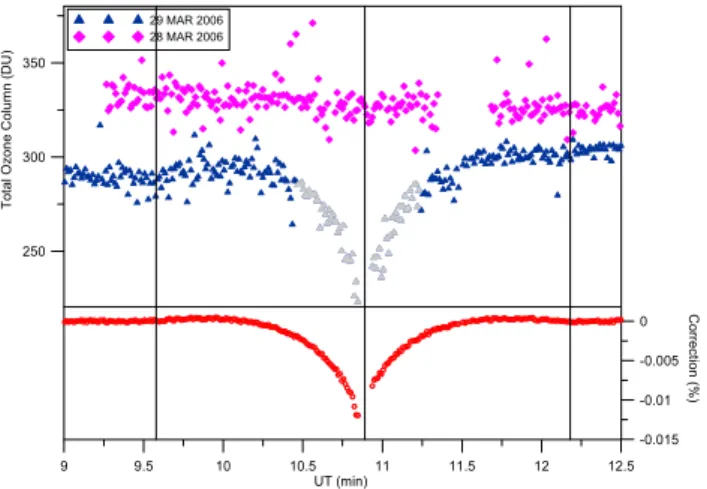
Surface UV-B radiation under cloud-free skies is primarily affected by atmospheric ozone and aerosols. Variation of these two parameters may partially mask the effect of the eclipse on UV-B radiation. From the DI measurements at the standard Brewer Ozone wavelengths (306.3, 310.1, 313.5, 316.8 and 320.1 nm) that were conducted during the cam-paign with the Brewer MK III, the total ozone column has been calculated. In general, total ozone was about 30–40 DU lower on the day of the eclipse than the day before. During the course of the eclipse, one can see a gradual decrease in total ozone, followed by a symmetric increase after totality (Fig. 1). This effect has been reported by others (Zerefos et al., 2001) and it was attributed partly to the LD effect and partly to the increasing influence on DI of the diffuse radi-ance in the field of view of the instruments.
As mentioned in the introduction, the spectral dependence of the measured DI due to the limb darkening of the sun be-comes relevant during measurements performed at an eclipse period. Due to this spectral dependent change of the ET, the wavelength pairs (ratios) that are used in the differential ab-sorption method (Kerr, 2002) for calculating total column ozone, are also affected from the LD and result in an error on the calculated ozone. In Zerefos et al. (2001) it was sug-gested that the LD effect is less than 1%. Here we confirm this finding by calculating a correction for total ozone based on the wavelength dependent change of ET irradiance dur-ing the eclipse derived by the model suggested in (K¨opke et al., 2001). This correction is shown in the lower panel of Fig. 1, and was found to be much smaller (less than 0.01%). Therefore the most likely reason for the apparent reduction in total ozone values during the eclipse is “contamination” of DI measurements by the diffuse radiation. Brewer DS mea-surements are performed with a finite field of view. There-fore there is inherently some fraction of the diffuse irradiance (aureole and Rayleigh components) entering the instrument measuring the direct irradiance (Arola and Koskela, 2004). The magnitude of this effect depends on the field of view and the wavelength but also on the air mass factor. In Fig. 1 the measurements that correspond to sun coverage by the moon of more than 70% are marked with grey triangles and should be discarded. The reduction in DI measurements at 70% eclipse coverage corresponds to an air mass factor higher than 3, if measurements were performed under normal (non eclipse) conditions. These measurements are usually dis-carded in the standard Brewer total ozone measurements. For the period between 09:00 and 13:00 UT, the total ozone col-umn was changing on the day before the eclipse from about 335 DU down to about 325 DU, and on the day of the eclipse it was increasing from about 290 DU to 305 DU. This large
5778 S. Kazadzis et al.: Effects of total solar eclipse of 29 March 2006 on surface radiation 9 9.5 10 10.5 11 11.5 12 12.5 UT (min) 250 300 350 T o ta l O z o n e C o lu m n ( D U ) -0.015 -0.01 -0.005 0 Co rr e c tio n (% ) 29 MAR 2006 28 MAR 2006 Figure 1
Fig. 1. Total column ozone measured by a Brewer spectroradiome-ter on 28 (pink) and 29 (blue) March 2006. Measurements that cor-respond to sun coverage by the moon of more than 70% are marked with grey triangles (red): Calculated correction in total ozone due to the limb darkening effect.
(∼30 DU) difference between the two days can be attributed to a stratospheric change of the total column ozone amount. Such large day-to-day changes are not rare for spring at the latitude that the measurements took place.
4 Spectral measurements of solar radiation during the
eclipse
Measurements of GI and DI during the eclipse and for the previous day are shown in Fig. 2. The black vertical lines represent the start of the eclipse, totality and the end of the eclipse. Except for the reduction in both quantities due to the eclipse the main change in the irradiance is due to changes in the solar zenith angle. Local noon was within a few min-utes of the start of the eclipse and all irradiance changes afterwards are a combination of the eclipse effect in addi-tion to the reducaddi-tion of the irradiance due to the decreasing solar zenith angle. The variability that is observed around 10.20 UT. and around 12:00 UT. is due to clouds passing in front of the sun. The effect is more pronounced in the DI measurements, as the GI represents the sum of the (weighted with the cosine of the solar zenith angle) DI and the diffuse irradiance components.
With the use of DI spectroradiometric data the spectral aerosol optical depth could be derived by using the Beer-Lambert’s law and the methodology that is described in (Marenco et al., 1997). On the day before the eclipse, it was between 0.35 and 0.40 at 350 nm, with an Angstrom expo-nent for the wavelength dependency of about 1. On the day of the eclipse, similar values were measured for the aerosols.
0 100 200 300 400 G lo b a l Ir ra d ia n c e a t 3 2 0 n m 9 9.5 10 10.5 11 11.5 12 12.50 50 100 150 200 Time (U.T.) D ire c t I rra d ia n c e a t 3 2 0 n m 29-Mar-2006 (eclipse) 28-Mar-2006 Figure 2
Fig. 2. Global (top) and direct (bottom) spectral irradiance at 320 nm measured with the Brewer spectroradiometer on the eclipse day (blue symbols) and on the previous day (grey lines).
4.1 Global irradiance and actinic flux
Measurements of global UV irradiance that were performed during the campaign with the NILU-UV multi-filter instru-ment have been used to study the spectral impact of the LD on the GI. Ratios of GI measurements at 380 nm to the irra-diances at 312, 320 and 340 nm are shown in Fig. 3. First, the data were corrected for the effect of the changing so-lar zenith angle during the period of study by normalization with the measurements taken during the previous (cloudless) day at the same solar zenith angles. In more detail, first we
have calculated the ratio A(λ, ϑ)=[GI(λ, ϑ)/GI(λ, ϑ0)]for
28 March (cloudless conditions) (where λ is the wavelength,
ϑ the solar zenith angle and ϑ0the solar zenith angle at
lo-cal noon) and afterwards we have multiplied GI(λ, ϑ) on the eclipse day with the factor A(λ, ϑ). These ratios were nor-malized again with the mean ratio over a period of 5 min just before the start of the eclipse, to bring all ratios to the same scale and allow direct comparisons for all three wavelengths. During the 5 min period used for the normalization the sky was free of clouds. If the attenuation of GI was spectrally in-dependent and proportional to the geometrical sun coverage, the ratios would have been equal to unity throughout the pe-riod of the eclipse. Figure 3 shows that there is a spectral de-pendence which is more evident at the shorter wavelengths. The change in irradiance at 312, 320 and 340 nm relative to the irradiance at 380 nm, is respectively about 20%, 15% and 10% for 99% sun coverage. The changes of these wavelength ratios are describing how the limb darkening is affecting GI measurements at the earth’s surface. This effect leads to a faster decrease of the GI at lower wavelengths than the GI at higher ones. The above given percentages indicate that for 99% sun coverage GI at 312 nm is decreasing 20%, 10% and 5% more than the GI at 380, 340 and 320 nm respectively. For each channel, measurements of less than 10 times the dark current were eliminated from the analysis. In Fig. 3 the data that correspond to the totality and approximately 30 s
9.5 10.0 10.5 11.0 11.5 12.0 12.5 TIME (U.T.) 0.9 1.0 1.1 1.2 1.3 1.4 R a ti o o f sp e ct ra l g lo b a l irra d ia n ce 380 / 312 (nm) 380 / 320 (nm) 380 / 340 (nm) Figure 3
Fig. 3. Normalized and SZA corrected ratios of global irradiance at 380 nm relative to 312 nm (blue), 320 nm (red) and 340 nm (black) measured with the NILU-UV instrument during the eclipse.
before and after are not shown, because of their low signal to noise ratio.
Periods affected by clouds are visible in the dataset es-pecially after the eclipse. In addition, the change of the total ozone column during the eclipse (see Fig. 1) results in separation of the three curves after totality (mainly after 11:00 UT). This separation occurs because the ratios for 312 and 320 nm are normalized with values measured at a time of lower total ozone (∼09:30 UT). GI at 340 nm is not affected by ozone; hence the ratio (380 nm/340 nm) is more symmet-ric around the totality.
Measurements of AF were performed with the high fre-quency PDA instrument. Figure 4 shows the ratio of GI ver-sus AF, at 320 and 340 nm, as measured with the two PDA instruments during the eclipse period, and the day before the eclipse. The data represent 30 s averages. The data during the 3 min of the totality and for a 1 min before and after are not shown due to the large scatter introduced by the low signal to noise ratio of the PDA’s. Effects from thin cirrus clouds that have appeared occasionally during the eclipse resulted into decreases for both ratios. Generally the differences in the ratios with respect to the previous day are small (on the order of 5–8%). As the eclipse progresses the ratio in the eclipse day becomes lower compared to the previous day, suggesting that GI is affected more by the eclipse than the AF. The reason is the faster decrease in the direct irradiance compared to the diffuse irradiance during the eclipse which will have a more pronounced effect on GI than on AF. Due to the missing cosine weighting in the AF, the diffuse radiation far from the zenith contributes more strongly to the signal. Therefore the relative contribution of the direct component in the AF is systematically lower than in the GI (K¨opke et al., 2001). RTM calculations for the specific solar zenith angles, using the measured aerosol optical depth and total ozone at Kastelorizo, showed that at 340 nm the contribution of the DI
9.0 9.5 10.0 10.5 11.0 11.5 12.0 12.5 TIME (U.T.) 0.5 0.6 0.7 0.8 0.9 1.0 1.1 G lo b a l ir ra d ia n c e / Ac ti n ic F lu x 320 nm 340 nm Figure 4
Fig. 4. Ratio of Global Irradiance/Actinic Flux at 320 (black sym-bols) and 340 nm (red symsym-bols) as a function of time as measured with the PDA instrument. The corresponding ratios for the previous day are shown with black and red lines.
9 10 11 12 13 Time (UT) 0.6 0.8 1.0 1.2 1.4 A c ti n ic f lu x n o rm a liz e d r a ti o s JO1D / JNO2 0E+0 1E-5 2E-5 3E-5 4E-5 JO 1 D (s e c -1 ) 0E+0 2E-3 4E-3 6E-3 JN O2 ( se c -1) JNO 2 JO1D Figure 5
Fig. 5. Variation of JO1D (triangles) and JNO2(crosses) photolysis rates, normalized with their values at the time of the first contact. The ratio JO1D/JNO2is also shown in purple circles.
is 40% for the GI and 30% for AF. GI and AF values were calculated from the libRadtran model (Mayer and Kylling, 2005). The radiative transfer equation was solved with the discrete ordinates algorithm, using six streams and pseudo-spherical correction. The Air Force Geophysical Laboratory U.S. standard atmosphere profiles were used for ozone, tem-perature and air pressure. The type of landscape suggests a relatively small surface albedo, thus the spectrally constant values of 0.03 was used for the while UV region.
As it was shown, the LD effect has an impact on the GI and AF measured at the ground. The impact can be seen during the eclipse, by the faster decrease of the GI and AF at shorter wavelengths than the one at higher ones. As it is known, JO1D and JNO2photolysis rates can be retrieved from the AF
measurements. Furthermore, they are sensitive to the AF at
5780 S. Kazadzis et al.: Effects of total solar eclipse of 29 March 2006 on surface radiation 9.5 10.0 10.5 11.0 11.5 12.0 12.5 TIME (U.T.C.) 0.8 0.9 1.0 1.1 1.2 1.3 1.4 1.5 1.6 1.7 1.8 R a ti o o f D ir e c t ir a d ia n c e ( n o rm a lis e d ) 675/380 nm model 675/500 nm model 675/380 nm measurements 675/500 nm measurements 9.5 10 10.5 11 11.5 12 0.9 1 1.1 1.2 1.3 1.4 1.5 1.6 1.7 1.8 675/340 nm 675/380 nm 675/440 nm 675/500 nm crosses - measurements lines - model time [UTC] ra ti o o f d ir e c t ir ra d ia n c e [n o rm a li s e d ]
Change of spectral ratios of direct irradiance during eclipse
Figure 6
Fig. 6. Direct irradiance ratios of various wavelengths relative to 650 nm measured (symbols) and modeled (curves) at the time of the eclipse derived from the Microtops sun-photometer (left panel) and the CCD spectrometer (right panel).
around 380 nm). Thus, the LD effect can be clearly seen also when measuring these two photolysis rates. The results in Fig. 5 show that the LD effect on the calculated photolysis rates leads to a faster decrease of the JO1D photolysis rate than the one of JNO2, as expected. Both rates and their ratio
are shown in Fig. 5.
For Fig. 5 no normalization has been made to account for solar zenith angle change in order to demonstrate this so-lar zenith angle effect together with the LD effect on the JO1D/JNO2ratio.
4.2 Direct irradiance
The change in the spectral characteristics of the direct so-lar irradiance is demonstrated by the ratio of the irradiance at 675 nm to the irradiance at 340 nm, 380 nm, 440 nm and 500 nm, which were measured by the Microtops sun pho-tometers. The measured DI was corrected for the chang-ing solar zenith angle accordchang-ing to Beer’s law of extinction and as we are interested in relative changes, the above ratios were normalized to their values at around 10:00 UT. Figure 6 shows clearly the increase of these ratios during the course of the eclipse towards the totality (and the decrease after to-tality). A similar pattern is seen also in the ratios 675/340 nm and 675/500 nm which were derived from the STAR model calculations. Evidently, when the moon covers the sun the irradiance at shorter wavelengths is reduced more compared to longer wavelengths. However, the detail of the variation of the measured values deviates systematically from the model calculation, in the first phase of the eclipse as well as in the fi-nal phase. The measured variation is stronger than the
calcu-lated one. An effect that could explain part of the differences shown in Fig. 6 is the contribution of the diffuse irradiance (entering in the field of view of the instruments) which in-creases as the eclipse percentage increase. This effect can not be taken into account from the model calculations pre-sented here. The higher DI rations that can be seen after the totality compared with the ones before (left panel of Fig. 6), might indicate the effect of cirrus clouds appearing just after the total eclipse. These results for the spectral variation of the DI are very well confirmed by analyses of DI measure-ments with the CCD spectrometer, which show exactly the same behavior (see right panel of Fig. 6).
5 Extraterrestrial flux and solar effective temperature
calculations
As different areas of the sun are covered during the eclipse, the radiation received at the top of the atmosphere is a com-bination of photons emerging from different regions of the sun (corresponding to different temperatures – Limb Dark-ening effect), and hence its spectrum differs from that of the black body radiation that is usually considered. Being a mixture of black body spectra of different temperatures the calculated spectrum at the top of the atmosphere, during the different phases of the eclipse, can be corresponded to a dif-ferent effective temperature for each eclipse time (sun cover-age percentcover-age). In the following we estimate the ET solar spectrum which varies during the course of the eclipse and we determine the corresponding effective temperature of the
350 400 450 500 550 600 0.85 0.9 0.95 1 1.05 wavelength (nm) ET / ET (F C ) 350 400 450 500 550 600 -150 -100 -50 0 wavelength (nm) Δ T ( oC ) cov.=0.48[M] cov.=0.49[M] cov.=0.50[M] cov.=0.51[M] cov.=0.48[B] cov.=0.51[C] Figure 7
Fig. 7. (Top) ratios of calculated ET spectra at 50% sun coverage to an ET spectrum before the start of the eclipse as derived by the Bentham measurements (red line), the CCD measurements (green line) and by model calculations (dashed lines). (Bottom) Differ-ences in effective temperature of the Sun derived from the calcu-lated ET spectra.
partly visible sun from the equivalent to the each ET spec-trum blackbody radiation using the Plank’s law.
Using the Atlas 3 ET solar spectrum (Brueckner et al., 1996) and the DI measurements at the surface, the atmo-spheric transmission was calculated before the start of the eclipse. The ET spectrum was convolved with the slit func-tion of each instrument and the spectral transmittance was calculated as the ratio of the measured spectral DI before the start of the eclipse (adjusted to vertical incidence) to the con-volved ET solar spectrum. The derived cloudless sky trans-mittance, that is assumed constant during the period of the eclipse, was used to calculate new ET spectra from the mea-sured DI at the surface during the course of the eclipse. Spec-tra of DI were measured by means of the scanning spectro-radiometer (Bentham DTM 300), and the CCD spectrom-eter, while measurements at single wavelengths were pro-vided also by the 2 handheld Microtops sun-photometers. Zerefos et al. (2001) calculated using the same methodol-ogy the pre-eclipse ET spectrum and the ET at the eclipse maximum (88%) at Thessaloniki, Greece for the eclipse of 11 August 1999. In addition, they calculated the effective temperature derived by each wavelength in the spectral range 305–365 nm. Here, we have extended the spectral range to 600 nm and we have calculated the ET spectrum change and the corresponding effective temperature for all measurement points (times) during the eclipse. The analysis shown here-after is restricted to the first part of the eclipse only, as here-after the totality more cirrus clouds appeared on the sky causing changes in the atmospheric transmission.
In the upper plot of Fig. 7, the spectral ratio of the ET flux as calculated for 50% sun coverage to the ET flux be-fore the start of the eclipse is shown. Red and green lines represent measurements with the Bentham spectroradiome-ter (for 48% sun coverage) and the CCD spectromespectroradiome-ter (for 51% sun coverage) respectively. The dashed lines represent
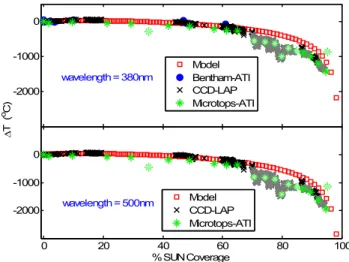
-2000 -1000 0 wavelength = 380nm 0 20 40 60 80 100 -2000 -1000 0 % SUN Coverage Δ T ( oC ) wavelength = 500nm Model CCD-LAP Microtops-ATI Model Bentham-ATI CCD-LAP Microtops-ATI Figure 8
Fig. 8. Solar effective temperature difference from the temperature at the start of the eclipse as a function of sun coverage derived from irradiance measurements at 380 nm (top) and 500 nm (bottom) from three instruments and STAR model data. Grey symbols represent cloud infected measurements.
the STAR model calculations for different fractions of sun coverage from 48% to 51%, in steps of 1%. The lower plot of Fig. 7 shows the difference of the sun effective temper-ature calculated at the specific time of the eclipse from the temperature calculated before the start of the eclipse. It has to been mentioned that we compared the ET at no eclipse conditions with the measured (from DI) ET’s at certain times (sun coverage percentages) during the eclipse. The latter was corrected (normalized) dividing it with the percentage of ge-ometrical sun coverage at each point. For example the 50% eclipse ET (shown in the upper plot of Fig. 7) was first calcu-lated from the DI measurements, then divided with a factor of 0.5 and finally compared with the non eclipse ET. The dif-ference of the two is due to the limb darkening effect. If this effect was not present, all ET ratios would be equal to one and all temperature differences would be equal to zero for all wavelengths. We have calculated these ratios and tempera-ture differences for various points (times) during the eclipse (shown in Fig. 8) while Zerefos et al. (2001) have calculated the same feature only for the maximum (88% sun coverage) of the eclipse. This has been investigated in order to show the spectral deviations, due to the LD effect, of the calculated ET’s from the ones calculated with the use of the Planck’s law. In this case, the LD effect creates a temperature dif-ference that varies with wavelength. It should be mentioned that the CCD measures a spectrum in less than 20 s while the Bentham spectroradiometer measurement lasts for about 3 min, which in conjunction to the changing conditions due to the eclipse leads to differences in the measurements of the two instruments. This can explain part of the observed dif-ferences in the calculated ET spectra derived from the direct irradiance measurements by the two instruments, as shown in the upper panel of Fig. 7.
5782 S. Kazadzis et al.: Effects of total solar eclipse of 29 March 2006 on surface radiation An interesting effect can be seen when we calculated the
same ET flux ratios and temperature differences for the first minutes of the eclipse. For 10% sun coverage both instru-ments and the model calculations show an increase in the cal-culated ET flux of up to 5% and also a temperature increase
(up to 40◦). This happens because in the beginning of the
eclipse only the outer part of the solar disk is covered. The outer part has a lower temperature so the mean temperature of the sun at this moment is dominated by the temperature of the central part of the solar disk. This leads to the calculation of a higher ET than the one calculated before the start of the eclipse.
The deviation of the solar effective temperature derived indirectly from the measurements from the one calculated assuming the black body emission for two wavelengths (380 nm and 500 nm) is shown in Fig. 8 for the different phases of the eclipse. Grey symbols represent DI measure-ments with the CCD spectrometer that were likely affected by cirrus clouds. As a result of this change in atmospheric transmission the calculated ET flux is lower than the one expected under cloudless skies, and thus the calculated ef-fective temperatures are lower than those predicted by the model. The results from all instruments show similar behav-ior. Larger deviations are observed for longer wavelengths and an acceleration of the rate of this decrease is observed in the last minutes before totality. In general, modeled ET’s and ET’s inferred from measurements, during times not disturbed by clouds, show mostly good agreement.
6 Conclusions
Spectral measurements of the solar radiation were performed at Kastelorizo, Greece during a total solar eclipse. The re-sults were compared with changes in the extraterrestrial solar flux predicted according to the technique explained in K¨opke et al. (2001). The model results allow the computation of a correction for the total ozone measurements due to the limb darkening effect during the eclipse. This correction is far too small to explain the large decrease in total ozone col-umn derived from the standard Brewer measurements. It is suggested that this decrease in total ozone is an artifact due to the increasing contribution of diffuse radiation against the decreasing direct irradiance (that is used for the total ozone column retrieval) caused by the eclipse.
Global irradiance, direct irradiance and actinic flux mea-surements showed that all quantities are spectrally affected by the limb darkening during the eclipse. The effect leads to wavelength dependent changes in the measured solar spectra showing a much more pronounced decrease in the radiation at the lower wavelengths as the percentage of the sun cover-age is increased for all the above quantities.
The comparison of model results and measurements showed that previous 1-D model calculations underestimate this spectral limb darkening effect especially close to the
totality of the solar eclipse. 3-D model calculations per-formed by Emde and Mayer (2007) reported that 3-D cal-culations show that the radiation decreases much more for shorter wavelengths than the 1-D model would suggest due to limb darkening. They also quantified the uncertainty of the 1-D approximation at different times of the eclipse (eclipse phases). This result was confirmed by measurements from two different instruments presented in this study.
Calculations of the ET solar spectrum and the effective sun’s temperature as derived from direct irradiance measure-ments at the surface, showed an artificial change in both quantities. The limb darkening effect induces changes in the ET spectrum measured with the help of remote sensing techniques. The derived ET spectrum is a mixture of black body radiation spectra originating from parts of the solar disk with different temperatures. Thus, fitting a Plank function on these data, in order to derive the corresponding black body temperature of the Sun, leads to false estimates.
Acknowledgements. The authors would like to acknowledge the
anonymous referees for their work on the substantial improvement of the manuscript.
Edited by: C. Zerefos
References
Arola, A. and Koskela, T.: On the sources of bias in aerosol optical depth retrieval in the UV range, J. Geophys. Res., 109, D08209, doi:10.1029/2003JD004375, 2004.
Bais, A. F., Gardiner, B. G., Slaper, H., Blumthaler, M., Bern-hard, G., McKenzie, R., Webb, A. R., Seckmeyer, G., Kjeld-stad, B., Koskela, T., Kirsch, P. J., Gr¨obner, J., Kerr, J. B., Kazadzis, S., Leszcznski, K., Wardle, D., Josefsson, W., Brog-niez, C., Gillotay, D., Reinen, H., Weihs, P., Svenoe, T., Erik-sen, P., Kuik, F., and Redondas A.: SUSPEN intercompari-son of ultraviolet spectroradiometers, J. Geophys. Res.-Atmos., 106(D12), 12 509–12 525, 2001.
Beletsky, A. B., Mikhalev, A. V., and Chernigovskaya, M. A.: Spec-tral measurements of the solar nearground UV radiation during the solar eclipse on March 9, 1997, Atmos. Oceanic Opt., 11, 301–306, 1998.
Bojkov, R. D.: The ozone variations during the solar eclipse of May 20 1966, Tellus, 20, 417–421, 1968.
Brueckner, L., Floyd, E., Lund, P. A., Prinz, D. K., and VanHoosier, M. E.: Solar Ultraviolet Spectral Irradiance Observations for the UARS/SUSIM Experiment, G.E., Metrologia, 32, 661–665, 1996.
Chakrabarty, D. K., Shah, N. C., and Pandya, K. V.: Fluctuation in ozone column over Ahmedabad during the solar eclipse of 24 October 1995, Geophys. Res. Lett., 24(23), 3001–3004, 1997. Emde, C. and Mayer, B.: Simulation of solar radiation during a total
solar eclipse: A challenge for radiative transfer, Atmos. Chem. Phys., 7, 2259–2270, 2007,
http://www.atmos-chem-phys.net/7/2259/2007/.
Fernandez, W., Castro, V., Wright, J., Hidalgo, H., and Saenz, A.: Changes in solar irradiance and atmospheric turbidity in Costa
Rica during the total solar eclipse of July 11, 1991, Earth Moon Planets, 63(2), 119–132, 1993.
Greve, A. and Neckel, H.: On the consistency of solar limb darken-ing observations at UV wavelengths (2000–3300 A), Astronomy and Astrophysics Supplement Series, 120(1), 35–39, 1996. Jerlov, N., Olsson, H., and Schuepp, W.: Measurements of solar
radiation at Loevanger in Sweden during the total eclipse 1945, Tellus, 6, 44–45, 1954.
Kerr, J. B.: New methodology for deriving total ozone and other atmospheric variables from Brewer spectrophotome-ter direct Sun spectra, J. Geophys. Res., 107(D23), 4731, doi:10.1029/2001JD001227, 2002.
K¨opke, P., Reuder, J., and Schween, J.: Spectral variation of the solar radiation during an eclipse, Meteorol. Z., 10(3), 179–186, 2001.
Kylling, A., Webb, A. R., Kift, R., et al.: Spectral actinic flux in the lower troposphere: measurement and 1-D simulations for cloud-less, broken cloud and overcast situations, Atmos. Chem. Phys., 5, 1975–1997, 2005,
http://www.atmos-chem-phys.net/5/1975/2005/.
Marenco, F., Santacesaria, V., Bais, A. F., Balis, D., Di Sarra, A., Papayannis, A., and Zerefos, C. S.: Optical properties of tro-pospheric aerosols determined by lidar and spectrophotometric measurements (PAUR campaign), Appl. Opt., 36, 6875–6886, 1997.
Mayer, B. and Kylling, A.: Technical note: The libRadtransoftware package for radiative transfer calculations – description and ex-amples of use, Atmos. Chem. Phys., 5, 1855–1877, 2005, http://www.atmos-chem-phys.net/5/1855/2005/.
Mikhalev, A. V., Chernigovskaya, M. A., Beletsky, A. B., Kaz-imirovsky, E. S., and Pirog, O. M.: Variations of the ground-measured solar ultraviolet radiation during the solar eclipse on March 9, 1997, Adv. Space Res., 24(5), 611-619, 1999. Nakajima, T. and Tanaka, M.: Algorithms for radiative intensity
calculations in moderately thick atmospheres using a truncation approximation, J. Quant. Spectrosc. Radiat. Trans., 40, 51–69, 1988.
Scheffler, H. and Els¨asser, H.: Physik der Sterne und der Sonne, 535 pp., Bibliographisches Institut Z¨urich, Zurich, Switzerland, 1974.
Shaw, G. E.: Sky radiance during a solar eclipse: a theoretical model, Appl. Opt., 17, 272–278, 1978.
Sharp, W. E., Silverman, S. M., and Lloyd, J. W. F.: Summary of sky brightness measurements during eclipses of the sun, Appl. Opt., 10, 1207–1210, 1971.
Schwander, H., Kaifel, A., Ruggaber, A., and Koepke, P.: Spec-tral radiative-transfermodeling with minimized computation time by use of a neural-network technique, Appl. Opt., 40, 331–335, 2001.
Stranz, D.: Ozone measurements during solar eclipse, Tellus, 13, 276–279, 1961.
Svensson, B.: Observations on the amount of ozone by Dobson spectrophotometer during the solar eclipse of June 30, 1954, Arkives Geofysikae, 2, 573–594, 1958.
Waldmeier, M.: Ergebnisse und Probleme der Sonnenforschung, Probleme der kosmischen Physik, 264 pp., Akad Verlagsges Becker & Erler, Leipzig, Germany, 1941.
Webb, A. R., Bais, A. F., Blumthaler, M., Gobbi, G. P., Kylling, A., Schmitt, R., Thiel, S., Barnaba, F., Danielsen, T., Junker-mann, W., Kazantzidis, A., Kelly, P., Kift, R., Liberti, G. L., Misslbeck, M., Schallhart, B., Schreder, J., and Topaloglou, C.: Measuring spectral actinic flux and irradiance: Experimental re-sults from the Actinic Flux Determination from Measurements of Irradiance (ADMIRA) project, J. Atmos. Ocean. Tech., 19(7), 1049–1062, 2002.
Zerefos, C. S., Balis, D. S., Zanis, P., Meleti, C., Bais, A. F., Tour-pali, K., Melas, D., Ziomas, I., Galani, E., Kourtidis, K., Pa-payannis, A., and Gogosheva, Z.: Changes in surface UV solar irradiance and ozone over the Balkans during the eclipse of Au-gust 11, 1999, Adv. Space Res., 27(12), 1955–1963, 2001.