HAL Id: hal-00298130
https://hal.archives-ouvertes.fr/hal-00298130
Submitted on 14 Jun 2006HAL is a multi-disciplinary open access
archive for the deposit and dissemination of sci-entific research documents, whether they are pub-lished or not. The documents may come from teaching and research institutions in France or abroad, or from public or private research centers.
L’archive ouverte pluridisciplinaire HAL, est destinée au dépôt et à la diffusion de documents scientifiques de niveau recherche, publiés ou non, émanant des établissements d’enseignement et de recherche français ou étrangers, des laboratoires publics ou privés.
Comparing transient, accelerated, and equilibrium
simulations of the last 30 000 years with the GENIE-1
model
D. J. Lunt, M. S. Williamson, P. J. Valdes, T. M. Lenton
To cite this version:
D. J. Lunt, M. S. Williamson, P. J. Valdes, T. M. Lenton. Comparing transient, accelerated, and equilibrium simulations of the last 30 000 years with the GENIE-1 model. Climate of the Past Discussions, European Geosciences Union (EGU), 2006, 2 (3), pp.267-283. �hal-00298130�
CPD
2, 267–283, 2006 Transient simulations of the last 30 000 years D. J. Lunt et al. Title Page Abstract Introduction Conclusions References Tables Figures J I J I Back CloseFull Screen / Esc
Printer-friendly Version Interactive Discussion
EGU
Clim. Past Discuss., 2, 267–283, 2006 www.clim-past-discuss.net/2/267/2006/ © Author(s) 2006. This work is licensed under a Creative Commons License.
Climate of the Past Discussions
Climate of the Past Discussions is the access reviewed discussion forum of Climate of the Past
Comparing transient, accelerated, and
equilibrium simulations of the last 30 000
years with the GENIE-1 model
D. J. Lunt1, M. S. Williamson2,3,4, P. J. Valdes1, and T. M. Lenton2,3
1
Bristol Research Initiative for the Dynamic Global Environment (BRIDGE), School of Geographical Sciences, University of Bristol, U.K.
2
School of Environmental Sciences, University of East Anglia, U.K.
3
Tyndall Centre, U.K.
4
Current affiliation: Quantum Information Group, University of Leeds, United Kingdom Received: 3 May 2006 – Accepted: 17 May 2006 – Published: 14 June 2006
CPD
2, 267–283, 2006 Transient simulations of the last 30 000 years D. J. Lunt et al. Title Page Abstract Introduction Conclusions References Tables Figures J I J I Back CloseFull Screen / Esc
Printer-friendly Version Interactive Discussion
EGU
Abstract
We examine several aspects of the ocean-atmosphere system over the last 30 000 years, by carrying out simulations with prescribed ice-sheets, atmospheric CO2 con-centration, and orbital parameters. We use the GENIE-1 model with a geostrophic ocean, dynamic sea-ice, an energy balance atmosphere, and a land-surface scheme
5
with fixed vegetation. A transient simulation, with boundary conditions derived from ice-core records and ice-sheet reconstructions, is compared with equilibrium snap-shot simulations, including the Last Glacial Maximum (21 000 years before present; 21 kyrBP), mid-Holocene (6 kyrBP) and pre-industrial. The equilibrium snapshot sur-face temperatures are all very similar to their corresponding time period in the transient
10
simulation, suggesting that in the last 30 000 years, the ocean-atmosphere system has been close to equilibrium with its boundary conditions. We investigate the method of accelerating the boundary conditions of a transient simulation and find that the South-ern Ocean is the region most affected by the acceleration. The Northern Hemisphere, even with a factor of 10 acceleration, is relatively unaffected.
15
1 Introduction
General Circulation Models (GCMs) have for many years been used to simulate pa-leoclimates. Typically, “snapshot” equilibrium simulations of selected time-periods are carried out; that is, the boundary conditions do not vary with time, as in the PMIP-1 project (Joussaume and Taylor,1995), which employed Atmospheric GCMs (AGCMs)
20
with fixed sea surface temperatures (SSTs) or slab-oceans, or as in the PMIP-2 project
(http://www-lsce.cea.fr/pmip2), which employed fully coupled Atmosphere-Ocean and
Atmosphere-Ocean-Vegetation GCMs. This is due to the computational expense of carrying out multi-millennial transient simulations, for example of the last deglaciation. For pragmatic reasons, these equilibrium simulations are usually initialised with some
25
time-CPD
2, 267–283, 2006 Transient simulations of the last 30 000 years D. J. Lunt et al. Title Page Abstract Introduction Conclusions References Tables Figures J I J I Back CloseFull Screen / Esc
Printer-friendly Version Interactive Discussion
EGU
period (such as present-day). They are then “spun-up” for some period, to allow the system to come close to equilibrium with the boundary conditions. At the end of the spin-up, the model is run for a further period, typically decades, to extract monthly and annual mean climatologies. These modelled climatologies can then be compared to paleo-proxies of the snapshot being considered, for example SST data (e.g. de
Ver-5
nal et al.,2005), or terrestrial temperature data (e.g.Jost et al.,2005). The degree of agreement between the model and data can be used as a measure of the accuracy and validity of the climate model, and of its ability to simulate future climates.
One of the assumptions behind this methodology is that the Earth-system which is being represented is in equilibrium, or close to equilibrium, with its boundary conditions,
10
at the time periods being considered. Here, we test this assumption by comparing 30 kyr transient simulations with equilibrium simulations, in particular of the Last Glacial Maximum (LGM, 21 kyrBP), mid-Holocene (6 kyrBP) and pre-industrial.
In order to overcome model speed limitations, some previous workers have em-ployed an “acceleration” technique for transient paleo simulations, in which the
bound-15
ary conditions are accelerated by some factor, to compress the simulation. Jackson
and Broccoli (2003) used an AGCM coupled to a slab ocean to simulate 165 000 years of climate, accelerated by a factor of 30;Lorenz and Lohmann(2004) used an AOGCM to simulate 7 000 years of climate, accelerated by factors of 10 and 100. We assess the error this introduces in an AOGCM by carrying out an ensemble of transient
sim-20
ulations with different acceleration factors, and comparing them to an un-accelerated transient simulation.
The tool we use in this paper is GENIE-1, an Earth system Model of Intermediate Complexity (EMIC). We examine only those aspects of the model results which we believe will be reproduced by a full-complexity GCM. These are global, hemispheric,
25
CPD
2, 267–283, 2006 Transient simulations of the last 30 000 years D. J. Lunt et al. Title Page Abstract Introduction Conclusions References Tables Figures J I J I Back CloseFull Screen / Esc
Printer-friendly Version Interactive Discussion
EGU
2 Model and methods
GENIE-1 [http://www.genie.ac.uk], is an EMIC which features the following coupled components: a three dimensional frictional geostrophic ocean (Edwards and Marsh,
2005), a two dimensional energy moisture balance atmosphere (Edwards and Marsh,
2005;Weaver et al.,2001;Fanning and Weaver,1996), dynamic and thermodynamic
5
sea-ice (Edwards and Marsh,2005;Semtner,1976;Hibler,1979), and a land surface physics and terrestrial carbon cycle model (Williamson et al., in press, Ecological Mod-elling). The model is on an equal surface area grid consisting of 36×36 gridboxes, and the ocean has 8 equallog(z)vertical levels. The model is essentially the same used in the work of Lenton et al. (2006) except that the land model is run with
pre-10
scribed vegetation, and ocean biogeochemistry is not included in these simulations. For the prescribed vegetation we use the annual mean from the end of a standard pre-industrial simulation. The vegetation determines the land surface albedo and land roughness length. These properties are interpolated linearly between those for an ice sheet and those for the prescribed vegetation, according to the ice sheet fraction in
15
each grid box as it waxes and wanes during the transient simulations. 2.1 Boundary conditions
In order to carry out transient or equilibrium simulations of the past 30 000 years, GENIE-1 requires prescribed orbital parameters of eccentricity, obliquity, and preces-sion, an atmospheric CO2 concentration, and 2-D fields of orography and ice-sheet
20
fraction.
For the orbital parameters we use the data ofBerger (1978). To construct the CO2 record, we initially use the Vostok ice-core data ofPetit et al.(1999), linearly interpo-lated to give one value every 1000 years. We then add anomalies calcuinterpo-lated from the Dome C ice-core data ofMonin et al.(2004) to the lower-resolution Vostok record. The
25
resulting record, shown in Fig.1a, has a resolution of approximately 120 years over the period 21 kyrBP to pre-industrial, where the record from Dome C exists, and reverts to
CPD
2, 267–283, 2006 Transient simulations of the last 30 000 years D. J. Lunt et al. Title Page Abstract Introduction Conclusions References Tables Figures J I J I Back CloseFull Screen / Esc
Printer-friendly Version Interactive Discussion
EGU
the low resolution record over the period 30 kyrBP to 21 kyrBP, which is out of the range of theMonin et al.(2004) Dome C data. All timeseries are further linearly interpolated internally within the model onto its 2-day time-step.
For the orography and ice-sheet fraction we make use of the ICE-4G reconstruction
(Peltier,1994) for the time period 21 kyrBP to 0 kyrBP. Prior to this there is no
equiva-5
lent time-varying global reconstruction due to a shortage of geological data. However, for 30 kyrBP we use a reconstruction carried out byArnold et al.(2002). Starting from these snapshot reconstructions, we obtain a higher resolution record by interpolating between them, using the Vostok δ18O record (Petit et al.,1999), a proxy for global ice volume. The temporal resolution of this record varies across the time period
consid-10
ered, but is an average of about 400 years over the 30 000 years. The resulting time-series, shown in Fig.1b, is reasonable, but the reconstruction suffers from a couple of drawbacks. Firstly, the interpolation between the snapshots is linear in the vertical; in reality, an ice-sheet expands or contracts around the margins. Secondly, for consis-tency with previous work, we require that the ice-sheet fraction at each snapshot time
15
period is binary (although the model may interpolate between the snapshot values in-ternally). This results in some sharp gradients in the timeseries of ice-sheet fraction, in particular between 30 kyrBP and 21 kyrBP.
2.2 Simulations
Initially, we undertake equilibrium snapshot simulations every 3 kyr, beginning with
Ma-20
rine Isotope Stage III (MIS3, 30 kyrBP) and including the Last Glacial Maximum (LGM, 21 kyrBP), the mid-Holocene (6 kyrBP), and the pre-industrial (corresponding to ap-proximately 1860 AD). The LGM and mid-Holocene have traditionally been the time periods studied in paleoclimate modelling studies (e.g.Hewitt et al.,2001;Jost et al.,
2005;Texier et al., 2000). All the equilibrium simulations discussed in this paper are
25
initialised from a 20◦C isothermal and stationary ocean. We also carried out sensitivity studies (not shown) in which we initialised from various isothermal and spun-up states, and found no evidence of bistability.
CPD
2, 267–283, 2006 Transient simulations of the last 30 000 years D. J. Lunt et al. Title Page Abstract Introduction Conclusions References Tables Figures J I J I Back CloseFull Screen / Esc
Printer-friendly Version Interactive Discussion
EGU
We then carry out a 30 kyr transient simulation, initialised from the end-point of the MIS3 equilibrium simulation, and compare this with the equilibrium simulations. Fi-nally, we carry out a series of transient 30 kyr simulations in which we accelerate the boundary conditions by factors of 2, 5, and 10.
3 Results
5
3.1 Equilibrium simulations
We first compare our pre-industrial, LGM, and mid-Holocene equilibrium simulations with slab-ocean HadSM3 simulations carried out using identical orbital and ice-sheet boundary conditions, and similar greenhouse gas concentrations (Joos et al., 2004;
Kaplan et al., 2002). HadSM3 has a fully dynamic primitive equation atmosphere,
10
and is generally more complex than GENIE-1. Although a slab ocean model does not represent changes to ocean circulation, the large scale patterns of change from these simulations compare well with fully coupled simulations of the LGM and mid-Holocene, and with available surface observations.
In the pre-industrial simulation (not shown), GENIE-1 is in general too cold in the
15
tropics relative to HadSM3, and too warm at high latitudes. Similar biases are seen in an un-tuned version of the model which does not use the ENTS land-surface scheme. The climatology of that version improved significantly once an objective tuning exercise was carried out on model parameters such as the ocean diffusivity and scaled wind-stress (Hargreaves et al., 2004). Future work will involve tuning our model to both
20
modern and paleo climatologies.
Figure2shows the anomaly, relative to pre-industrial, in our LGM and mid-Holocene simulations, and in the equivalent HadSM3 simulations. The LGM anomalies are very similar in the two models. The largest difference between the two models is over the Fennoscandian ice-sheet, where our model underestimates the temperature change
25
CPD
2, 267–283, 2006 Transient simulations of the last 30 000 years D. J. Lunt et al. Title Page Abstract Introduction Conclusions References Tables Figures J I J I Back CloseFull Screen / Esc
Printer-friendly Version Interactive Discussion
EGU
mask in our model to remain constant, that of pre-industrial. In the original recon-struction (Peltier, 1994), and in the HadSM3 simulation, a large fraction of the LGM Fennoscandian ice-sheet is over regions which are ocean at the pre-industrial. This means that we have underestimated the extent of the LGM Fennoscandian ice-sheet. However, despite this, globally our model is more sensitive to the LGM boundary
con-5
ditions than HadSM3; the global mean temperature change, LGM - pre-industrial, is –4.7◦C compared to –3.7◦C in HadSM3. This appears to be due to the greater extent of LGM seaice in GENIE-1 compared to HadSM3, in particular in the Southern Ocean and North Pacific.
In mid-Holocene simulations, HadSM3 exhibits significant cooling in the tropics,
par-10
ticularly over Saharan Africa and South Asia. The reason for this cooling is an intensifi-cation of the African and Asian monsoons, which result in greater latent cooling due to availability of soil-moisture, and less insolation due to increased cloudiness (Texier et
al.,2000). The change in these regions is much weaker in our model. This is because our simplified atmosphere does not contain the necessary dynamics to have a
realis-15
tic monsoon even at the modern, let alone to simulate monsoon changes. However, both the forcing anomaly (mainly due to insolation changes) and the resulting climate change are relatively small at the mid-Holocene, and the RMS anomaly difference be-tween our model and HadSM3 is smaller at the mid-Holocene than at the LGM.
In summary, our model does a good job relative to a dynamical atmosphere in
re-20
sponding to boundary-condition changes which produce significant local effects, such as orography and ice-sheet changes, but as expected, does not simulate more complex changes such as atmospheric circulation, cloud-cover and precipitation.
These GENIE-1 equilibrium simulations can also be used to provide a guide as to how long it is necessary to spin-up paleoclimatic equilibrium simulations. Here, we
25
arbitrarily consider a simulation to be spun-up when the global annual-mean ocean surface (including seaice) temperature is within 0.1◦C of the value after 5000 years of simulation. Intercomparison of equivalent simulations with different initial conditions (not shown) indicates that for each time-period, it is the simulation which is initialised
CPD
2, 267–283, 2006 Transient simulations of the last 30 000 years D. J. Lunt et al. Title Page Abstract Introduction Conclusions References Tables Figures J I J I Back CloseFull Screen / Esc
Printer-friendly Version Interactive Discussion
EGU
with the warmest isothermal ocean (25◦C) which takes the longest to spin up. For the pre-industrial this is 2140 years, for the mid-Holocene 2110 years, for the LGM 2510 years, and for MIS3 2050 years.
3.2 Transient simulations
Here, we present and discuss the 30 kyr transient simulation, which is initialised at
5
the end of the MIS3 equilibrium simulation. As for the equilibrium simulations, the 30 kyr transient simulations with different initial conditions (not shown) converge, with no evidence of bistability.
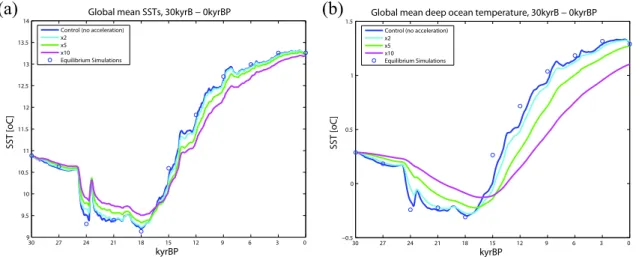
Figure 3a shows the global mean surface ocean temperature evolution in the tran-sient simulation. It has a form broadly similar to the prescribed CO2evolution, including
10
a minimum at 18 kyrBP. The figure also shows a comparison of the 30 kyr transient sim-ulation with the equilibrium simsim-ulations. It can be seen that the transient simsim-ulation is nearly always close to equilibrium (the largest deviation being 24 kyrBP, which occurs just after a sharp change in ice-sheet fraction). In particular, the LGM, mid-Holocene and pre-industrial are all very close to equilibrium. This is good news for model-data
15
comparisons, such as in the PMIP2 project, where the model is calculating an equilib-rium solution.
Figure 3a additionally shows the surface temperature evolution in 3 accelerated simulations, all of which are initialised at the end of the MIS3 equilibrium simula-tion. As expected, the greater the acceleration, the greater the error relative to the
20
non-accelerated simulation. The accelerated simulations behave in a damped fashion relative to the non-accelerated simulation, with a decrease in magnitude of temporal temperature gradient, but no corresponding phase-lag. The maximum error in global-annual mean surface temperature occurs in the ×10 simulation, at about 11 kyrBP. There is a secondary maximum in error at about 23 kyrBP. Both these occur after and
25
during periods of relatively rapid change in the boundary conditions, in particular the ongoing deglaciation between 15 kyrBP and 9kyrBP and the sharp increase in land-ice fraction between 24 and 23 kyrBP.
CPD
2, 267–283, 2006 Transient simulations of the last 30 000 years D. J. Lunt et al. Title Page Abstract Introduction Conclusions References Tables Figures J I J I Back CloseFull Screen / Esc
Printer-friendly Version Interactive Discussion
EGU
Figure 3b is similar but shows the deep ocean temperatures (approximately 5 km depth) rather than the surface. This illustrates the longer response time of the deep ocean, and the resulting smoother response to the changing boundary conditions. However, there appears to be no phase-lag relative to the upper ocean, and the min-imum deep-ocean temperature is also at 18 kyrBP. It also shows the correspondingly
5
larger relative error, and significant phase lag, which the acceleration technique in-troduces in the deep ocean. However, the transient simulation is still relatively close to equilibrium during the 30 kyr, except in the first part of the deglaciation, at 15 and 12 kyrBP (even here though, the disequilibrium is only of the order 0.3◦C in the global annual mean).
10
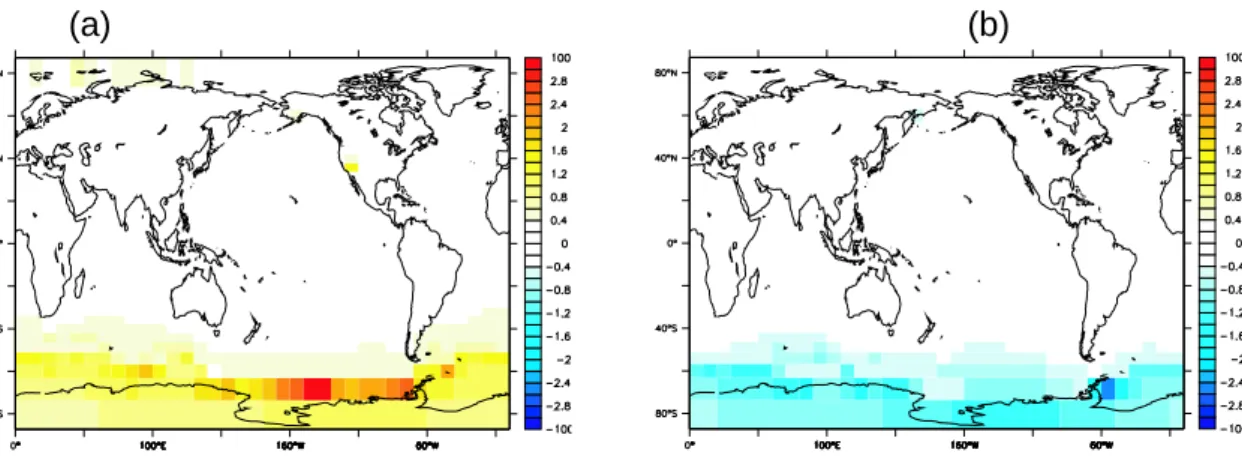
When comparing models to paleo data, the spatial distribution of surface tempera-ture is clearly more relevant than the global-annual mean surface temperatempera-ture which we have discussed so far. Figure4shows the spatial distribution of annual mean sur-face temperature difference in the ×10 simulation relative to the un-accelerated simu-lation, at the LGM and mid-Holocene. It is the Southern Ocean which is producing the
15
damping in the system in the accelerated simulations. In this region, the local surface temperature errors are of the order of 1 or 2◦C, being too warm during the cooling LGM and too cold during the warming mid-Holocene. This is the region with the greatest thermal inertia, due to the deep mixed-layer, and it reflects the slowly varying temper-ature of the deep ocean. Consequently, Antarctica also has a significant tempertemper-ature
20
error in the accelerated simulations. In contrast, the surface temperature in the North-ern Hemisphere is in fact very well simulated in the accelerated simulations.
4 Discussion and Conclusions
We have carried out equilibrium and transient simulations of the last 30 000 years. We find good agreement between our equilibrium simulations and previous work, although
25
our model is not complex enough to simulate dynamical effects such as changes to the monsoons. In our model, the time period from 30 kyrBP to pre-industrial is in very close
CPD
2, 267–283, 2006 Transient simulations of the last 30 000 years D. J. Lunt et al. Title Page Abstract Introduction Conclusions References Tables Figures J I J I Back CloseFull Screen / Esc
Printer-friendly Version Interactive Discussion
EGU
equilibrium with the ice-sheet, CO2, and orbital boundary conditions. This implies that the method of comparing equilibrium simulations with paleo data is not flawed in this respect.
Full complexity AOGCMs, such as the Met Office’s HadCM3, are currently too slow to carry out long transient simulations such as those presented in this paper. One way
5
of speeding up a transient simulation is to accelerate the boundary conditions, and so compress the length of a simulation. We find that the Southern Ocean and Antarctica are the regions most sensitive to this acceleration, where, for a ×10 acceleration, errors in the annual mean surface temperature are of the order 1–2◦C. However, the North-ern Hemisphere is relatively insensitive to the acceleration. This implies that when
10
comparing an accelerated AOGCM simulation to paleodata, the Northern Hemisphere comparison, for example North Atlantic SSTs from dinoflagellates (e.g.de Vernal et al.,
2005), is likely to be more robust than the Southern Hemisphere comparison, for ex-ample temperatures from Antarctic ice-cores (e.g.Petit et al.,1999). It also implies that transient simulations which aim to simulate processes in which the Southern Ocean
15
plays a significant role, for example biogeochemical processes, should not be acceler-ated.
Our experiments can also help to guide the spin-up strategy of potential GCM tran-sient simulations. Our results imply that a reasonable strategy would be to initially carry out an equilibrium simulation of the start-point of the transient, and to use this
20
as the initial condition for the transient. If this is done, then the results of the transient simulation can be considered spun-up after just a couple of decades.
However, this work neglects the effects of some shorter-timescale transient events such as Heinrich events (Heinrich,1998). These are events in which there is thought to be an interaction between climate and ice-sheets, which are not represented here.
25
Future work will investigate the effects of fresh-water pulses on these transient simu-lations, by coupling with an ice-sheet model (Payne, 1999), or by prescribing pulses which are consistent with the prescribed ice-sheet evolution.
CPD
2, 267–283, 2006 Transient simulations of the last 30 000 years D. J. Lunt et al. Title Page Abstract Introduction Conclusions References Tables Figures J I J I Back CloseFull Screen / Esc
Printer-friendly Version Interactive Discussion
EGU
system is close to equilibrium with prescribed ice sheet and atmospheric CO2 bound-ary conditions, assuming fixed vegetation. In fact the slow dynamics of ice sheets, the carbon cycle and other biogeochemical cycles mean that these components of Earth system and hence the climate may be considerably out of equilibrium with orbital forc-ing. This remains to be investigated in future work, in particular with a version of the
5
model being developed, which includes dynamic vegetation, ice-sheets (Payne,1999), and biogeochemistry (Cameron et al.,2005).
Work underway also includes comparison of our simulations with the paleo record, tuning of the model to the modern climate, and a study of the relative importance of the driving boundary conditions (ice-sheet, orbit, CO2) during the last 30 000 years.
10
Acknowledgements. This work was funded by the NERC e-Science program through the Grid
ENabled Integrated Earth system model (GENIE) project NER/T/S/2002/00217. We thank the NERC RAPID program for providing the computer resources on which these simulations were carried out.
References 15
Arnold, N. S., van Andel, T. H., and Valen, V. : Extent and idynamics of the Scandinavian icesheet during Oxygen Isotope Stage 3 (60 000–30 000 yr BP), Quaternary Res., 57, 38– 48, 2002. 271,280
Berger, A. : Long-term variations of caloric insolation resulting from the Earth’s orbital elements, Quaternary Res., 9, 139–167, 1978. 270
20
Cameron, D. R., Lenton, T. M., Ridgwell, A. J., Shepherd, J. G., Marsh, R., and Yool, A. : A fac-torial analysis of the marine carbon cycle controls on atmospheric CO2, Global Biogeochem. Cycles, 19, 2005. 277
Edwards, N. R. and Marsh, R. : Uncertainties due to transport-parameter sensitivity in an efficient 3-D ocean-climate model, Climate Dynamics, 24, 415–433, 2005. 270
25
Fanning, A. G. and Weaver, A. J. : An atmospheric energy-moisture model: Climatology, inter-pentadal climate change and coupling to an ocean general circulation model, J. Geophys. Res., 101, 15 111–15 128, 1996. 270
CPD
2, 267–283, 2006 Transient simulations of the last 30 000 years D. J. Lunt et al. Title Page Abstract Introduction Conclusions References Tables Figures J I J I Back CloseFull Screen / Esc
Printer-friendly Version Interactive Discussion
EGU
Hargreaves, J. C., Annan, J. D., Edwards, N. R., and Marsh, R. : Climate forecasting using an intermediate complexity Earth System Model and the Ensemble Kalman Filter, Climate Dynamics, 23, 745–760, 2004. 272
Heinrich, H. : Origin and consequences of cyclic ice rafting in the northeast Atlantic Ocean during the past 130 000 years, Quaternary Res., 29, 143–152, 1998. 276
5
Hewitt, C. D., Broccoli, A. J., Mitchell, J. F. B., and Stouffer, R. J. : A coupled model study of the last glacial maximum: Was part of the North Atlantic relatively warm?, Geophys. Res. Lett., 28, 1571–1574, 2001. 271
Hibler, W. D. : A dynamic thermodynamic sea ice model, J. Physical Oceanography, 9, 815– 846, 1979. 270
10
Jackson, C. S. and Broccoli, A. J. : Orbital forcing of Arctic climate: mechanisms of climate response and implications for continental glaciation, Climate Dynamics, 21, 539–557, 2003.
269
Joos F., Gerber, S., Prentice, I. C., Otto-Bliesner B. L., and Valdes, P. J. : Transient simula-tions of Holocene atmospheric carbon dioxide and terrestrial carbon since the Last Glacial
15
Maximum, Global Biogeochem. Cycles, 18, 2, 2004. 272
Jost, A., Lunt, D., Kageyama, M., Abe-Ouchi, A., Peyron, O., Valdes, P. J., and Ramstein, G. : High-resolution simulations of the last glacial maximum climate over Europe: a solution to discrepancies with continental paleoclimatic reconstructions?, Climate Dynamics, 24, 577– 590, 2005. 269,271
20
Joussaume, S. and Taylor, K. E. : Status of the Paleoclimate Modelling Intercomparison Project (PMIP), in: Proceedings of the first international AMIP scientific conference, 425–430, 1995.
268
Kaplan, J. O., Prentice, I. C., Knorr, W., and Valdes, P. J. : Modeling the dynamics of terrestrial carbon storage since the Last Glacial Maximum, Geo. Res. Lett., 22, 2002. 272
25
Lenton, T. M., Williamson, M. S., Edwards, N. R., Marsh, R., Price, A. R., Ridgwell, A. J., Shep-herd, J. G., and the GENIE team : Millennial timescale carbon cycle and climate change in an efficient Earth system model, Climate Dynamics, doi:10.1007/s00382-006-0109-9, 2006.
270
Lorenz, S. J. and Lohmann, G. : Acceleration technique for Milankovitch type forcing in a
cou-30
pled atmosphere-ocean circulation model: method and application for the Holocene, Climate Dynamics, 23, 727–743, 2004. 269
CPD
2, 267–283, 2006 Transient simulations of the last 30 000 years D. J. Lunt et al. Title Page Abstract Introduction Conclusions References Tables Figures J I J I Back CloseFull Screen / Esc
Printer-friendly Version Interactive Discussion
EGU
T. F., Morse, D. L., Barnola, J. M., Bellier, B., Raynaud, D., and Fischer, H. : Evidence for substantial accumulation rate variability in Antarctica during the Holocene, through syn-chronization of CO2 in the Taylor Dome, Dome C and DML ice cores, Earth and Planetary Science Letters, 224, 45–54, 2004. 270,271
Payne, A. J. : A thermomechanical model of ice flow in West Antarctica, Climate Dynamics, 15,
5
115–125, 1999. 276,277
Peltier, W. R. : Ice-age paleotopology, Science, 265, 195–201, 1994. 271,273,280
Petit, J. R., Jouzel, J., Raynaud, D., Barkov, N. I., Barnola, J. M., Basile, I., Bender, M., Chap-pellaz, J., Davis, J., Delaygue, G., Delmotte, M., Kotlyakov, V. M., Legrand, M., Lipenkov, V., Lorius, C., P ´epin, L., Ritz, C., Saltzman, E., and Stievenard, M. : Climate and
Atmo-10
spheric History of the Past 420 000 years from the Vostok Ice Core, Antarctica, Nature, 399, 429–436, 1999. 270,271,276
Semtner, A. J.: A model for the thermodynamic growth of sea ice in numerical investigations of climate, J. Physical Oceanography, 6, 379–389, 1976. 270
Texier, D., de Noblet, N., and Braconnot, P. : Sensitivity of the African and Asian Monsoons
15
to Mid-Holocene Insolation and Data-Inferred Surface Changes, J. Climate, 13, 164–181, 2000. 271,273
de Vernal, A., Eynaud, F., Henry, M., Hillaire-Marcel, C., Londeix, L., Mangin, S., Matthiessen, J., Marret, F., Radi, T., Rochon, A. Solignac, S., and Turon, J.-L. : Reconstruction of sea-surface conditions at middle to high latitudes of the Northern Hemisphere during the Last
20
Glacial Maximum (LGM) based on dinoflagellate cyst assemblages, Quaternary Sci. Rev., 24, 897–925, 2005. 269,276
Weaver, A. J., Eby, M., Weibe, E. C., Bitz, C. M., Duffy, P. B., Ewen, T. L., Fanning, A. F., Holland, M. M., MacFadyen, A., Matthews, H. D., Meissner, K. J., Saenko, O., Schmittner, A., Wang, H., and Yoshimori, M. : The UVic Earth system climate model: Model description,
25
climatology, and applications to past, present and future climates, Atmosphere-Ocean, 39, 361–428, 2001. 270
Williamson, M. S., Lenton, T. M., Shepherd, J. G., and Edwards, N. R : An efficient numerical terrestrial scheme (ENTS) for Earth system modelling, in press, Ecological Modelling.
CPD
2, 267–283, 2006 Transient simulations of the last 30 000 years D. J. Lunt et al. Title Page Abstract Introduction Conclusions References Tables Figures J I J I Back CloseFull Screen / Esc
Printer-friendly Version Interactive Discussion EGU
(a) (b)
30 27 24 21 18 15 12 9 6 3 0 1.8 2 2.2 2.4 2.6 2.8 3x 10⁴ Atmospheric CO2 concentration , 30kyrB 0kyrBP
kyrBP p p v 30 27 24 21 18 15 12 9 6 3 0 200 220 240 260 280 300 320
Mean orography , 30kyrB 0kyrBP
kyrBP m e tr e s
Peltier reconstruction (21 0 kyrBP) Our reconstruction (30 0 kyrBP) Arnold reconstruction (30 kyrBP)
Fig. 1. Time-evolution of boundary conditions over the 30 kyr simulated. (a) Atmospheric CO2
concentration [ppmv],(b) Global mean orography [m], showing our reconstruction, and that of
CPD
2, 267–283, 2006 Transient simulations of the last 30 000 years D. J. Lunt et al. Title Page Abstract Introduction Conclusions References Tables Figures J I J I Back CloseFull Screen / Esc
Printer-friendly Version Interactive Discussion
EGU
(a) (b)
(c) (d)
Fig. 2. Annual mean surface temperature relative to pre-industrial in (a) our LGM equilibrium
simulation,(b) our mid-Holocene equilibrium simulation, (c) an LGM HadSM3 simulation, and (d) a mid-Holocene HadSM3 simulation. Units are◦C.
CPD
2, 267–283, 2006 Transient simulations of the last 30 000 years D. J. Lunt et al. Title Page Abstract Introduction Conclusions References Tables Figures J I J I Back CloseFull Screen / Esc
Printer-friendly Version Interactive Discussion EGU 30 27 24 21 18 15 12 9 6 3 0 9 9.5 10 10.5 11 11.5 12 12.5 13 13.5 14
Global mean SSTs, 30kyrB − 0kyrBP
kyrBP
SST [
oC
]
Control (no acceleration) x2 x5 x10 Equilibrium Simulations 30 27 24 21 18 15 12 9 6 3 0 −0.5 0 0.5 1 1.5
Global mean deep ocean temperature, 30kyrB − 0kyrBP
kyrBP
SST [oC]
Control (no acceleration) x2
x5 x10
Equilibrium Simulations
(a) (b)
Fig. 3. (a) Temporal evolution of global-annual average ocean-surface temperature (◦C) in an ensemble of 30 kyr transient simulations. The colours represent different boundary-condition acceleration factors. The circles represent equilibrium simulations every 3 kyr. (b) shows the
same but for the deep ocean (approximately 5 km). Note the difference in scale between the two plots.
CPD
2, 267–283, 2006 Transient simulations of the last 30 000 years D. J. Lunt et al. Title Page Abstract Introduction Conclusions References Tables Figures J I J I Back CloseFull Screen / Esc
Printer-friendly Version Interactive Discussion
EGU (a) (b)
Fig. 4. Annual mean surface temperature in the ×10 accelerated 30 kyr simulation, relative to
![Fig. 1. Time-evolution of boundary conditions over the 30 kyr simulated. (a) Atmospheric CO 2 concentration [ppmv], (b) Global mean orography [m], showing our reconstruction, and that of (Peltier, 1994) and (Arnold et al., 2002) for comparison.](https://thumb-eu.123doks.com/thumbv2/123doknet/14794977.603323/15.918.50.682.170.426/evolution-conditions-simulated-atmospheric-concentration-orography-reconstruction-comparison.webp)