HAL Id: hal-02934738
https://hal.archives-ouvertes.fr/hal-02934738
Submitted on 10 Sep 2020
HAL is a multi-disciplinary open access
archive for the deposit and dissemination of
sci-entific research documents, whether they are
pub-lished or not. The documents may come from
teaching and research institutions in France or
abroad, or from public or private research centers.
L’archive ouverte pluridisciplinaire HAL, est
destinée au dépôt et à la diffusion de documents
scientifiques de niveau recherche, publiés ou non,
émanant des établissements d’enseignement et de
recherche français ou étrangers, des laboratoires
publics ou privés.
Distributed under a Creative Commons Attribution - NoDerivatives| 4.0 International
India-Asia Convergence to Pacific Subduction
Laurent Jolivet, Claudio Faccenna, Thorsten Becker, Magdala Tesauro, Pietro
Sternai, Pierre Bouilhol
To cite this version:
Laurent Jolivet, Claudio Faccenna, Thorsten Becker, Magdala Tesauro, Pietro Sternai, et al.. Mantle
Flow and Deforming Continents: From India-Asia Convergence to Pacific Subduction. Tectonics,
American Geophysical Union (AGU), 2018, 37 (9), pp.2887-2914. �10.1029/2018TC005036�.
�hal-02934738�
Mantle Flow and Deforming Continents: From India-Asia
Convergence to Paci
fic Subduction
Laurent Jolivet1 , Claudio Faccenna2 , Thorsten Becker3,4,5 , Magdala Tesauro6, Pietro Sternai7 , and Pierre Bouilhol8
1
Sorbonne Université, CNRS-INSU, Institut des Sciences de la Terre Paris, ISTeP UMR 7193, Paris, France,2Dipartimento Scienze, Università Roma Tre, Rome, Italy,3UTIG, University of Texas at Austin, Austin, TX, USA,4DGS, University of Texas at
Austin, Austin, TX, USA,5JSG, University of Texas at Austin, Austin, TX, USA,6Dipartimento di Matematica e Geoscienze, Universita degli studi di Trieste, Trieste, Italy,7Department of Earth Sciences, University of Geneva, Geneva, Switzerland, 8
C.R.P.G., Université de Lorraine, Vandoeuvre-les-Nancy, France
Abstract
The formation of mountain belts or rift zones is commonly attributed to interactions between plates along their boundaries, but the widely distributed deformation of Asia from Himalaya to the Japan Sea and other back-arc basins is difficult to reconcile with this notion. Through comparison of the tectonic and kinematic records of the last 50 Ma with seismic tomography and anisotropy models, we show that the closure of the former Tethys Ocean and the extensional deformation of East Asia can be best explained if the asthenospheric mantle transporting India northward, forming the Himalaya and the Tibetan Plateau, reaches East Asia where it overrides the westwardflowing Pacific mantle and contributes to subduction dynamics, distributing extensional deformation over a 3,000-km wide region. This deep asthenosphericflow partly controls the compressional stresses transmitted through the continent-continent collision, driving crustal thickening below the Himalayas and Tibet and the propagation of strike-slip faults across Asian lithosphere further north and east, as well as with the lithospheric and crustalflow powered by slab retreat east of the collision zone below East and SE Asia. The main shortening direction in the deforming continent between the collision zone and the Pacific subduction zones may in this case be a proxy for the direction of flow in the asthenosphere underneath, which may become a useful tool for studying mantleflow in the distant past. Our model of the India-Asia collision emphasizes the role of asthenosphericflow underneath continents and may offer alternative ways of understanding tectonic processes.Plain Language Summary
The collision of India with Asia has induced the propagation of continent-scale faults to large distances from the Himalayas, all the way to the margins of Asia where back-arc basins, such as the Japan Sea, formed above the subductions of the Pacific and Indian Oceans. The respective roles of collision and subduction in controlling the deformation of Asia at such long distances are not well understood. Based on a comparison of kinematic trajectories of lithospheric plates and blocks since 50 Ma with mantleflow directions inferred from seismological data, we propose that the connection between collision and back-arc extension is made by the asthenosphereflowing underneath. This flowing mantle comes from an upwelling zone below South Africa and has pushed India inside Asia along more than 3,000 km after thefirst collision. The flow then invaded Asia all the way to the subduction trenches where it followed the retreat of the subducting lithospheres, controlling the geometry and kinematics of the major strike-slip faults and back-arc basins. This possible control of continental deformation by the asthenosphere flowing underneath is a different view of continental deformation and may offer a way of studying mantle flow below continents in the distant past.1. Introduction
Since the early days of the continental drift theory, the question of the engine of surface displacements and formation of rifts or mountain belts has been discussed in terms of mantle convection (Griggs, 1939; Holmes, 1931; McKenzie, 1969; Runcorn, 1962; Wilson, 1973). More recent models have shown that mantleflow and slab suction are important ingredients to explain plate kinematics (Conrad & Lithgow-Bertelloni, 2002) but deformation within plates is rarely considered in these models (Dal Zilio et al., 2017; Faccenna, Becker, Conrad, et al., 2013; Faccenna, Becker, Jolivet, et al., 2013; Jolivet et al., 2009; Yamato et al., 2013). Yet we know that different styles of convection may have significant consequences for the dynamics of mountain belts. For
Tectonics
RESEARCH ARTICLE
10.1029/2018TC005036 Key Points:
• Coeval India-Asia collision and Pacific back-arc extension explained by asthenosphericflow
• Mantle flow correlates with long-term kinematics from India to Pacific border
• Indian mantle reaches Pacific border and Asian lithosphere spreads above ponding slabs Supporting Information: • Supporting Information S1 Correspondence to: L. Jolivet, [email protected] Citation:
Jolivet, L., Faccenna, C., Becker, T., Tesauro, M., Sternai, P., & Bouilhol, P. (2018). Mantle Flow and Deforming Continents: From India-Asia Convergence to Pacific Subduction. Tectonics, 37, 2887–2914. https://doi. org/10.1029/2018TC005036 Received 26 FEB 2018 Accepted 1 AUG 2018
Accepted article online 7 AUG 2018 Published online 6 SEP 2018
©2018. The Authors.
This is an open access article under the terms of the Creative Commons Attribution-NonCommercial-NoDerivs License, which permits use and distri-bution in any medium, provided the original work is properly cited, the use is non-commercial and no modifications or adaptations are made.
instance, whether slabs enter the lower mantle or not leads to orogens controlled by slab-pull or slab suction and the transition between the two styles of subduction can lead to large-scale obduction (Faccenna, Becker, Conrad, et al., 2013; Faccenna, Becker, Jolivet, et al., 2013; Husson et al., 2012; Jolivet et al., 2016). Although it was shown that the mantleflow induced by slab retreat is able to impose shearing conditions at the base of the overriding plate and controls deformation in the back-arc region (Capitanio, 2014; Capitanio et al., 2015; Chen et al., 2016; Faccenna et al., 2006; Jolivet et al., 2009; Menant, Sternai, et al., 2016; Sternai et al., 2014), at larger scale, few tectonic models explain crustal deformation considering a possible drag by underlying cur-rents (Conrad & Lithgow-Bertelloni, 2006; Ghosh et al., 2013; Koptev et al., 2015, 2016; Stoddard & Abbott, 1996). The simple observation that the India-Asia collision has not stopped the northward motion of India, despite the absence of a well-defined deep slab below Tibet, demonstrates that other forces than slab-pull should be considered (Alvarez, 2010; Becker & Faccenna, 2011; Becker & O’Connell, 2001; Faccenna, Becker, Conrad, et al., 2013; Warners-Ruckstuhl et al., 2010).
The case of the deformation of East Asia is particularly significant in this regard. Since the collision with India, the Asian lithosphere has been deforming across a wide region from the Himalaya to the Pacific and Indian Oceans subduction zones (Jolivet et al., 1994; Kimura & Tamaki, 1986; Royden et al., 2008; Tapponnier et al., 1982, 2001). Crustal shortening in the vicinity of the collision zone gave rise to the Himalaya and the Tibetan Plateau, but deformation is observed at large distance in the form of large-scale strike-shear zones and faults, controlling the opening of rifts (e.g., Baikal rift) and back-arc basins (Japan Sea, South China Sea; Jolivet et al., 1994; Kimura & Tamaki, 1986; Tapponnier et al., 1982, 2001). The dynamic interactions between collision and back-arc opening, and thus subduction, have never received a proper explanation, since most models con-sider the eastern margin of Asia as a simple free boundary.
Here we show that the tectonic history of eastern Asia can be explained if theflow of asthenospheric mantle carrying India northward reaches the eastern and southeastern margins of Asia and interacts with the Pacific and Indian slabs. Based on a comparison of long-term kinematic trajectories, inferred stressfield and seismic anisotropy, we show that the large-scale deformation of Asia can be explained by the coeval continent-continent collision in the Himalaya-Tibet region and slab retreat east and southeast of Asia. These two regions are connected by the asthenospheric mantleflowing underneath, from the collision zone to back-arc regions.
2. Geodynamic Setting
The far-field deformation of Asia during the collision with India (Figure 1) and more specifically the relations between shortening in the Himalaya and opening of back-arc basins at the periphery of the system (Jolivet et al., 1994; Tapponnier et al., 1982) poses the question about the nature of the interactions between these two distant convergence zones. Compressional deformation naturally characterizes the region close to the India-Asia collision zone (Himalaya and Tibet; Royden et al., 2008; Tapponnier et al., 2001), and gravitational forces stored in the thick crust of Tibet largely control the kinematics of convergence since the time of colli-sion (Copley et al., 2010). On the other hand, large-scale strike-slip faulting (Molnar & Tapponnier, 1975) and extension are characteristics of a wide domain encompassing most of eastern Asia (Jolivet et al., 1994; Tapponnier et al., 1982; Yin, 2010; Figures 1 and 2). Furthermore, deformation related to collision is asymme-trically distributed and shifted eastward toward the Pacific margin (Davy & Cobbold, 1988; Dewey et al., 1989; Tapponnier et al., 1982). Previous studies have often not considered that
i A large part of East and Southeast Asia rests on a thin and hot lithosphere that extends westward of the western Pacific trench and northward of the Sunda trench, as far as the Mongolian Plateau where Cenozoic volcanism has been widespread since 30 Ma (Hunt et al., 2012; Smith et al., 2016; Steinberger & Becker, 2016; Tesauro et al., 2013; Windley & Allen, 1993; Yu et al., 2017).
ii Back-arc extension above the Pacific subduction zone has been active between at least 50 and 10 Ma (Figure 2), interfering with collision-related deformation during this period (Fournier et al., 2004; Jolivet et al., 1990, 1994). Back-arc extension above the Sunda subduction zone started earlier in the Paleogene forming a series of distributed rifts and oceanic basins, including the largest of them, the South China Sea (Hall, 2002; Pubellier & Morley, 2014; Rangin et al., 1990) that formed in the same period as the Japan Sea.
iii Back-arc basins have formed within the Philippine Sea Plate (PHSP) since the Paleogene until the Present during its northward movement, forming the West Philippine Basin, the Shikoku-Parece Vela Basin, and the Mariana Basin (Chamot-Rooke et al., 1987; Hall, 2002; Lallemand, 2016).
Figure 1. (a) The main tectonic features of the Cenozoic Eurasia. The map also shows the extent of a high P-velocity anomaly in the lower mantle (1,100 km) below India and Southeast Asia (Hall & Spakman, 2015; Replumaz et al., 2004). This anomaly shows the position of the subducted Tethyan slab and the difference between India that has overpassed its slab and Southeast Asia where slab retreat has occurred. Thisfigure shows that the whole eastern part of Asia has been extended, leading to extreme lithospheric thinning and formation of oceanic crust in western Pacific back-arc basins (Jolivet et al., 1999). AB = Anatolian Block; AS-RV SZ = Ailao Shan-Red River Shear Zone; ATF = Altyn Tagh Fault; BR = Baikal Rift; EAR = East African Rift; IBT = Izu-Bonin Trench; JS = Japan Sea; JT = Japan Trench; MT = Mariana Trench; OB = Okinawa Basin; PVB = Parece Vela Basin; SB = Shikoku Basin; SCS = South China Sea; SH SZ = Sakhalin-Hokkaido Shear Zone; ST = Sunda Trench; WPB = West Philippine Basin. The white arrow shows the point where the deep mantle velocity anomaly (Tethyan slab) crosses the Sunda Trench indicating the transition along strike from advancing to retreating subduction. (b) Lithospheric thickness map after Tesauro et al. (2013) and the main tectonic features of the Tethys convergence zone. This map illustrates the thinning of the lithosphere below East Asia. White arrows show the escape of continental blocks with opposite sense in the eastern Mediterranean region and eastern Asia.
10.1029/2018TC005036
Figure 2. Tectonic maps of Asia and the western Pacific. (a) Present-day; (b) a schematic reconstruction at 25 Ma. This reconstruction is based on Torsvik and Cocks (2016) for the motion of large plates with modifications in back-arc regions (Barckhausen et al., 2014; Jolivet et al., 1989, 1994; Pubellier & Morley, 2014; Rangin et al., 1999, 2013). AS RV SZ = Ailao Shan-Red River Shear Zone; LMS = Long Men Shan; OB = Okinawa Basin; SH SZ = Sakhalin-Hokkaido Shear Zone; SPVB = Shikoku-Parece Vela Basin; WPB = West Philippine Basin.
The progressive collision process can be summarized as follows: at ~50 Ma, the Neo-Tethys Ocean closed and the Indian continental lithosphere started to subduct (Bouilhol et al., 2013; van Hinsbergen et al., 2011). The geometry of the initial contact is unknown, but the subduction zone could have been rather straight if con-sidering the present-day shape of the high velocity anomaly in the lower mantle representing the lost Tethys Ocean (Figure 1a; Replumaz et al., 2004). Since that time, India has progressed northward more than 3,000 km and the Himalayas and the Tibetan Plateau have progressively developed above the continental subduction zone (Royden et al., 2008; Tapponnier et al., 2001). Within the Tibetan Plateau, active deformation is currently partitioned between strike-slip faulting and E-W extension (Molnar & Lyon-Caen, 1989; Royden et al., 2008; Tapponnier et al., 2001). Furthermore, earthquake focal mechanisms and the GPS velocityfield show an extrusion of crustal material toward the east and southeast with a progressive decrease of velocities (Molnar & Lyon-Caen, 1989; Zhang et al., 2004). How far this pattern can be traced back in time is unknown, but extension started at least between 13 and 18 Ma ago (Coleman & Hodges, 1995; Williams et al., 2001). This timing shows that since the Middle Miocene at least, body forces stored in the thick crust of Tibet have been competing with the boundary forces originating from India-Asia convergence and that the plateau was already at high elevation. Thermochronological studies suggest that the growth of the plateau started early, since 35 Ma or earlier (Rohrmann et al., 2012; van der Beek et al., 2009). The plateau has indeed formed pro-gressively with constant denudation rates since at least 35 Ma, only 15 Ma after thefirst collision or even since the Late Cretaceous.
The 25 Ma schematic reconstruction of Figure 2b is based on Torsvik and Cocks (2016) and modified for back-arc basins using Jolivet et al. (1989, 1994), Rangin et al. (1990), Pubellier and Morley (2014), Hall, Ali, and Anderson (1995), Hall, Ali, Anderson, and Baker (1995), and Hall (2002). Outside the collision zone, the defor-mation of the Asian lithosphere is less distributed and large-scale strike-slip faults have formed, such as the Ailao-Shan Red River Shear Zone (Figures 1 and 2), accommodating the eastward escape of continental blocks, such as Indochina. Although the exact amount of left-lateral displacement along the Ailao Shan-Red River Shear Zone is a point of debate and is not known with precision (from 100 to 1,000 km; Dewey et al., 1989; Huchon et al., 1994; Tapponnier et al., 1982, 1990), these faults are the most prominent structures seen outside the Tibetan Plateau, apart from those of the Baikal Rift and Tien Shan Range. These faults connect the compressional domain in the collision zone with the extensional domain along the Pacific margin. The India-Asia collision thus induced the formation of large-scale lithospheric faults that diverge from the contact with the indenter (Molnar & Tapponnier, 1975; Tapponnier & Molnar, 1977), and consequently the displace-ment of lithospheric blocks eastward and south-eastward. During the same period, a series of large dextral shear zones, such as the Sakhalin-Hokkaido Shear Zone (Figures 1 and 2), formed in East Asia, conjugate of the left-lateral ones. These dextral faults interfered with the opening of back-arc basins, such as the Japan and Okhotsk Sea or the Bohai Basin (Fournier et al., 2004; Jolivet et al., 1990, 1991, 1994; Lallemand & Jolivet, 1985; Yin, 2010). The Sakhalin-Hokkaido Shear Zone (Jolivet, 1986; Jolivet et al., 1994; Lallemand & Jolivet, 1985) forms the western boundary of the relatively rigid Okhotsk block, which has been active under transpressional dextral shear since the Oligocene. It has also been interpreted as the active boundary between the North American and Eurasia plates south of the rotation pole located in East Siberia (Chapman & Solomon, 1976). Since the present paper concerns mainly the Oligo-Miocene period, we will use the name Sakhalin-Hokkaido Shear Zone in the following.
Continent-continent collision induces compressional stresses that diverge from the collision zone, transmit through the rigid lithosphere, and progressively decrease away toward the extending eastern boundaries of Asia. This asymmetrical distribution of deformation is classically explained by the concept of a free bound-ary along the eastern margin of Asia, which allows the motion of lithospheric blocks accommodating the indentation of India into Asia (Jolivet et al., 1990; Kimura & Tamaki, 1986; Tapponnier et al., 1982). The general geometry is compatible with the different models proposed so far, rigid-plastic indentation and slip-linefield theory (Molnar & Tapponnier, 1975; Tapponnier & Molnar, 1976) or propagating extrusion models (Tapponnier et al., 1982). Analogue indentation models scaled for gravity (Cobbold & Davy, 1988; Davy & Cobbold, 1988; Jolivet et al., 1990) indeed induce the formation of a conjugate set of sinistral and dextral strike-slip faults that connect the collision zone with the free boundary to the east. When adding a compo-nent of extension using a gravitationally unstable lithosphere that spreads under its own weight (Fournier et al., 2004), the deformation is less localized, but the overall geometry is preserved, with the addition of a wide domain of distributed extension in Southeast Asia. However, in these models, there is no subduction
10.1029/2018TC005036
east of the collision zone and they do not account for any possible mantle flow contribution to the deformation.
In fact, the extensional component in Southeast and Northeast Asia is driven by slab retreat and returnflow east of the collision zone (Jolivet et al., 1994; Sternai et al., 2016). Based on analogue modeling, Schellart et al. (2003) proposed that noncylindrical rollback of the subduction zone can explain the link between back-arc rifting and the formation of the dextral shear zone separating the Okhotsk and Japan Sea, but in this case no link with the larger-scale deformation of Asia was taken into account. Yin (2010) proposed that the dextral component observed during back-arc rifting was due to the obliquity of the Pacific subduction but, again, no link with collision was made. The interactions between subduction dynamics and far-field effects of the India-Asia collision thus remain poorly understood.
It has also been shown that theflowing asthenospheric mantle, beside a possible drag effect through basal shear on large surfaces (Bird, 1998), can generate a force in presence of topographic irregularities of the lithosphere-asthenosphere boundary (LAB), which induces deformation in the continent above (Conrad & Lithgow-Bertelloni, 2006; Ghosh et al., 2013; Koptev et al., 2015; Stoddard & Abbott, 1996). We now explore this hypothesis for the case of Cenozoic Asia and the mantleflowing underneath, until the peri-Pacific sub-duction zones, through the comparison of the long-term (50 Ma) kinematics of the convergence zone, litho-spheric thickness, mantle fabric (seismic anisotropy), and slab geometries.
We assume that long-term kinematic trajectories reveal thefirst order flow of lithospheric material and that seismic anisotropy is a proxy for the mantle strain, and thusflow. We compare kinematic trajectories with dif-ferent sets of seismic anisotropy constraints (SKS-splitting and surface waves) and discuss the observed simi-larities and differences. We use the geometry of slabs, from the Himalayan slab to the Pacific and Indian slabs, to infer the direction of the mantleflow. Based on the last observations, we propose a scenario that fits the succession of the tectonic events and the stressfield data and discuss the implications in terms of coupling between mantleflow and crustal deformation.
3. Kinematic Trajectories
We calculate long-term (50 Ma) kinematic trajectories with GPlates (Boyden et al., 2011) based on the abso-lute model of Torsvik and Cocks (2016), the Global Hybrid Mantle Reference Frame (GHMRF), which is based on the absolute motion model (moving hot spots) of Doubrovine et al. (2012) and the palaeomagnetic refer-ence frame corrected for true polar wander (Torsvik et al., 2012; Figure 3a). These trajectories show a rather simple long-term motion, with India and Africa moving NNE and a progressive clockwise rotation of theflow toward the eastern margin of Asia, where it meets the westward Pacific flow. On such a long time period, one may assume that the effects offirst order, large-scale processes (several thousands of kilometers) on mantle fabrics dominate over more local kinematic changes. For instance, the recent (~10 Ma) change of stress regime around Japan from extension to compression (Becker et al., 2006; Ingle, 1992; Jolivet et al., 1994) has been associated with smallfinite displacement and is not representative of the long-term tectonic evolu-tion of this region characterized by back-arc rifting and spreading. The choice of 50 Ma as a starting point is based on two main considerations: We want to span a period long enough to have a stable fabric in the man-tle (Becker et al., 2006) and we know that plate motions have not significantly changed since the time of the abrupt change in the kinematics of the Pacific Plate between 53 and 47 Ma (Seton et al., 2015).
Wefirst explored the effects of several plate motion reference frames on the kinematic trajectories (Figures 3 and S1). We modified the model by Seton et al. (2012) and Zahirovic et al. (2015) to incorporate local recon-struction features in the Mediterranean region (Jolivet et al., 2003; Menant, Jolivet, & Vrielynck, 2016) and eastern Asia (Jolivet et al., 1991, 1994). Trajectories between 50 Ma and the present were calculated in three reference frames,fixed Eurasia, fixed Atlantic and Indian Ocean hot spots, and fixed Antarctica. Two models are in an absolute reference frame, with either a mantle reference (Atlantic and Indian Oceans hot spotsfixed; Seton et al., 2012; Zahirovic et al., 2015) or the GHMRF reference frame (Torsvik & Cocks, 2016; Figure S1). Models in the absolute reference frames show similar patterns with a dominant component of northward motion of Africa and India, an eastward motion of Eurasia and westward motion of the Pacific Plate. These models differ mostly for slow plates (Eurasia and Africa). A reasonablefit with seismic anisotropy is obtained with the mantle-fixed frameworks, and we finally chose the GHMRF model (Figure 3b). As we will discuss in
section 5, the best match is observed below northeast Asia that is supported by a thin lithosphere and below India that is moving fast, driven by the northward mantleflow.
The trajectories that we obtained provide an image of theflux of crust and mantle lithosphere since 50 Ma. Figure 3a shows these trajectories plotted over a map of seismic velocity anomalies in the lower mantle (2,800 km) from the composite model of Becker and Boschi (2002). It shows the two large low shear velocity provinces below West and South Africa (Tuzo in Burke, 2011) and below the Pacific Ocean (Jason) and the high velocity anomaly in between, below the West Pacific subduction zones. The long-term trajectories of
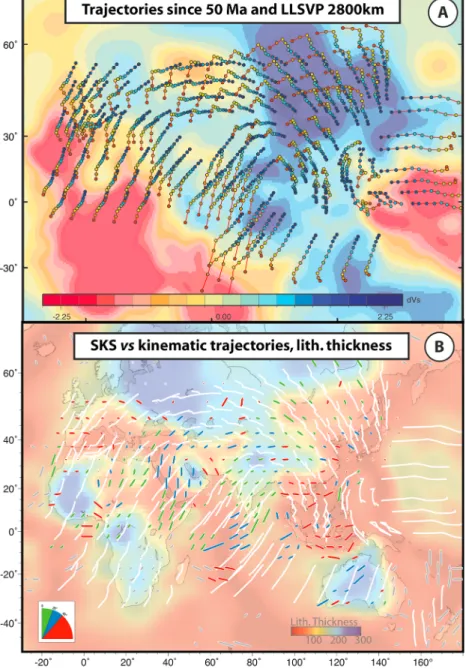
Figure 3. (a) Kinematic trajectories since 50 Ma (one step every 5 Ma, from red to blue) on top of the S-wave velocity anomalies of the lower mantle (LLSVP at 2,800 km) after Becker and Boschi (2002). (b) Lithospheric thickness map after Steinberger and Becker (2016) and kinematic trajectories since 50 Ma in an absolute kinematic reference frame based on paleomagnetism, calculated after Torsvik and Cocks (2016). The samefigure also shows the smoothed distribution of SKS fast splitting directions on top of lithospheric thickness. The color code of smoothed SKS fast splitting direction indicate the angle with the long-term kinematic trajectories (green 0–20°, blue 20–40°, red above 40°). This figure shows that both asthenosphericflow (through the seismic anisotropy proxy) and kinematic trajectories suggest a mantle flow diverging away from the Tuzo LLSVP with a main direction toward the north and northeast.
10.1029/2018TC005036
Africa, India, and Eurasia show aflow away from Tuzo toward the West Pacific subduction zones, suggesting a simple connection with the large-scale mantle convection (i.e., the conveyor belt; Becker & Faccenna, 2011).
4. Lithospheric Thickness
The pattern of lithospheric thickness is a stable feature for several methods used, as shown by the compar-ison of two models (Steinberger & Becker, 2016; Tesauro et al., 2013; Figures 1b and 3b). In afirst approach (Tesauro et al., 2013), the temperature of the lithosphere on a global scale was estimated from the inversion of a recent seismic tomography model (Ritsema et al., 2011), using a mineral-physics approach (Cammarano et al., 2003). This approach consists of calculating the anharmonic velocities at given pressure and tempera-ture conditions by estimating density and the anharmonic moduli,first in temperature and then, along an adiabat, in pressure. The composition used is representative for the mantle lithosphere over large areas, such as Proton-Archon in the cratons (Griffin et al., 2003), which is depleted in iron content, and PrimitiveMantle (McDonough & Sun, 1995) outside the craton. The effect of anelasticity was taken into account using the homologous temperature scaling approach, since large uncertainties exist in estimates of activation enthalpy (Karato, 1993). The depth of the thermal LAB displayed in Figure 1b has been estimated from a global thermal model (Tesauro et al., 2013), as the depth of the 1200 °C isotherm, intermediate between the 1300 °C (mantle solidus temperature) and 1100 °C (0.85 of the mantle solidus temperature) isotherm (Artemieva & Mooney, 2001). Such a choice is justified by the fact that mechanical properties of the mantle may change gradually in the vicinity of the solidus. Therefore, no sharp boundary between the mechanically weak lithosphere and the asthenosphere (LAB) possibly exists (Cammarano et al., 2003).
The second lithospheric thickness model (Steinberger & Becker, 2016; Figure 3b) is based on the depth-variation of seismic velocity anomalies from tomographic models. A reference, half-space cooling type of depth dependence is assumed to control the thermal contribution to velocity anomalies, and then an effec-tive thermal lithospheric thickness is derived after correction for a compositional contribution, which is of particular importance in the continents. Steinberger and Becker (2016) explore the uncertainties involved in this approach and compare thickness estimates from their approach with those obtained using other con-straints. Here we use their mean model of lithospheric thickness, which is based on averaging the estimates from several recent, global shear wave tomography models, with a correction for mismapped thickness due to Wadati-Benioff zones. In these two maps (Figures 1b and 3b), thickness gradients are different but the main features are preserved in both models.
The main observation from these maps is that the extended and thin lithosphere of East and Southeast Asia lies over the leading edge of the southeastward lithosphericflow (Figures 3 and 4). This situation is reminis-cent of the evolution of the African Plate since the Paleozoic with the rifting and detachment above the northward mantleflow of continental ribbons that then crossed the Tethys Ocean until they finally collided with the southern margin of Eurasia (Jolivet et al., 2016).
5. Seismic Anisotropy
In order to compare long-term displacement trajectories with inferred mantleflow, we use seismic anisotropy as a proxy for mantle deformation, assuming that mantle peridotites are stretched parallel to shearing direc-tion. Azimuthal seismic anisotropy refers to the dependence of seismic velocity on the azimuth of wave pro-pagation, a property acquired by rocks through their deformation. Different ways of measuring this anisotropy are available and we use two of them in this paper. (1) The widely used SKS-splitting method uses local measurements of the direction and delay of the maximum velocity difference between polarized com-ponents of a seismic wave traveling in an anisotropic medium (Savage, 1999). (2) Anisotropy can also be extracted from global tomographic models; here we use a recent global shear speed anisotropy model (Schaeffer et al., 2016; Schaeffer & Lebedev, 2013), SL2013sv hereafter. Rather than giving a direct image of mantleflow, seismic anisotropy is rather a proxy for deformation as the signal depends upon rock fabrics (e.g., Long & Becker, 2010). We will assume that the deformation in the mantle is close to plane strain and that theflow is close to horizontal. Neglecting vertical deformation, the azimuth of the fast direction is then par-allel to the shearing direction in map view.
Comparing surface (crustal) deformation and seismic anisotropy in the mantle (Figures 3b and 4) allows dis-cussing the degree of coupling between crustal and mantle strain pattern (Chen et al., 2016; Faccenna et al.,
2014; Faccenna & Becker, 2010; Flesch et al., 2005; Jolivet et al., 2009; Little et al., 2002; Tikoff et al., 2004). The SL2013sv anisotropy model allows visualizing the stratification of azimuthal anisotropy, while SKS-waves show more local anisotropy averaged over the whole thickness of the mantle below the station. Most authors consider that seismic anisotropy is due to shearing between the moving rigid lithosphere and the viscous asthenosphere (Flesch et al., 2005; Lavé et al., 1996), assuming that the asthenosphere responds passively. For instance, Flesch et al. (2005) or Wang et al. (2008) show a vertically coherent deformation below Tibet, from the crust to the mantle, and they conclude that the lithospheric mantle has survived
Figure 4. SL2013sv azimuthal anisotropy (colored bars) from Schaeffer and Lebedev (2013) at 100 (a) and 200 km (b) depth. These plots show a distinct change between 100 and 200 km. Green, blue, and red colors show the quality of thefit (from best to poorest, same code as in Figure 3) of seismic anisotropy and kinematic trajectories. At 100 km, the fast velocity pattern shows close correspondence with crustal features and a north-south direction predominates in Southeast Asia, compatible with the expected direction of slab retreat behind the Java Trench in the low-velocity domain. At 200 km, the whole of East and Southeast Asia shows a SW-NE main direction suggesting a continuation of theflow carrying India northward. Inset in Figure 3a shows the velocityfield obtained in a numerical model of continent-continent collision (Sternai et al., 2016).
10.1029/2018TC005036
orogenic processes as it can transmit crustal buoyancy forces downward. If one instead assumes that part of the deformation is driven from below by the viscous asthenosphere, the presence of a passively deforming mantle is no longer required. More detailed approaches of the stratification of anisotropy below Tibet show a different behavior at lithospheric and asthenospheric depths interpreted as differentflow directions (Agius & Lebedev, 2017; Huang et al., 2017).
We used two sets of azimuthal seismic anisotropy observations (Figures 3b and 4), (1) a compilation of SKS-splitting anisotropy (Becker et al., 2012) and (2) the tomographic model SL2013sv (Schaeffer et al., 2016; Schaeffer & Lebedev, 2013). We further compared SL2013sv with the model of Debayle et al. (2016) and found that differences in azimuthal anisotropy are overall moderate, at least in terms of directions, implying that the observed patterns are robust.
The patterns of SKS-splitting anisotropy and SL2013sv (Figures 3b and 4) are different, because the resolu-tions of the two methods are different and likely also because they sample different processes and different depths (e.g., Becker et al., 2012). However, some similarities can be observed when comparing smoothed SKS fast splitting orientations and SL2013sv. We assess thefit between the different observations by measuring the angle between the orientations and indicate the range of angles with different colors of symbols (green for angles between 0° and 20°, blue for angles between 20° and 40°, and red for angles greater than 40°). The 100-km depth anisotropy map for SL2013sv (Figure 4a) shows a good match with SKS below continental regions with thin lithosphere (Figure S3). In particular, there is a goodfit in the Mediterranean, Middle East, part of North and East Africa, part of India, and Northeast Asia, while thefit is reasonable below Tibet. At 200 km (Figure 4b), the Mediterranean region, North and east Africa, and part of India still show a good to fairfit (Figure S3), but Tibet and Northeast Asia show very different trends. Southeast Asia shows a poor match at both depth ranges. When considering a depth of 25 km below the LAB (Figures 5b and S4–S6), the two models of lithospheric thickness show a similarfit of SL2013sv anisotropy and SKS-splitting direction tofirst order. The northeastern part of Africa, Arabia, India, northeast Asia, and part of the Indian Ocean and Tibetan Plateau show a good or fairfit.
The bestfit of SL2013sv anisotropy and SKS fast splitting orientations is thus below regions of thin lithosphere and at shallow depth, either 100 or 25 km below LAB (Figures 5 and S3). One notable exception is below SE Asia where the two sets of data give perpendicular directions, except at 200 km.
6. Comparing Seismic Anisotropy and Long-Term Kinematic Trajectories
We now compare seismic anisotropy and long-term kinematic trajectories, which shows different results when using either SKS or SL2013sv. For SKS-splitting anisotropy (Figure 3b), thefit is good (green symbols) or reasonable (blue symbols) below India and part of the Indian Ocean, as well as below regions of thin litho-sphere, such as East and part of North Africa, from Libya to the East African Rift, and below a large part of East Asia, especially between Japan and the Baikal Rift and Hangay dome. Thefit is however poor (red symbols) below Southeast Asia and the central and West Mediterranean realm. A more recent investigation over Indochina (Yu et al., 2018) confirms this poor fit. When using SL2013sv’s seismic anisotropy inference instead (Figure 4), the quality of the match depends upon the depth considered. At 100 km (Figure 4a), it is good over a large part of the Indian Ocean, south of India, below the Tibetan Plateau, and most of Northeast and Southeast Asia. This good agreement disappears at 200 km (Figure 4b) below Northeast and Southeast Asia. At this depth, the fast direction in SL2013sv trends NE-SW below India and the Indian Ocean and slowly bends toward E-W below China and Japan. Another important observation is that SL2013sv azimuthal aniso-tropy at 200 km is very weak below Indonesia, especially north of the E-W trending part of the Sunda Trench. This can either be due to an intrinsically weak anisotropy of the mantle or to steeply dipping stretching in the mantle.
In regions where both SKS- and surface-wave anisotropy provide the same sense of mantle shear (Figure S7), this orientation is also parallel to the long-term trajectories in an absolute kinematic framework, which is in agreement with the assumptions made above (horizontalflow and plane strain). In this case, strain and flow are coaxial in map view. However, the case of the Mediterranean region is different, as the trajectories in an absolute framework are highly oblique to the fast directions in the mantle (Figure S2). There, surface kine-matics are dominated by the retreat of narrow slabs that move fast in the mantle (Faccenna et al., 2004;
Spakman & Wortel, 2004), with velocities well above 10 cm/year. So, in that case too, seismic anisotropy may give a good image of theflow.
In the case of East Asia, the vertical superposition of two perpendicular stretching/shearing directions, seen here at large scale, is confirmed by detailed studies of the stratification of anisotropy below Tibet (Agius & Lebedev, 2017; Huang et al., 2017) with differentflow directions at lithospheric and asthenospheric depths. One can reasonably assume that the signal at 200 km for SL2013sv gives information on the asthenospheric flow as it samples the mantle well below the LAB in East Asia. At 100 km, the situation is more complex as the map of SL2013sv anisotropy probably contains some signal provided by the lithospheric mantle or even the lower crust, as proposed for Tibet (Agius & Lebedev, 2017). The 100-km map should then be considered as an image of theflow/strain in the lithosphere and the 200 km map as the flow in the asthenosphere.
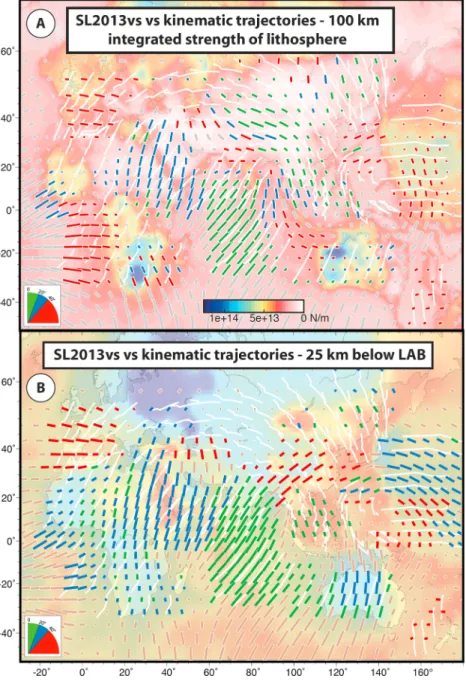
Figure 5. Comparison of SL2013sv anisotropy directions (colored symbols) with long-term kinematic trajectories (40 Ma, white lines) calculated from Torsvik and Cocks (2016) at 100 km (a) on top of a map of integrated strength of the litho-sphere, based on Tesauro et al. (2013), and (b) at 25 km below LAB in the model of Tesauro et al. (2013), the background is the lithospheric thickness model of Tesauro et al. (2013).
10.1029/2018TC005036
7. Discussion
Mantle stretching appears in general well correlated with long-term kinematic trajectories in regions of thin lithosphere. These include the eastern Mediterranean, East Africa, and Northeast and Southeast Asia at 100 km (for SL2013sv only). We discuss in the next sections the implications of these observations at the scale of Eurasia with a focus on East Asia.
7.1. Deep Flow Pattern
The bestfit of seismic anisotropy and kinematic trajectories is thus observed at the depth of 100 km for regions supported by a lithosphere thinner than 100 km, but also beneath Tibet where the lithosphere is thicker (Figures 3b and 4a). There, the LAB is shallower than 100 km, but the crust is very thick, which also confirms a link between thin (and thus hot) lithospheric mantle and a good coupling between surface displa-cements and mantle deformation. This is confirmed by plotting (Figure 5) SL2013sv anisotropy at 100 km or SKS fast splitting orientations on a map of the integrated strength of the lithosphere (Tesauro et al., 2013), showing that the whole of East Asia rests on a weak lithosphere, including the thick crust of the Tibetan Plateau. Therefore, a weak lithosphere favors coupling between surface displacements and mantle deforma-tion more than its absolute thickness. At 200 km (Figure 4b), a goodfit is observed below regions where fast northward mantleflow can be inferred, such as below India and a large part of the Indian Ocean, or below East Africa where the Afar plume drives the opening of the Red Sea and the drift of Arabia (Faccenna, Becker, Jolivet et al., 2013). Below East Africa, the match is more in agreement with SKS-waves anisotropy than with that obtained from the surface wave model.
In Southeast Asia, SKS-wave anisotropy does not match the plate trajectories (Figure 3b), while SL2013sv ani-sotropy instead shows a goodfit around 100 km (Figure 4a). This may imply that SKS-splitting anisotropy, as it corresponds to local measurements, shows here a smaller-scaleflow that is not captured by the smooth SL2013sv model. The direction of thisflow could be toward the west or southwest, corresponding to a tighter counterflow around the East Himalayan syntaxis toward the Burma slab as proposed by Wang et al. (2013) and Yu et al. (2018). At 100 km, theflow geometry (or of shearing below the lithosphere) indicated by SL2013sv anisotropy below Asia can otherwise be compared with the model of Sternai et al. (2016; Figure 4a, inset) which was designed to study the 3-D interactions between slab retreat and collision for the India-Asia collision. This model suggests that the mantleflowing underneath East Asia exerts a control on the tectonic evolution and the topography of the domain situated to the east of the east Himalayan syn-taxis. The three plots (insets in Figure 4a) showing the upper crustal, lower crustal, and asthenosphericflows illustrate this similarity. The asthenosphericflow is here entirely driven by convergence and slab retreat (there is no larger-scaleflow involved in the model as the plume-related deeper flow carrying India is not consid-ered). The observed similarity suggests that the pattern of SL2013sv anisotropy observed at 100 km is a con-sequence of the India-Asia collision and slab retreat south of Indonesia and not of the deeper large-scale conveyor belt.
The main question is then the cause of this widely distributed extension across eastern and southeastern Asia. If asthenosphericflow plays a role in the distribution of deformation across Asia, the geometry of sur-rounding slabs should reflect it. We then now consider the geometry of slabs as inferred from seismic tomography models.
7.2. Slabs Geometries
Figures 6 and 7 show a synthesis of the shapes of slabs around Asia based on seismic tomography (Amaru, 2007; Li et al., 2008; Obayashi et al., 2013; Replumaz et al., 2004; Simmons et al., 2012; van der Meer et al., 2010). Subducted lithosphere shows an opposite behavior when comparing the Himalaya-Tibet region and the subduction zones surrounding Asia to the east and southeast.
7.2.1. Indian Slab below the Himalayas and Tibet
The Indian slab is discontinuous and oversteepened (Figure 6a). The upper part of the slab (white arrow 1 in Figure 6a) is still attached to the Indian lithosphere and does not go further down than the upper mantle. Two high velocity anomalies (white arrows #2 an #3 on Figure 6a) in the lower mantle reflect the multistage India-Eurasia convergence and/or indicate that the slab has detached twice (van der Meer et al., 2010; Van der Voo et al., 1999), leaving Tethyan slab remnants behind, which have continued to sink in the lower mantle (Replumaz et al., 2004, 2013). India has thus overridden the broken-off Tethyan slab remnants during
collision, advancing ~3,000 km northward inside Asia since 50 Ma. At present, part of the Indian slab lies hor-izontally below the eastern part of Tibet (Agius & Lebedev, 2013), indicating that the last break-off event resulted in slab rebound, a process that implies an external force pushing the Indian slab northward (Magni et al., 2017). The geometry of the Tethyan slab now seen in the lower mantle (Hall & Spakman, 2015; Replumaz et al., 2004; Figure 1a) shows the transition between the advancing and retreating foreland basins/trenches from the Himalayas (advancing) to the Sunda Trench (retreating), where its projection at the surface crosses the subduction zone (white arrow on Figure 1a).
7.2.2. Subducting Slabs in Sunda and Peri-Pacific Trenches
On the eastern edge of Asia, along the western Pacific margin, and in contrast to the Tethyan realm, the ocea-nic slabs subducting below Asia to the east and southeast instead show concave-up geometry in the upper mantle (Figure 6b). By concave-up we mean that the shallow slab dips steeper than the deeper slab that lies horizontally at the bottom of the transition zone. This geometry is for instance observed at the latitude of
Figure 6. The shapes of slabs around Asia. The upper left panel shows the detached and overhanging Himalayan slab (van der Meer et al., 2010). Lower panels show two sections across the Japan subduction zone with four different models: UU-PO7 (Amaru, 2007), GAP-P4 (Obayashi et al., 2013), MIT-2008 (Li et al., 2008), and LLNL_G3Dv3 (Simmons et al., 2012). Upper right panel: Three time frames of the evolution of West Pacific and East Asia showing the subduction of the Pacific-Izanagi ridge (Seton et al., 2012; Zahirovic et al., 2015). Part offigure was prepared with GPlates (Boyden et al., 2011).
10.1029/2018TC005036
Japan and Ryukyu Islands, as illustrated by different tomographic data sets (Amaru, 2007; Fukao & Obayashi, 2013; Li et al., 2008; Obayashi et al., 2013; Pownall et al., 2017; Simmons et al., 2012; Zhao, 2017; Zhao et al., 2017). Goes et al. (2017), based on a review of the geometry of slabs worldwide and of dynamic models,
Figure 7. Sketch of the displacement and deformation of the Himalayan and Pacific slabs by the flow of Indian mantle below Asia and mantleflow at asthenospheric depth (black arrows) and lithospheric depth (white arrows). Small green arrows show the recent velocityfield on the Tibetan Plateau. Large green arrows on the upper sketch shows the main stretching direction. The asthenosphericflow has carried India northward inside Asia. The geometry of slabs was sketched based on seismic tomography (Agius & Lebedev, 2013; Amaru, 2007; Li et al., 2008; Obayashi et al., 2013; Replumaz et al., 2004; Simmons et al., 2012; van der Meer et al., 2010; Zhao et al., 2017). Theflow carries also the slab observed below the Himalaya and it extends behind the collision zone all the way to the Pacific margins. The indentation of India into Asia has formed the Himalayan Range and the Tibetan Plateau in the compressional zone near the collision front. In the east, the leading edges of Asia are subjected to extension above eastwardflowing asthenosphere following slab retreat. This extensional stressfield in the east makes the boundary conditions asymmetrical and the deformation of Asia due to col-lision thus develops in an asymmetric way with the main strike-slip faults developing toward the east. The lateral transition from continental collision in the Himalayas to oceanic subduction in the Sunda Trench leads to a more superficial return flow that drags the edges of Asia southward toward the retreating Sunda Trench. Inset shows a map of Eurasia with the mainflow direction associated with Arabia-Eurasia and India-Asia collisions with respect to Eurasia.
review that this geometry is due to both (1) the viscosity increase and the phase transition between the upper and lower mantle and (2) trench retreat.
The age of the subducted oceanic lithosphere east of Asia has been so far diversely interpreted. Honda (2016) proposed that the edge of the slab stagnating below Northeast China is the subducted mid-ocean ridge between Izanagi and Pacific Plates. However, this proposition bears an inconsistency: since 50 Ma, some 5,000 km of Pacific lithosphere have subducted toward the west below Asia at the latitude of Japan, which is much more than the observed length of the subducted lithosphere between the Japan Trench and the tip of the horizontal slab at depth (~1,500 km only). A more recent analysis (Liu et al., 2017) suggests instead that the slab seen today in the upper mantle started to subduct 25–30 Ma ago and that the tip of the flat slab is 90 Ma old, while the oceanic lithosphere entering the trench today is 130 Ma old. This alternative interpre-tation has several implications: (1) The slab was already old and dense enough to drive slab retreat in the Oligocene and Miocene, (2) theflat part of the slab entered the trench approximately when the Japan Sea started to rift, (3) the tip of the horizontal slab is not the paleo-ridge between the Pacific and Izanagi Plates, and (4) some length of the Pacific slab has thus subducted before 30 Ma. This older subducted Pacific slab can now be seen in the lower mantle. Various tomographic models indeed show a steeply dipping high velocity anomaly that can be interpreted as a deep extension of the slab in the lower mantle, beneath theflat slab resting on the transition zone (Figures 6 and 7) but the resolution of these models does not allow concluding whether it is still attached or not.
This conclusion is in line with the reconstructions and models proposed by Seton et al. (2015) who showed that the kinematic reorganization in the Pacific is due to the subduction of the Pacific-Izanagi ridge and sub-sequent beginning of subduction of the Pacific Plate between 53 and 47 Ma. Figure 6c illustrates three time slices of the interactions between the Izanagi-Pacific Ridge at 70, 50, and 30 Ma based on Seton et al.’s (2012) kinematic model. As the ridge entered the subduction zone at about 50 Ma, the steeply dipping slab seen today in the lower mantle would thus be the remnant of the Izanagi Plate that subducted below Asia in the Mesozoic and Early Cenozoic, plus a part of the Pacific Plate. After ridge subduction, the Pacific Plate started to subduct some 50 Ma ago and slab pull progressively increased. After some 20 Ma, the slab pull component was large enough to trigger trench retreat and back-arc basins started to form. Because the Pacific-Izanagi ridge was roughly parallel to the margin, it subducted entirely along at the same time and back-arc basins thus started to form roughly simultaneously, around 30–35 Ma.
A similar geometry with a concave-up slab, compatible with trench retreat during the formation of back-arc basins, is observed all along the southern margin of Indonesia north of Sunda Trench (Figure 7; Hall & Spakman, 2015; Replumaz et al., 2004). This geometry suggests slab retreat accommodating the opening of basins in the overriding plate such as the South China Sea and other extensional basins (Rangin et al., 1990). This shows that the spreading of the eastern and southeastern margin of Asia since collision has affected the whole upper mantle, lithospheric mantle, and asthenosphere together, from the latitude of the Okhotsk and Japan Seas to Indonesia, and that the thin lithosphere below East and Southeast Asia rests above slabs ponding on the transition zone.
The transition from concave-up slabs to the overhanging and partly flat-lying Himalayan slab can be observed at the latitude of the Andaman Sea. The overhang increases northward toward the east Himalayan syntaxis (Figure 7). This dip reversal of the slab corresponds to the point separating the domains where the deep slab is observed, either north or south of the trench, right above the position where the high velocity anomaly in the lower mantle crosses the Sunda Trench (Figure 1; Hall & Spakman, 2015). East of this position the slab has retreated, and west of it, the slab has advanced, while India was indenting Asia. The Indian slab has thus followed the mantleflow that carries India northward and the mantle north of the slab has moved the same way, more than 3,000 km since 50 Ma. As the slab has moved with theflow, mantle flow lines should be continuous across the slab (Figure 7). To the southeast of the Andaman region, the slab has retreated toward the south and southwest, and the slab is continuous at depth; Indian mantleflow lines should then not be continuous across the trench.
7.3. Tectonics of Asia
We now discuss the large-scale deformation of Asia. As summarized above, the asymmetry of deformation in Asia is usually explained by the assumption that the western Pacific margin, because of subduction, is
stress-10.1029/2018TC005036
free and that the Asian continental lithosphere is free to move eastward, while it is blocked on the western side (Tapponnier et al., 1982). Although at the latitude of Japan the present-day subduction zone has been compressional for the last 10 Ma (Ingle, 1992; Jolivet et al., 1994; Tamaki et al., 1992), the whole eastern mar-gin has been under extension from 30 to 10 Ma. It is still under extension today at the latitude of the Okinawa Basin in the upper plate of the Ruykyu subduction zone (Kimura, 1985; Sibuet et al., 1987).
Figures 8 and 9 (see also Figure S8) show the main active structures, today and at 25 Ma, together with the stressfield and the pattern of seismic anisotropy at 50 and 200 km. The trend of the maximum horizontal stress (σH-max) is shown smoothed from the World Stress Map (Heidbach et al., 2016; Zoback, 1992).σH-min
is deduced from the orientation of extensional structures. On the 25 Ma reconstruction (Figure 9b), the direc-tions ofσH-maxandσH-minare inspired from the present-day situation with local modifications to account for
the orientation of the main extensional and strike-slip structures (Fournier et al., 1995). At 25 Ma, the India-Asia collision had been active for at least 25 Ma. The Tibetan Plateau and the Himalaya were under con-struction and the main large-scale strike-slip faults were already formed, so it appears plausible to assume that the stressfield at large scales was similar to the present-day one.
These maps show thatσH-maxis well correlated with the mantleflow at 200 km (asthenosphere) and that σ H-minbetter correlates with the direction offlow at 50 km. They also show that, at 25 Ma, the asthenospheric
flow and σH-max, if resembling the present-day one, were oblique on the West Pacific subduction zone and
compatible with the dextral shear recorded during the opening of the Japan Sea (Fournier et al., 2004).
7.3.1. Recent Compression at the Latitude of Japan Since 10 Ma
The reason for the change from extension to compression at the latitude of Japan is still unknown, but it could correspond to the progressive formation and displacement of the PHSP toward its present position and the stabilization of the Central Japan triple junction (Hall, 2002; Jolivet et al., 1989, 1994; Lallemand, 2016; Rangin et al., 1990). The insertion of the young PHSP between the Pacific and Eurasia Plates might have coupled the Pacific, the Philippine Sea, and Eurasia Plates (Jolivet et al., 1994). Faccenna et al. (2017) have recently proposed a complementary explanation. According to this study, the regular northward migration of PHSP progressively created a situation with two parallel subductions zones, the Ryukyu and Pacific Trenches, changing the kinematics of both trenches, from retreating to advancing, thus leading to a com-pressional tectonic regime at the latitude of Japan.
In the next subsection, we focus on the extension period that led to the opening of the Japan Sea, the South China Sea, and the Shikoku-Parece-Vela Basin on the PHSP, in the same Oligocene and Miocene time frame.
7.3.2. Back-Arc Basins Opening in the Oligocene and Miocene
During the Oligocene and part of the Miocene (Figure 9), the entire eastern and southeastern margin of Asia was extending behind retreating subduction zones with a slab progressively ponding on top of the transition zone. Lithospheric thinning associated with magmatism extends far west of the subduction zone, all the way to Mongolia (Hunt et al., 2012; Windley & Allen, 1993), and its timing is not always precisely constrained. Cenozoic extension was accommodated by a lithosphere that had already been thinned during the Mesozoic (Charles et al., 2013; Yin, 2010). Therefore, when India-Asia collision started, the eastern part of Asia was supported by a thin and warm lithosphere, and thinning continued until the Middle Miocene at least.
The cause for extension is classically attributed to slab retreat, assuming that it is able to transmit extensional forces at long distance inside Asia, as far as the Baikal Rift for instance, with aflow of asthenosphere toward the subduction zone, only due to subduction dynamics (Zhao, 2017). Theflat slab over a long distance below the extended part of the Asian lithosphere is compatible with this mechanism.
The direction of opening of the Japan Sea and South China Sea was not perpendicular to the margin (Figures 2b and 9b), rather NW-SE in both cases, and it was associated with large-scale strike-slip faults, left-lateral faults radiating from the collision zone and dextral faults parallel to the margin (Jolivet et al., 1994; Kimura & Tamaki, 1986; Lallemand & Jolivet, 1985; Tapponnier et al., 1982; Yin, 2010). The geometry and kinematics of the Japan Sea back-arc opening was coeval with the development of a large-scale dextral shear zone, running from the northern Sea of Okhotsk to Southwest Japan along more than 2,000 km, which accommodated some 450 km of dextral displacement (Jolivet et al., 1994). The opening of the South China Sea, in the same direction as the Japan Sea, involved one large-scale sinistral shear zone, the Ailao Shan-Red River Shear Zone, running from the Tibetan Plateau to the region of Hanoi, and a dextral component
along the western margin (Huchon et al., 1994; Marquis et al., 1997; Rangin et al., 1995; Tapponnier et al., 1982, 1986, 1990). Seismic profiles across the South China Sea rift in the non-oceanized domain show that the crust deformed ductilely during rifting (Clerc et al., 2018; Savva et al., 2013), suggesting a high heatflow and a thin and hot lithosphere.
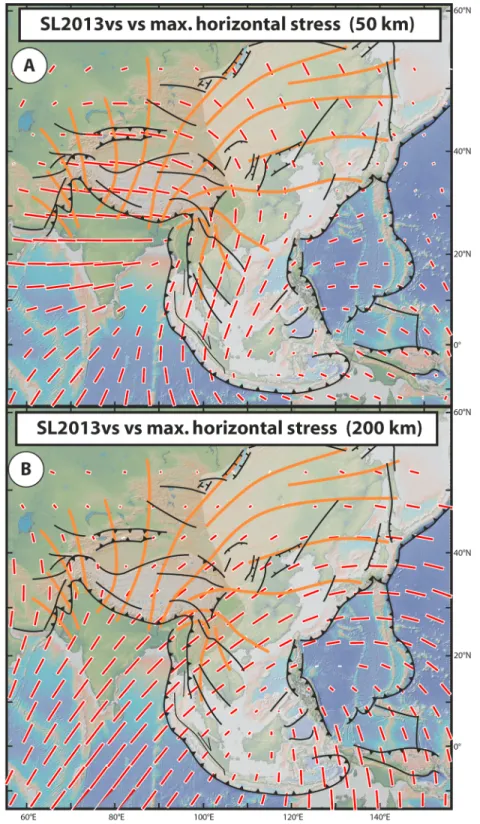
Figure 8. The main active structures in Asia and the western Pacific together with the principal horizontal stress trajectories (orange lines), smoothed from the World Stress Map (Heidbach et al., 2016; Zoback, 1992) and SL2013sv seismic anisotropy (red lines; Schaeffer & Lebedev, 2013) at 50 km (a) and 200 km (b).
10.1029/2018TC005036
The 25 Ma reconstruction (Figure 9b) shows that the extension and related strike-slip faults at the latitude of Japan were oblique to the direction of the Pacific trench and that the asthenospheric flow (if it has not chan-ged significantly, as suggested by the orientation of σH-max) was also oblique on the margin, with a
Figure 9. Two time-shots (a: present-day, b: 25 Ma, similar to Figure 2b) of active structures withσHmaxandσH-min, on top
of SL2013sv seismic anisotropy (50 km for the present-day stage, 200 km for the 25 Ma stage). As the main tectonic features of Asia were already present 25 Ma ago, stress trajectories on the reconstruction are taken from the present-day situation, offset southward to accommodate for the more southerly position of India at this period.σH-minis set perpendicular to σHmaxand compatible with the strike of extensional structures.
configuration that is compatible with the observed dextral shear (Yin, 2010). However, the Sakhalin-Hokkaido dextral shear zone extends far north of the trench along the western margin of the Okhotsk Sea (Jolivet et al., 1999; Worrall et al., 1996), showing that the dextral shear is not only due to the obliquity of subduction. These dextral shear zones can also be far-field effects of the India-Asia collision as originally proposed by Kimura and Tamaki (1986) and confirmed by analogue modeling (Fournier et al., 2004; Jolivet et al., 1990, 1994; Kimura & Tamaki, 1986). A question then remains concerning the main driving forces behind a dynamic con-nection between back-arc extension and collision.
7.4. Mantle Flow and Asian Tectonics
We have shown so far that the geometry of slabs below the Himalayas and the West Pacific back-arc basins and the direction offlow suggested by seismic anisotropy at 200 km and long-term kinematic trajectories are compatible with a single asthenosphericflow (Figure 7), with an advancing trench in the Himalaya and a retreating trench below the Japan Sea. This led to an oversteepened slab below the thick crust of the Himalayas and Tibet and concave-up slabs below the thinned lithosphere of eastern Asia.
Detailed studies of the stratification of seismic anisotropy beneath Tibet (Agius & Lebedev, 2017; Huang et al., 2017) show that theflow direction in the asthenosphere and the lithosphere can be quite different. The flow direction in the asthenosphere shown by these studies is similar to theflow at 200 km otherwise shown here based on a global model and theflow in the crust and lithosphere similar to the flow at 100 km. This is confirmed by the plot of the SL2013sv seismic anisotropy 25 km below LAB (Figure S5), similar to that at 200 km, except below Southeast Asia where the lithosphere is thin over a wide region. It is thus likely that the 100 and 200 km anisotropy inferences represent the strain orflow in the lithosphere and the asthenosphere, respectively.
Figure 7 shows a synthesis of mantleflow based on the observations summarized above. Black arrows repre-sent theflow in the asthenosphere at 200 km, which is part of the whole mantle conveyor belt, and white arrows show theflow or strain at 100 km at lithospheric depths. Note that the divergence of the deep flow (200 km) toward the NE should induce a stretching perpendicular toflow lines, compatible with the direction of anisotropy in the lithosphere (100 km) and the direction ofσH-min. In the vicinity of some slabs (SE Asia,
western Mediterranean), the mainflow seems mostly controlled by trench retreat. The flow pattern shown by white arrows indeed shows similar sharp bends in East Asia and the Middle East and eastern Mediterranean region (see inset on Figure 7a), with an opposite sense of rotation, clockwise versus counter-clockwise, when approaching subduction zones. This toroidalflow can be interpreted as the result of the transition along strike of the convergence zone from collision to oceanic subduction and a large-scale slab tear (Capitanio, 2014; Funiciello et al., 2006; Magni et al., 2012, 2014; Menant, Sternai, et al., 2016; Sternai et al., 2014, 2016). Forward migration of the slab within the collision zone gives place to a retrograde motion of the oceanic slab and a returnflow below the back-arc domain (Faccenna, et al., 2006). This back-arc domain is the Aegean Sea in the eastern Mediterranean and Southeast Asia east of the Himalayan collision zone. The anisotropy pattern at 50 or 100 km can be interpreted as the direction of extension (orflow) in the litho-sphere, perpendicular to the main shortening direction. In Tibet, where gravitational potential energy is large, this results in the coexistence of reverse faulting at the periphery of the plateau, and strike-slip and normal faulting in the plateau itself. Farther away from the collision zone, deformation is dominated by extension and large-scale strike-slip shear zones.
7.5. A Tectonic Scenario
As the Indian slab has moved northward since the onset of collision, the asthenosphere in which it sinks has moved at least by the same amount. Theflow carrying India has thus reached north beyond the collision zone. We propose the following scenario: The asthenosphericflow carrying India northward has invaded the whole of the East Asian mantle, and spread out until the Pacific margin, where it has accommodated the Pacific slab retreat (Figures 7 and 10). We suggest here a long-distance coupling between collision and back-arc extension permitted by asthenosphericflow underneath Asia. This asthenospheric flow has thus been active below the whole collision zone. The forces controlling the distribution of deformation in this region (Tibetan Plateau, the eastern Himalayan syntaxis, Burma) then arise from several sources: (1) continent-continent collision transmits horizontal forces across the crust and lithosphere, and (2) gravita-tional potential energy stored in the thick crust tends to spread the thickened crust laterally (Molnar &
10.1029/2018TC005036
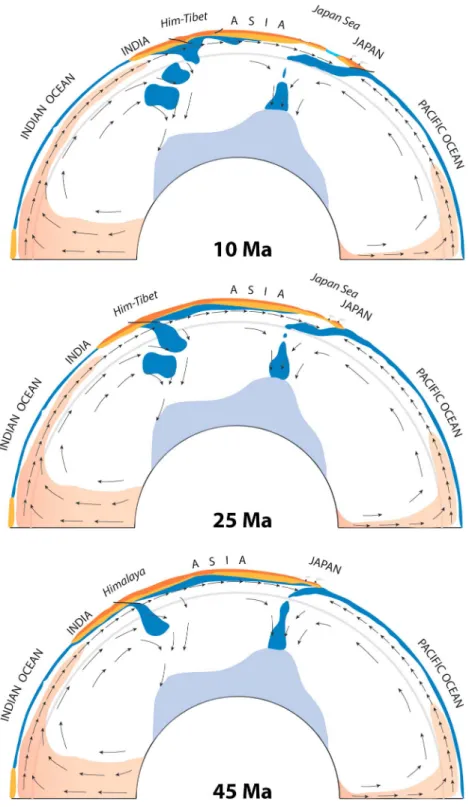
Figure 10. Cross-sections of the mantle showing the postulatedflow pattern. Three stages of a possible evolution of the lithosphere and mantle along a section form South Africa to the western Pacific. Upwelling above LLSVP and downwelling in the lower mantle are partly disconnected from the horizontal flow in the upper mantle (gray line shows the 660 km discontinuity). The northwardflow pushes India inside Asia and the Tethyan slab leaves detached fragments in the lower mantle behind, while theflow extends all the way to the western Pacific subduction zones, where it follows the Pacific slab retreat below Japan. The first two stages cor-respond to episodes of slab break-off in the Himalayas at 45 and 25 Ma and the last stage (10 Ma) corcor-responds to the transition from extension to compression along the eastern margin of the Japan Sea. The simplest possible scenario has been used for the Himalayas with only one slab progressively overridden and detaching and one collision event. More complex evolution could be envisaged.
Lyon-Caen, 1988). Forces related to indentation induce the formation of strike-slip faults at long distance from the Himalaya (Molnar & Tapponnier, 1975; Tapponnier & Molnar, 1976). (3) Mantleflow underneath Asia is an additional driver that can explain the general asymmetry of deformation and its propagation east-ward and southeasteast-ward.
During its northward motion, the Indian-Tethyan slab has left behind detached pieces that are now seen in tomographic models south of the collision zone, in the lower mantle (Figure 6a). The timing of this progres-sive dissection of the subducting slab is not precisely known, but geodynamic reconstructions suggest multi-ple shortening events and multimulti-ple break-off events between 45 and 25 Ma, ultimately leading to the complete loss of the oceanic slab and possibly two episodes of slab break-off at 45 and 25 Ma (Bouilhol et al., 2013; Mahéo et al., 2002, 2009; Replumaz et al., 2014, 2016). After slab break-off, the still attached part becomes free to move with the asthenosphericflow carrying India in the upper mantle. The asthenospheric flow would then continue toward the Pacific margin where the slab has started its retreat some 30–35 Ma ago, producing the shape we observe today (Figure 10). The part of the Indian slab lying horizontally below the eastern part of Tibet (Agius & Lebedev, 2013) might have beenflattened by this northward flow (Magni et al., 2017). Figure 10 is based upon the simplest possible scenario for the Himalaya (one single collision event and one single slab, progressively overridden and detached) but a more complex evolution is possible. This scenario explains in a simple way the geometry of the two slabs, the Indian slab that has overpassed the detached blobs it left in the lower mantle, and the Pacific slab that is resting with a shallow angle on the tran-sition zone. The geometry of slabs is similar from the latitude of Japan to SE Asia, suggesting that the whole eastern Asian lithosphere has spread eastward and southeastward toward the retreating subduction zones (Figures 7 and 10).
In our scenario, deformation in the lithosphere is controlled by (1) a deep asthenosphericflow that results from the large-scale conveyor belt between a plume south of India and the west Pacific subductions and by (2) a shallowerflow resulting from continent-continent collision and slab retreat east of the collision zone. In this context, the Tibetan Plateau formed the underthrusting of India and by body forces stored in the litho-sphere resulting from crustal thickening and thinning of lithospheric mantle. Tibetan crustal material is extruded toward the east where it overrides the continental crust of Southeast China along the Long Men Shan thrust and toward the southeast toward the retreating subduction zone. Around the Eastern Himalayan Syntaxis and toward western Indochina, the uppermost mantleflows to the east and southeast, driven by the rollback of the Sunda slab, providing active support to the topography (Sternai et al., 2016). In this region, the deep NE-ward Indian asthenosphericflow is blocked by the Indian slab subducting below Indonesia. The flow passes through only north of the Andaman region where the slab is detached and overhanging.
This tectonic scenario is compatible with more recent models of collision dynamics in this region. Replumaz et al. (2016) have suggested, based on analogue modeling, that continental subduction does not necessarily require a strong slab pull. When the underthrusting plate is pushed from behind, the continent subducts even with a weak slab pull and the experiments reproduce the overturned shape of the Himalayan slab. In nature, the push force can be found in the entrainment of India by the underlyingflow of the mantle. The interactions between subduction dynamics and upper plate deformation are also modulated by the intrinsic behavior of the subducting slab that has detached several times. Numerical experiments (Replumaz et al., 2014) have shown that slab break-off results in an efficient coupling of the two lithospheres through the plate contact and the propagation of compressive stresses far into the upper plate.
Assuming that during the formation of the Japan Sea the Japan Arc was transported by a combination of a deep eastward asthenosphericflow and a shallower southeastward lithospheric flow, and taking the amount of displacement (~450 km) along the Sakhalin-Hokkaido Shear Zone during this period (from 30 to 10 Ma; Jolivet et al., 1994) as a constraint, a simple velocity triangle can be constructed (Figure 4b). The direction of motion of Japan with respect to Eurasia is set parallel to the long axis of the Japan Sea, that is, parallel to the main strike-slip shear zone (NNE-SSW), while the two other directions are parallel (1) to the supposed mantleflow at 200 km and (2) the displacement of Japan with respect to the mantle. This leads to a velocity of the mantleflow at 200 km of about 2 cm/year eastward. When adding the rotation component of the Japan Arc to account for its bent shape (see Jolivet et al., 1994) its velocities with respect to Eurasia and to the mantle increase, but it does not affect significantly the velocity of the eastward mantle flow. With this