HAL Id: hal-00298882
https://hal.archives-ouvertes.fr/hal-00298882
Submitted on 11 Sep 2007HAL is a multi-disciplinary open access
archive for the deposit and dissemination of sci-entific research documents, whether they are pub-lished or not. The documents may come from teaching and research institutions in France or abroad, or from public or private research centers.
L’archive ouverte pluridisciplinaire HAL, est destinée au dépôt et à la diffusion de documents scientifiques de niveau recherche, publiés ou non, émanant des établissements d’enseignement et de recherche français ou étrangers, des laboratoires publics ou privés.
The impacts of future climate change and sulphur
emission reductions on acidification recovery at Plastic
Lake, Ontario
J. Aherne, M. N. Futter, P. J. Dillon
To cite this version:
J. Aherne, M. N. Futter, P. J. Dillon. The impacts of future climate change and sulphur emission reductions on acidification recovery at Plastic Lake, Ontario. Hydrology and Earth System Sciences Discussions, European Geosciences Union, 2007, 4 (5), pp.3027-3054. �hal-00298882�
HESSD
4, 3027–3054, 2007The impacts of future climate change and sulphur emission... J. Aherne et al. Title Page Abstract Introduction Conclusions References Tables Figures ◭ ◮ ◭ ◮ Back Close
Full Screen / Esc
Printer-friendly Version Interactive Discussion
Hydrol. Earth Syst. Sci. Discuss., 4, 3027–3054, 2007 www.hydrol-earth-syst-sci-discuss.net/4/3027/2007/ © Author(s) 2007. This work is licensed
under a Creative Commons License.
Hydrology and Earth System Sciences Discussions
Papers published in Hydrology and Earth System Sciences Discussions are under open-access review for the journal Hydrology and Earth System Sciences
The impacts of future climate change and
sulphur emission reductions on
acidification recovery at Plastic Lake,
Ontario
J. Aherne1, M. N. Futter2, and P. J. Dillon1
1
Environmental and Resource Studies, Trent University, Peterborough, Canada
2
Watershed Ecosystems Graduate Program, Trent University, Peterborough, Canada Received: 8 December 2006 – Accepted: 9 March 2007 – Published: 11 September 2007 Correspondence to: J. Aherne ([email protected])
HESSD
4, 3027–3054, 2007The impacts of future climate change and sulphur emission... J. Aherne et al. Title Page Abstract Introduction Conclusions References Tables Figures ◭ ◮ ◭ ◮ Back Close
Full Screen / Esc
Printer-friendly Version Interactive Discussion
EGU
Abstract
Climate-induced drought events have a significant influence on sulphate export from forested catchments in central Ontario, subsequently delaying the recovery of surface waters from acidification. In the current study, a model chain that employed a sta-tistical downscaling model, a hydrological model and two hydrochemical models was 5
used to forecast the chemical recovery of Plastic Lake sub-catchment 1 (PC1) from acidification under proposed deposition reductions and the A2 emission scenario of the Intergovernmental Panel on Climate Change. Any predicted recovery in stream acid neutralising capacity and pH owing to deposition reductions were clearly offset by large acid effluxes from climate-induced drought events. By 2100, ANC is predicted to 10
show large variations ranging between 10 and −30 µmolcL−1. Similarly, predicted pH
in 2100 is lower (>0.05 of a pH unit) than the value simulated for 2000 (pH 4.35). De-spite emission reductions, the future scenario paints a bleak picture of reacidification at PC1 to levels commensurate with those of the late 1970s. The principal process behind this reacidification is the oxidation of previously stored (reduced) sulphur compounds 15
in wetlands during periods of low-flow (or drought), with subsequent efflux of sulphate upon re-wetting. Simulated catchment runoff under the A2 emissions scenario pre-dictes increased intensity and frequency of low-flow events from approximately 2030 onwards. The Integrated Catchments model for Carbon indicated that stream DOC concentrations at PC1 will also increase under the future climate scenario, with tem-20
perature being the principal driver. Despite the predicted (significant) increase in DOC, pH is not predicted to further decline (beyond the climate-induced oxidation scenario), instead pH shows greater variability throughout the simulation. As echoed by many recent studies, hydrochemical models and model frameworks need to incorporate the drivers and mechanisms (at appropriate time-scales) that affect the key biogeochemi-25
HESSD
4, 3027–3054, 2007The impacts of future climate change and sulphur emission... J. Aherne et al. Title Page Abstract Introduction Conclusions References Tables Figures ◭ ◮ ◭ ◮ Back Close
Full Screen / Esc
Printer-friendly Version Interactive Discussion
1 Introduction
Since the 1980s, sulphur (S) emission control programs in North America have resulted in major declines (approximately 40%) in sulphate (SO2−4 ) deposition over south-central Ontario, Canada. As a consequence, SO2−4 concentrations in headwater lakes and their inflows have decreased; however, concomitant chemical recovery of alkalinity and 5
pH has been limited (Jeffries et al., 1995; McNicol et al., 1998; Stoddard et al., 1999). In Ontario, climate-induced drought events have been identified as a major cause of the delayed recovery (Dillon et al., 1997; Jeffries et al., 2002; Eimers and Dillon, 2002; Laudon et al., 2004). A number of studies at Plastic Lake in south-central Ontario have clearly demonstrated that acidity of a stream draining a wetland portion of the 10
catchment increased substantially after periods of drought (Dillon and LaZerte, 1992; LaZerte, 1993; Devito and Hill, 1999; Eimers et al., 2004). The Model of Acidification of Groundwater in Catchments (MAGIC: Cosby et al., 1985, 2001) has been success-ful in reproducing the observed trends at Plastic Lake and supports the hypothesis that wetland redox processes can explain much of the inter-annual variation in SO2−4 , 15
pH and base cation stream concentrations (Aherne et al., 2004). The redox processes (triggered by low-flow events) incorporated in the wetland compartment in MAGIC were essential to reproducing the observed chemistry. This model was further used to quan-tify the potential influence of climate-induced drought events on acidification recovery under proposed future emission reductions (Aherne et al., 2006). However, the study 20
noted that reliable forecasts of recovery from acidification require climate scenarios downscaled from global climate models and high-resolution scenarios for catchment discharge.
In addition to redox processes, there are a number of other factors that can influ-ence the extent of chemical recovery from acidification. In particular, the confounding 25
influence of increasing dissolved organic carbon (DOC) concentrations has recently re-ceived considerable attention (Skjelkv ˚ale et al., 2003, 2005; Worrall et al., 2004; Evans et al., 2006; Roulet and Moore, 2006). It has been hypothesised that factors related to
HESSD
4, 3027–3054, 2007The impacts of future climate change and sulphur emission... J. Aherne et al. Title Page Abstract Introduction Conclusions References Tables Figures ◭ ◮ ◭ ◮ Back Close
Full Screen / Esc
Printer-friendly Version Interactive Discussion
EGU
climate change may be (somewhat) responsible for the increases in DOC (Freeman et al., 2001, 2004; Hejzlar et al., 2003; Evans et al., 2005), which have been observed across Europe and eastern North America during the past 10–20 years (Stoddard et al., 2003). Recently MAGIC was used to evaluate the effect of climate change on the recovery of soil and surface water from acidification (Wright et al., 2006). The ap-5
proach employed a simple sensitivity analyses at 14 intensively studied sites in Europe and eastern North America. The analyses suggested that the direct influence of cli-mate change (temperature, precipitation and runoff) had very little impact on model simulations. However, Wright et al. (2006) suggested that the modelling of recovery from acidification should take into account possible concurrent climate changes (e.g., 10
organic matter decomposition in soils and nitrogen retention) and focus especially on the climate-induced changes in organic acids.
In this paper a sophisticated model chain framework is used in conjunction with MAGIC to forecast the impacts of future climate change and S deposition reductions on the chemical recovery of the Plastic Lake catchment from acidification. The ap-15
proach is similar to previous linked model systems that use hydrochemical effects mod-els (Forsius et al., 1997; Kaste et al., 2006). The ultimate goal of the model chain was to provide high-resolution inputs of climate and catchment discharge to drive aquatic DOC inputs and redox processes within MAGIC. The National Centre for Environmen-tal Prediction (NCEP) re-analysis data set (Kalnay et al., 1996) were used in conjunc-20
tion with outputs from the HadCM3 (Hadley Centre, UK) general circulation models (GCM) to generate a long-term (1960–2100) climate change sequence. The data were downscaled to the study site using the Statistical Downscaling Model (SDSM: Wilby et al., 2002) and further used to generate long-term site-specific sequences for catch-ment runoff and DOC using the Hydrologiska Byr ˚ans Vattenbalansavdelning (HBV: 25
Bergstr ¨om, 1976) model and the Integrated Catchments model for Carbon (INCA-C: Futter et al., 2007). These data, combined with SO2−4 deposition, were the principal driving inputs to MAGIC. The deposition forecast was derived from recently proposed S emission reduction estimates using the Acid Deposition and Oxidant Model (ADOM;
HESSD
4, 3027–3054, 2007The impacts of future climate change and sulphur emission... J. Aherne et al. Title Page Abstract Introduction Conclusions References Tables Figures ◭ ◮ ◭ ◮ Back Close
Full Screen / Esc
Printer-friendly Version Interactive Discussion
WxPrime, 2004).
2 Methods
2.1 Study site
Plastic Lake (32.1 ha headwater lake) is located on the Precambrian Shield in Halibur-ton County, south-central Ontario (45◦11′N, 78◦50′W), in an area that has received
5
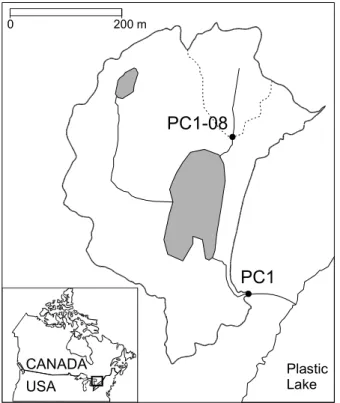
substantial levels of acid deposition for decades (Dillon et al., 1987). The Plastic Lake catchment (96.5 ha) is drained by seven small streams, six of which are ephemeral. The largest of the sub-catchments (PC1, 23.3 ha) flows year-round except in very dry years (Fig. 1). Five of the seven sub-catchments, including PC1, drain wetlands. The upland soils of PC1 (and it’s gauged sub-catchment PC1-08, 3.5 ha: Fig. 1) are 10
sandy, shallow, humo-ferric or ferro-humic podzols (Lozano, 1987). Quartz, plagio-clase, potassium feldspar, and amphibole dominate the parent material of the soil (Kirkwood and Nesbitt, 1991). The PC1 upland forest cover is primarily coniferous, dominated by white pine (Pinus strobus L.), red maple (Acer rubrum L.), eastern hem-lock (Tsuga canadensis (L.) Carri `ere) and red oak (Quercus rubra L.). The wetland 15
(Sphagnum-conifer swamp, 2.2 ha) soils are humic mesisols dominated by white cedar (Thuja occidentalis L.). The catchment altitude ranges from 380–420 m a.s.l., annual rainfall averages ∼1000 mm and the mean January and July air temperatures are −9.4 and 18.6, respectively.
The Plastic Lake catchment has been extensively monitored since the late 1970s and 20
has been previously described (bulk precipitation: Dillon et al., 1988; forest through-fall: Neary and Gizyn, 1994; soil: Lozano, 1987; Watmough and Dillon, 2004; forest biomass: Lozano and Parton, 1987; Watmough and Dillon, 2004). Stream discharge and chemistry has been measured for the PC1 sub-catchment since 1979 (PC1-08: 1986–1995). The field, hydrologic, and analytical methods are described in detail else-25
Me-HESSD
4, 3027–3054, 2007The impacts of future climate change and sulphur emission... J. Aherne et al. Title Page Abstract Introduction Conclusions References Tables Figures ◭ ◮ ◭ ◮ Back Close
Full Screen / Esc
Printer-friendly Version Interactive Discussion
EGU
teorology has been measured at the nearby Muskoka airport (44◦58′N, 79◦18′W) since
the early 1940s.
2.2 Future climate and deposition scenarios
In the current study, future climate (temperature and precipitation) data were derived from the HadCM3 GCM under the A2 emission scenarios of the Intergovernmental 5
Panel on Climate Change (IPCC). The A2 scenario represents a pessimistic future with high emissions of greenhouse gases (Naki´cenovi´c et al., 2000), and was chosen under the current study to represent a maximum climate change scenario. The scenario is one of four that have been uniformly chosen under the European Union Euro-Limpacs project: A2 and B2 emission scenarios of the IPCC derived from the HadCM3 and 10
ECHAM4/OPYC3 (Max Planck Institute, Germany) GCMs. The HadCM3 climate was chosen in preference to ECHAM4/OPYC3 for purely pragmatic reasons: availability of data in a format for statistical downscaling.
Sulphate deposition forecasts were derived from recently proposed emission re-duction estimates from ADOM (WxPrime, 2004). Unlike previous rere-duction scenarios 15
(PST2010F: Kaminski, 2002) based on (semi-realistic) regional rollback strategies, the current scenario (NOX3P: WxPrime, 2004) is entirely sectoral based (metal smelters, power plants, transportation, etc) and includes reductions in nitrogen oxide emissions. The proposed reductions are based on Canada’s post-2000 Acid Rain Strategy and the proposed Clear Skies Legislation in the United States. The reductions roughly cor-20
respond to a decrease of 40% for SO2−4 depositions by 2020 from a 1989 baseline, remaining constant thereafter.
2.3 Model chain framework
The suite of models employed in the current study have been previously well described (Cosby et al., 1985; Bergstr ¨om, 1976; Wilby et al., 2002; Futter et al., 2007). Sim-25
HESSD
4, 3027–3054, 2007The impacts of future climate change and sulphur emission... J. Aherne et al. Title Page Abstract Introduction Conclusions References Tables Figures ◭ ◮ ◭ ◮ Back Close
Full Screen / Esc
Printer-friendly Version Interactive Discussion
the wetland redox processes within MAGIC have been previously described (Aherne et al., 2004, 2006). Further, the model framework utilised in the current study is similar to previous model chains that have used hydrochemical effects models (Forsius et al., 1997; Kaste et al., 2006). As such, the individual models and the model framework are only briefly described.
5
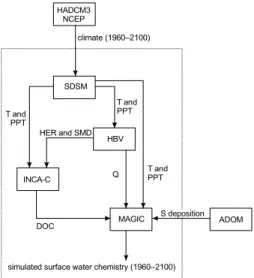
The model framework consisted of four models: SDSM, HBV, INCA-C and MAGIC (Fig. 2). In brief, SDSM is a statistical downscaling model that facilitates the down-scaling of GCM output to individual sites at daily time-scales (Wilby et al., 2002). The hydrological model HBV, is a daily time-step, semi-distributed catchment runoff (dis-charge) model. The model was originally developed in the 1970s at the Swedish Mete-10
orological and Hydrological Institute (Bergstr ¨om, 1976); the version used in the current study was developed to simulate the effects of climate change on river runoff (Sælthun, 1996). The Integrated Catchments model for Carbon, is a dynamic, daily time-step, semi-distributed catchment scale process-based model of DOC concentration and flux in streams and rivers. The model was recently developed to investigate the effects of 15
climate on DOC in surface waters (Futter et al., 2007). Finally, MAGIC is a lumped-parameter model of intermediate complexity, developed to predict the long-term effects of acidic deposition on soils and surface water chemistry (Cosby et al., 1985, 2001). The model predicts monthly and annual average concentrations of the major ions for soil solution and surface water chemistry. MAGIC represents the catchment with ag-20
gregated, uniform soil compartments, and a surface water compartment that can be either a lake or a stream. It has been in use for >20 years and has been applied exten-sively in North America and Europe (see Appendix I in Cosby et al., 2001). The latest version includes a wetland compartment that incorporates redox processes driven by climate-induced drought events. The four models were not linked or integrated under 25
one unified system, rather outputs from one model were fed or chained to the next model (Fig. 2); as such, the framework did not include any feedbacks between mod-els. Furthermore, all daily time-step outputs were averaged or summed to a monthly time-step for MAGIC. Again, the approach is similar to previous hydrochemical model
HESSD
4, 3027–3054, 2007The impacts of future climate change and sulphur emission... J. Aherne et al. Title Page Abstract Introduction Conclusions References Tables Figures ◭ ◮ ◭ ◮ Back Close
Full Screen / Esc
Printer-friendly Version Interactive Discussion
EGU
chains (Forsius et al., 1997; Kaste et al., 2006).
The model chain framework was primarily developed to generate high-resolution cli-mate, runoff and DOC inputs to MAGIC. Firstly, SDSM was used to generate daily tem-perature and precipitation at Muskoka airport for the period 1960–2100 using the NCEP re-analysis data set (1960–1990) and outputs from the HadCM3 GCM (A2 scenario: 5
1990–2100). The downscaled temperature and precipitation were used to generate daily catchment runoff, soil moisture deficit (SMD) and hydrologically effective rainfall (HER) using HBV (Fig. 2). The outputs from HBV were used as inputs to INCA-C to generate daily stream DOC concentrations at PC1 for the period 1960–2100. Daily time-series outputs from these models (SDSM, HBV and INCA-C) of temperature, pre-10
cipitation, runoff and DOC were aggregated to monthly resolution and utilised in con-junction with proposed S deposition reductions to simulated surface water chemistry at PC1 using MAGIC (Fig. 2).
2.4 Model calibration and simulation
Under SDSM, the NCEP re-analysis data set (1960–1990) was used to develop sta-15
tistical models for observed daily temperature and precipitation at Muskoka airport. To provide better correspondence between simulated and observed meteorology, SDSM assigns a stochastic residual to the deterministic predictor-predictand relationships (Wilby et al., 2002). The calibrated model was used to generate ensembles (100 in-dividual time-series) of daily temperature and precipitation at Muskoka airport for the 20
period 1960–2100 using the NCEP re-analysis data set (1960–1990) and outputs from the HadCM3 GCM (A2 scenario: 1990–2100). The ensembles were generated to provide a more robust estimated of downscaled temperature and precipitation; how-ever, only the median time-series were used as inputs to MAGIC. In general, statistical downscaling models are more successful at reproducing temperature compared with 25
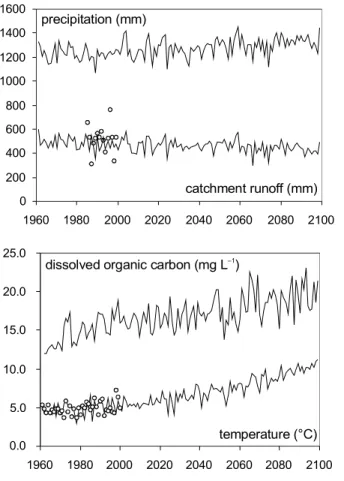
precipitation. In the current study, simulated and observed temperature show reason-able correspondence (Fig. 3), whereas simulated precipitation was approximately 15% higher than observed (not shown). The mis-match between observed and simulated
HESSD
4, 3027–3054, 2007The impacts of future climate change and sulphur emission... J. Aherne et al. Title Page Abstract Introduction Conclusions References Tables Figures ◭ ◮ ◭ ◮ Back Close
Full Screen / Esc
Printer-friendly Version Interactive Discussion
precipitation is primarily due to imprecise and highly variable rainfall forecasts from the current generation of GCMs.
The downscaled temperature and precipitation were used to generate ensembles (based on 250 individual time-series derived from random combinations of the tem-perature and precipitation data sets) of daily catchment runoff, SMD and HER us-5
ing HBV, which was calibrated to PC1 using observed daily temperature, precipitation and streamflow (1980–2000). The model performance was evaluated using the Nash-Sutcliffe efficiency criterion, with 1.0 corresponding to perfect fit (Nash and Nash-Sutcliffe, 1970). Acceptable values for hydrological model calibrations are normally within the range of 0.6–0.9; a value of 0.71 was obtained in the current study. Observed and sim-10
ulated runoff show reasonable correspondance (Fig. 3). The outputs from HBV (HER and SMD) were utilised in conjunction with observed DOC and streamflow at PC1 (1980–2000) to calibrate INCA-C and further generate an ensemble (250 time-series) of daily stream DOC concentrations at PC1 for the period 1960–2100. A Nash-Sutcliffe efficiency criterion of 0.23 was obtained for the calibration of INCA-C to PC1. Down-15
scaled climate (temperature and precipitation) were used in the calibration process resulting in the apparent low efficiency; however, the values are within the range for previously reported INCA-C calibrations (0.0–0.6: Futter et al., 2007).
The application of MAGIC to the Plastic Lake catchment and the calibration of the wetland redox processes within MAGIC have been previously described (Aherne et 20
al., 2004, 2006). The calibration was carried out in two stages. The first stage fo-cused only on the PC1-08 sub-catchment (which excluded the wetland component) using observed inputs and outputs for the period 1986–1995. The second calibra-tion focused on the entire PC1 catchment (including the wetland). Model performance was evaluated using Normalised Mean Absolute Error (NMAE), which ranges between 25
zero and one with zero indicating absolute agreement between predicted and observed (Janssen and Heuberger, 1995). Simulated PC1 stream concentrations were calibrated by adjusting S reduction and oxidation parameters, with reduction only occurring when discharge was greater than 5 cm mo−1 (calibrated threshold) and oxidation only
oc-HESSD
4, 3027–3054, 2007The impacts of future climate change and sulphur emission... J. Aherne et al. Title Page Abstract Introduction Conclusions References Tables Figures ◭ ◮ ◭ ◮ Back Close
Full Screen / Esc
Printer-friendly Version Interactive Discussion
EGU
curring when discharge was less than 5 cm mo−1. The “oxidation threshold” was only
implemented during the summer months (June–October). The calibrated threshold in the current study is higher than previously reported values (Aherne et al., 2004, 2006), as HBV modelled runoff did not adequately simulate low-flow events. An NMAE of 0.20, 0.16 and 0.10 were obtained for SO2−4 , base cations (calcium + magnesium + sodium 5
+ potassium) and pH during the calibration period (1980–2000). Further details are given by Aherne et al. (2006).
The model framework was employed to investigate the influence of future climate and S deposition reductions on the recovery of PC1 from acidification. Daily time-series outputs from SDSM, HBV and INCA-C for temperature, precipitation, runoff and 10
DOC were aggregated to monthly resolution (temperature and DOC were averaged; precipitation and runoff were summed) as inputs to MAGIC (Fig. 3). Only the me-dian of the climate, runoff and DOC ensembles were used as inputs to MAGIC. The study utilised three simulation scenarios (Base, Redox and DOC); all three scenarios commonly incorporated the direct influence of climate (temperature, precipitation and 15
runoff) and S deposition reductions (see Table 1). However, the “Base scenario” ex-cluded the influence of redox events (the “redox switch” was turned off in MAGIC). The “Redox scenario” included the influence of redox events (“redox switch” turned on), and finally the “DOC scenario” investigated the potential influence of future changes in surface water DOC concentrations on the acid status of PC1. Future DOC stream 20
concentrations were assumed to directly follow the change given by INCA-C (“delta-change method”). The DOC scenario was superimposed upon the redox scenario.
3 Results and discussions
3.1 Influence of emission reductions and climate on recovery
Future recovery patterns (until the year 2100) were evaluated using two key indicators: 25
HESSD
4, 3027–3054, 2007The impacts of future climate change and sulphur emission... J. Aherne et al. Title Page Abstract Introduction Conclusions References Tables Figures ◭ ◮ ◭ ◮ Back Close
Full Screen / Esc
Printer-friendly Version Interactive Discussion
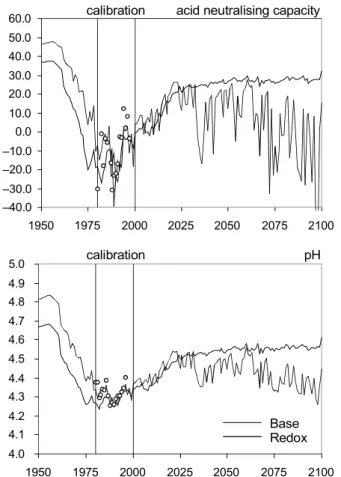
strong acid anions) and pH in PC1 (Fig. 4 and Table 1). Surface water ANC and pH are standard indicators used in acidification studies, as both are strongly indicative of biological recovery (Hutchinson et al., 1989; Lien et al., 1996). In addition, ANC is the most widely used chemical criterion in critical load calculations for surface waters (Henriksen et al., 1995).
5
Future climate variability (excluding redox events) and deposition forecasts from ADOM were used to simulated surface water chemistry for PC1 for the period 2000– 2100 under the base scenario. Sulphate deposition is forecasted to decrease until 2020 (approximately 40% from 1989). In contrast, mean temperature is predicted to in-crease from 5.4 to 10.3◦C and precipitation to increase by 5% between 2000 and 2100
10
(Fig. 3). The proposed deposition reductions showed significant recovery in stream ANC and pH between 2000 and 2100 (Fig. 4 and Table 2) with ANC increasing from
<0 µmolcL−1 to >25 µmolcL−1 and pH increasing by >0.2 pH units. The direct
influ-ence of climate (temperature, precipitation and runoff) had little impact on chemical recovery. To some extent the variable pattern in simulated surface water chemistry is 15
driven by the inter-annual variation in precipitation and runoff; however, as S emissions decrease the inter-annual variation was less pronounced (Fig. 4).
The recovery from acidification is primarily driven by reduced depositions rather than the direct influence of climate. Simulated surface water chemistry showed a significant recovery potential under the current deposition reduction; by 2100 stream concentra-20
tion levels recovered to values predicted for the early 1960s. More importantly, under the base scenario recovery extends well beyond 2020 when the deposition reduction is fully implemented (Fig. 4 and Table 2). The continued recovery is primarily driven by the continued improvement (increase) in percent soil base saturation (from 11.5 to 14.5%; not shown). The A2 emission scenarios of the IPCC employed in the current 25
study indicates significant climate change in the coming decades (Fig. 3); nonethe-less, model simulations show little influence from climate. Wright et al. (2006) have re-cently noted the limitations in current modelling structures to represent climate-induced changes. Climate-induced changes in processes are generally not incorporated in
cur-HESSD
4, 3027–3054, 2007The impacts of future climate change and sulphur emission... J. Aherne et al. Title Page Abstract Introduction Conclusions References Tables Figures ◭ ◮ ◭ ◮ Back Close
Full Screen / Esc
Printer-friendly Version Interactive Discussion
EGU
rent versions of acidification models. This is largely due to the lack of knowledge on the detailed cause and mechanisms linking changes in climate to changes in soil and water chemistry (Wright et al., 2006).
3.2 Influence of redox processes on recovery
There are a number of factors that can influence the extent of chemical recovery from 5
acidification (Beier et al., 2003; Evans, 2005; Larssen, 2005; Skjelkv ˚ale et al., 2005; Aherne et al., 2004, 2006). The incorporation of climate-induced redox events strongly influences the forecasted surface water chemistry at PC1 (Fig. 4 and Table 2). Stream ANC and pH show very large inter-annual variations under the redox scenario; more importantly, the forecasted recovery potential is very much reduced. To some extent, 10
this pattern is driven by the inter-annual variation in precipitation (Fig. 3) and deposition inputs; however, climate-induced redox events strongly influence the forecasted catch-ment outflow. The future runoff scenario includes significant periods where runoff is
<5 cm mo−1, the oxidation threshold. Recovery (increases) in ANC owing to deposition
reductions is clearly offset by large acid effluxes from the redox events. By 2100, ANC 15
is predicted to show large variations ranging between 10 and −30 µmolcL−1. Similarly,
predicated pH in 2100 is lower than the value simulated for 2000 (<pH 4.3: Fig. 4 and Table 2). Despite emission reductions, the redox scenario paints a bleak picture of reacidification at PC1 to levels commensurate with those of the late 1970s (Fig. 4). In the current study, the redox events are driven by the A2 emission scenario of the 20
IPCC, which may be viewed as somewhat pessimistic as it is a high emissions sce-nario. Nonetheless, drought-induced acid export from wetlands has the potential to delay (or reverse) recovery of surface waters from acidification in south-central Ontario (Aherne et al., 2006).
The simulated drought events have a considerable impact on outflow chemistry, re-25
sulting in increased SO2−4 and base cations and decreased ANC concentrations (Figs. 4 and 5). The largest effect is on simulated SO2−4 surface water concentrations (Fig. 5
HESSD
4, 3027–3054, 2007The impacts of future climate change and sulphur emission... J. Aherne et al. Title Page Abstract Introduction Conclusions References Tables Figures ◭ ◮ ◭ ◮ Back Close
Full Screen / Esc
Printer-friendly Version Interactive Discussion
and Table 2). There are significant differences between the base and redox scenarios. The redox scenario exhibits repeated export of SO2−4 during drought (or low-flow) years when discharge falls below the oxidation threshold (5 cm mo−1). Under the redox
sce-nario, discharge fell below the oxidation threshold during many of the years, but only during years with extended periods of drought was SO2−4 export observed. In total, 5
there were 45 event-years where SO2−4 export was observed during the period 2000– 2100. The significant decrease in simulated ANC (Fig. 4) was due to the increased flux of SO2−4 (Fig. 5); however, the impact on ANC was somewhat decreased owing to the increased flux of base cations (Fig. 5).
The frequency of drought (or low-flow) events has a significant influence on pre-10
dicted water quality. In the current study, the runoff scenario was generated using HBV in conjunction with downscaled temperature and precipitation derived from HadCM3 under the A2 emission scenario of the IPCC. During the 100 year simulation period (2000–2100) there are approximately 40 years with low-flow periods. The intensity and frequency of these events increased during the latter years of the simulation (from 15
2030) driving the reacidification at PC1.
3.3 Influence of dissolved organic carbon on recovery
Increases in DOC have been observed across Europe and eastern North America during the past 10–20 years (Stoddard et al., 2003; Evens et al., 2005). It has been suggested that factors related to climate change, acid deposition and changes in land 20
use may be responsible for these increases (Evans et al., 2006; Holmberg et al., 2006; Roulet and Moore, 2006; Vuorenmaa et al., 2006). Increasing trends in temperature and decreasing rates of S depositions have both been implicated as potential drivers of these observed increases in DOC concentrations. In the current study, the INCA-C model predicted that DOC concentrations will increase (Fig. 3). The simulated increase 25
in DOC did not result in further decreases in pH (Fig. 6) beyond the redox scenario (Fig. 6 and Table 2); instead pH showed greater variability throughout the simulation
HESSD
4, 3027–3054, 2007The impacts of future climate change and sulphur emission... J. Aherne et al. Title Page Abstract Introduction Conclusions References Tables Figures ◭ ◮ ◭ ◮ Back Close
Full Screen / Esc
Printer-friendly Version Interactive Discussion
EGU
under the DOC scenario.
The predicted (significant) increasing trend in DOC concentrations at PC1 is not sur-prising given the somewhat ubiquitous increasing trends observed across north Amer-ica and Europe (Freeman et al., 2001; Stoddard et al., 2003; Worrall et al., 2004; Evans et al., 2005; Skjelkv ˚ale et al., 2005; Vuorenmaa et al., 2006). In the current study, the 5
predicted increase in DOC is primarily driven by increasing temperature (Fig. 3). How-ever, it is important to note that the INCA-C predictions were based on climate alone and did not incorporate the effects of decreasing S deposition rates on DOC. Although empirical studies have shown a correlation between decreasing S deposition and in-creasing DOC, no widely accepted mechanism currently exists; consequently initial 10
attempts to include S deposition as a driver in INCA-C have not been successful. Wright et al. (2006) suggested that the modelling of recovery from acidification should take into account climate-induced changes in organic acids. Ultimately this requires that the appropriate processes are incorporated into existing hydrochemical effects models. In the current study, INCA-C was used to provide DOC time-series 15
input to MAGIC. The framework did not allow for feedback between models; accord-ingly, only surface water DOC concentrations were linked to MAGIC. As such, DOC only influences the acid status (pH) of the surface water compartment under the cur-rent model structure in MAGIC. Nonetheless, it represents an exploratory assessment of the potential influence of changing surface water DOC concentrations on the acidity 20
of PC1. The predicted increase in DOC resulted in greater variability in simulated pH with little, if any, further decrease in pH beyond the redox scenario.
4 Conclusions
Clearly, greater consideration of climatic effects (and climate variability) on biogeo-chemical cycles should be considered when predicting the recovery of acidified surface 25
waters (Forsius et al., 1997; Evans, 2005; Aherne et al., 2006; Wright et al., 2006). The current study clearly shows the importance of future climate variability; specifically
HESSD
4, 3027–3054, 2007The impacts of future climate change and sulphur emission... J. Aherne et al. Title Page Abstract Introduction Conclusions References Tables Figures ◭ ◮ ◭ ◮ Back Close
Full Screen / Esc
Printer-friendly Version Interactive Discussion
low-flow (or drought) events, on the recovery of Plastic Lake sub-catchment 1 from acidification. In south-central Ontario, the future recovery of surface waters under re-duced depositions may be delayed (or reversed) by drought-inre-duced SO2−4 export from wetlands owing to redox processes. By 2100 the pH of PC1 is predicted to be <5.0 and ANC is predicted to range between −40 and +20 µmolcL−1. As echoed by many
5
recent studies (Aherne et al., 2006; Wright et al., 2006; Posch et al., 2007), hydrochem-ical models and model frameworks, need to incorporate the drivers and mechanisms that affect the key biogeochemical processes (at appropriate time-scales) to reliably predict the impacts of climate change. This study presents the first steps towards a robust framework for reliable prediction of chemical recovery from acidification at PC1. 10
Importantly, the approach incorporated a climate scenarios downscaled from a GCM and a high-resolution scenarios for catchment discharge. Future studies should include strict acceptance criteria for downscaled precipitation (limit ensembles of downscaled climate to those that meet specified performance criteria). This should be similarly applied to hydrological simulations. Additional drivers, such as S deposition, need to 15
be incorporated into DOC models. Ultimately, greater communication (or feedback) is required between the individual linked process-oriented models. Alternatively, climate change mechanisms that affect key biogeochemical processes need to be incorporated directly into process-oriented models (one model versus many linked models).
Acknowledgements. This research was undertaken, in part, thanks to funding from the 20
Canada Research Chairs Program and an NSERC Discovery grant. M. N. Futter was funded by the Euro-limpacs project (GOCE-CT-2003-505540) and an NSERC/Suncor IPS Fellowship. Edited by: P. Dillon and R. F. Wright
References
25
Aherne, J., Larssen, T., Dillon, P. J., and Cosby, B. J.: Effects of climate events on elemen-tal fluxes from forested catchments in Ontario, Canada: modelling drought-induced redox
HESSD
4, 3027–3054, 2007The impacts of future climate change and sulphur emission... J. Aherne et al. Title Page Abstract Introduction Conclusions References Tables Figures ◭ ◮ ◭ ◮ Back Close
Full Screen / Esc
Printer-friendly Version Interactive Discussion
EGU
processes, Water Air Soil Pollut. Focus, 4, 37–48, 2004.
Aherne, J., Larssen, T., Cosby, B. J., and Dillon, P. J.: Climate variability and forecasting sur-face water recovery from acidification: modelling drought-induced sulphate release from wet-lands, Sci. Total Environ., 365, 186–199, 2006.
Beier, C., Moldan, F., and Wright, R. F.: Terrestrial ecosystem recovery – modelling the effects 5
of reduced acidic inputs and increased inputs of sea salts induced by global change, Ambio, 32, 275–282, 2003.
Bergstr ¨om, S.: Development and Application of a Conceptual Runoff Model for Scandinavian Catchments, Swedish Meteorological and Hydrological Institute, Norrk ¨oping, 134 pp, 1976. Cosby, B. J., Hornberger, G. M., Galloway, J. N., and Wright, R. F.: Modeling the effects of 10
acid deposition: assessment of a lumped parameter model of soil water and streamwater chemistry, Water Resour. Res., 21, 51–63, 1985.
Cosby, B. J., Ferrier, R. C., Jenkins, A., and Wright, R. F.: Modelling the effects of acid depo-sition: refinements, adjustments and inclusion of nitrogen dynamics in the MAGIC model, Hydrol. Earth Syst. Sci., 5, 499–517, 2001,
15
http://www.hydrol-earth-syst-sci.net/5/499/2001/.
Devito, K. J. and Hill, A. R.: Sulphate mobilization and pore water chemistry in relation to groundwater hydrology and summer drought in two conifer swamps on the Canadian shield, Water, Air, Soil Pollut., 113, 97–114, 1999.
Dillon, P. J. and LaZerte, B. D.: Response of the Plastic Lake catchment, Ontario, to reduced 20
sulphur deposition, Environ. Pollut., 77, 211–217, 1992.
Dillon, P. J., Reid, R. A., and de Grosbois, E.: The rate of acidification of aquatic ecosystems in Ontario, Canada. Nature, 329, 45–48, 1987.
Dillon, P. J., Lusis, M., Reid, R. A., and Yap, D.: Ten-year trends in sulphate, nitrate and hydro-gen deposition in central Ontario, Atmos. Environ., 22, 901–905, 1988.
25
Dillon, P. J., Molot, L. A., and Futter, M.: The effect of El Ni ˜no-related drought on the recovery of acidified lakes, Environ. Monit. Assess., 46, 105–111, 1997.
Eimers, M. C. and Dillon, P. J.: Climate effects on sulphate flux from forested catchments in south-central Ontario, Biogeochemistry, 61, 337–355, 2002.
Eimers, M. C. and Dillon, P. J., and Schiff, S. L.: Sulphate flux from an upland forested catch-30
ment in south-central Ontario, Canada, Water Air Soil Pollut., 152, 3–21, 2004.
Evans, C. D.: Modeling the effects of climate change on an acidic upland stream, Biogeochem-istry, 74, 21–46, 2005.
HESSD
4, 3027–3054, 2007The impacts of future climate change and sulphur emission... J. Aherne et al. Title Page Abstract Introduction Conclusions References Tables Figures ◭ ◮ ◭ ◮ Back Close
Full Screen / Esc
Printer-friendly Version Interactive Discussion
Evans, C. D., Monteith, D. T., and Cooper, D. M.: Long-term increases in surface water dis-solved organic carbon: Observations, possible causes and environmental impacts, Environ. Pollut., 137, 55–71, 2005.
Evans, C. D., Chapman, P. J., Clark, J. M., Monteith, D. T., and Cresser, M. S.: Alternative explanations for rising dissolved organic carbon export from organic soils, Global Change 5
Biol., 12, 2044–2053, 2006.
Forsius, M., Johansson, M. Posch, M., Holmberg, M., K ¨am ¨ari, J., Lepist ¨o, A., Roos, J., Syri, S., and Starr, M.: Modelling the effects of climate change, acidic deposition and forest harvesting on the biogeochemistry of a boreal forested catchment in Finland, Boreal Environ. Res., 2, 129–143, 1997.
10
Freeman, C., Evans, C. D., Monteith, D. T., Reynolds, B., and Fenner, N.: Export of organic carbon from peat soil, Nature, 412, 785–785, 2001.
Freeman, C., Fenner, N., Ostle, N. J., Kang, H., Dowrick, D. J., Reynolds, B., Lock, M. A., Sleep, D., Hughes, S., and Hudson, J.: Export of dissolved organic carbon from peatlands under elevated carbon dioxide levels, Nature, 430, 195–198, 2004.
15
Futter, M. N., Butterfield, D., Cosby, B. J., Dillon, P. J., Wade, A. J., and Whitehead, P. G.: Mod-eling the mechanisms that control in-stream dissolved organic carbon dynamics in upland and forested catchments, Water Resour. Res., 43, W02424, doi:10.1029/2006WR004960, 2007.
Hejzlar, J., Dubrovsk´y, M., Buchtele, J., and Ruˇziˇcka, M.: The apparent and potential effects 20
of climate change on the inferred concentration of dissolved organic matter on a temperate stream (The Mlse River, South Bohemia), Sci. Total Environ., 310, 143–152, 2003.
Henriksen, A., Posch, M., Hultberg, H., and Lien L.: Critical loads of acidity for surface waters – can the ANClimit be considered variable?, Water Air Soil Pollut., 85, 2419–2424, 1995. Holmberg, M., Forsius, M., Starr, M., and Huttunen, M.: An application of artificial neural net-25
works to carbon, nitrogen and phosphorus concentrations in three boreal streams and im-pacts of climate change, Ecol. Model., 195, 51–60, 2006.
Hutchinson, N. J., Holtze, K. E., Munro, J. R., and Pawson, T. W.: Modifying effects of life stage, ionic strength and post-exposure mortality on lethality of H+ and Al to lake trout and brook trout, Aquat. Toxicol., 15, 1–26, 1989.
30
Janssen, P. H. M. and Heuberger, P. S. C.: Calibration of process-oriented models, Ecol. Model., 83, 55–66, 1995.
wa-HESSD
4, 3027–3054, 2007The impacts of future climate change and sulphur emission... J. Aherne et al. Title Page Abstract Introduction Conclusions References Tables Figures ◭ ◮ ◭ ◮ Back Close
Full Screen / Esc
Printer-friendly Version Interactive Discussion
EGU
ter acidification at ecological monitoring sites in southeastern Canada (1981–1991), Water, Air, Soil Pollut., 85, 577–582, 1995.
Jeffries, D. S., Clair, T. C., Couture, S., Dillon, P. J., Dupont, J., Keller, W., McNicol, D. K., Turner, M. A., Vet, R., and Weeber, R.: Assessing the recovery of lakes in southeastern Canada from the effects of acid deposition, Ambio, 32, 176–182, 2003.
5
Kaste, Ø., Wright, R. F., Barkved, L. J., Bjerkeng, B., Engen-Skaugen, T., Magnusson, J., and Sælthun, N. R.: Linked models to assess the impacts of climate change on nitrogen in a Norwegian river basin and fjord system, Sci. Total Environ., 365, 200–222, 2006.
Kalnay, E., Kanamitsu, M., Kistler, R., Collins, W., Deaven, D., Gandin, L., Iredell, M., Saha, S., White, G., Woolen, J., Zhu, Y, Chelliah, M., Ebisuzaki, W., Higgins, W., Janowiak, J., Mo, 10
K. C., Ropelewski, C., Wang, J., Leetma, A., Reynolds, R., Jenne, R., and Joseph, D.: The NCEP/NCAR 40-year reanalysis project, Bull. Am. Meteor. Soc., 77, 437–471, 1996. Kaminski, J. W.: Emissions-Scenario Simulations of New Provincial SO2 Reduction Targets
using the Acid Deposition and Oxidant Model, Atmospheric Research and Modelling Con-sultants, Toronto, 23 pp., 2002.
15
Kirkwood, D. E. and Nesbitt, H. W.: Formation and evolution of soils from an acidified water-shed: Plastic Lake, Ontario, Canada, Geochim. Cosmochim. Acta, 55, 1295–1308, 1991. Larssen, T.: Model prognoses for future acidification recovery of surface waters in Norway using
long-term monitoring data, Environ. Sci. Technol., 39, 7970–7979, 2005.
Laudon, H., Dillon, P. J., Eimers, M. C., Semkin, R. G., and Jeffries, D. S.: Climate induced 20
episodic acidification of streams in Central Ontario, Environ. Sci. Technol., 38, 6009–6015, 2004.
LaZerte, B. D.: The impact of drought and acidification on the chemical exports from a minerotrophic conifer swamp, Biogeochemistry, 18, 153–175, 1993.
Lien, L., Raddum, G. G., Fjellheim, A., and Henriksen, A.: A critical limit for acid neutraliz-25
ing capacity in Norwegian surface waters, based on new analyses of fish and invertebrate responses, Sci. Total Environ., 177, 173–193, 1996.
Locke, B. A. and Scott, L. D.: Studies of lakes and watersheds in Muskoka-Haliburton, Ontario: Methodology (1976–1985), Data Report DR 86/4, Dorset Research Centre, Ontario Ministry of the Environment, Dorset, Ontario, Canada, 1986.
30
Lozano, F.: Physical and chemical properties of the soils at the southern biogeochemistry study site, Report BGC-018, Dorset Research Centre, Ontario Ministry of the Environment, Dorset, Ontario, Canada, 1987.
HESSD
4, 3027–3054, 2007The impacts of future climate change and sulphur emission... J. Aherne et al. Title Page Abstract Introduction Conclusions References Tables Figures ◭ ◮ ◭ ◮ Back Close
Full Screen / Esc
Printer-friendly Version Interactive Discussion
Lozano, F. and Parton, W. J.: Forest cover characteristics of the Harp #4 and Plastic #1 sub-catchments at the southern biogeochemical study site, Report BGC-006, Dorset Research Centre, Ontario Ministry of the Environment, Dorset, Ontario, Canada, 1987.
McNicol, D. K., Mallory, M. L., Laberge, C., and Cluis, D. A.: Recent temporal patterns in the chemistry of small acid sensitive lakes in central Ontario, Canada. Water Air Soil Pollut., 105, 5
343–351, 1998.
Naki´cenovi´c, N., Alcamo, J., Davis, G., De Vries, B., Fenhann, J., Gaffin, S., Gregory, K., Gr ¨ubler, A., Jung, T. Y., Kram, T., La Rovere, E. L., Michaelis, L., Mori, S., Morita, T., Pepper, W., Pitcher, H., Price, L., Raihi, K., Roehrl, A., Rogner, H.-H., Sankovski, A., Schlesinger, M., Shukla, P., Smith, S., Swart, R., Van Rooijen, S., Victor, N., and Dadi, Z.: Emissions 10
Scenarios, A Special Report of Working Group III of the Intergovernmental Panel on Climate Change, Cambridge University Press, 599 pp, 2000.
Nash, J. E. and Sutcliffe, J. V.: River flow forecasting through conceptual models: Part 1. A discussion of principles, J. Hydrol., 10, 282–290, 1970.
Neary, A. J. and Gizyn, W. I.: Throughfall and stemflow under deciduous and coniferous forest 15
canopies in south-central Ontario, Can. J. For. Res., 24, 1089–1110, 1994.
OME: Handbook of analytical methods for environmental samples. Technical Report, Ontario Ministry of the Environment, Rexdale, Ontario, Canada, 246 pp, 1983.
Posch, M., Aherne, J., Forsius, M., Fronzek, S., and Veijalainen, N.: Modelling the impacts of European emission and climate change scenarios on acid-sensitive catchments in Finland, 20
Hydrol. Earth Syst. Sci. Discuss., in press, 2007.
Roulet, N. and Moore, T. R.: Browning the waters, Nature, 444, 283–284, 2006.
Skjelkv ˚ale, B. L., Evans, C., Larssen, T., Hindar, A., and Raddum, G. G.: Recovery from acidi-fication in European surface waters: a view to the future, Ambio, 32, 170–175, 2003. Skjelkv ˚ale, B. L., Stoddard, J. L., Jeffers, J. N. R., Tørseth, K., Høg ˚asen, T., Bowman, J., 25
Mannio, J., Monteith, D., Mosello, R., Rogora, M., Rzychon, D., Vesel´y, J., Wieting, J., Wilan-der, A., and Worsztynowicz, A.: Regional scale evidence for improvements in surface water chemistry 1990–2001, Environ. Pollut., 137, 165–176, 2005.
Stoddard, J. L., Jeffries, D. S., L ¨ukewille, A., Clair, T. A., Dillon, P. J., Driscoll, C. T., Forsius, M., Johannessen, M., Kahl, J. S., Kellogg, J. H., Kemp, A., Mannio, J., Monteith, D. T., 30
Murdoch, P. S., Patrick, S., Rebsdorf, A., Skjelkv ˚ale, B. L., Stainton, M. P., Traaen, T., Van Dam, H., Webster, K. E., Wieting, J., and Wilander, A.: Regional trends in aquatic recovery from acidification in North America and Europe, Nature, 401, 575–578, 1999.
HESSD
4, 3027–3054, 2007The impacts of future climate change and sulphur emission... J. Aherne et al. Title Page Abstract Introduction Conclusions References Tables Figures ◭ ◮ ◭ ◮ Back Close
Full Screen / Esc
Printer-friendly Version Interactive Discussion
EGU
Stoddard, J. L., Karl, J. S., Deviney, F. A., DeWalle, D. R., Driscoll, C. T., Herlihy, A. T., Kellogg, J. H., Murdoch, P. S., Webb, J. R., and Webster, K. E.: Response of Surface Water Chem-istry to the Clean Air Act Amendments of 1990, Report EPA 620/R-03/001, United States Environmental Protection Agency, North Carolina, 2003, 78 pp, 2003.
Sælthun, N. R.: The “Nordic” HBV model. Description and documentation of the model version 5
developed for the project Climate Change and Energy Production. NVE publication, Oslo, Norwegian Water Resources and Energy Administration, 82-410-0273-4, 26 pp, 1996. Vuorenmaa, J., Forsius, M., and Mannio, J.: Increasing trends of total organic carbon
concen-trations in small forest lakes in Finland from 1987 to 2003, Sci. Total Environ., 365, 47–65, 2006.
10
Watmough, S. A. and Dillon, P. J.: Major fluxes from a coniferous catchment in central Ontario, 1983–1999, Biogeochemistry, 67, 369–398, 2004.
Wilby, R. L., Dawson, C. W., and Barrow, E. M.: SDSM – a decision support tool for the assessment of regional climate change impacts, Environ. Modell. Software, 17, 145–157, 2002.
15
Worrall, F., Harriman, R., Evans, C. D., Watts, C. D., Adamson, J., Neal, C., Tipping, E., Burt, T., Grieve, I., Monteith, D., Naden, P. M., Nisbet, T., Reynolds, B., and Stevens, P.: Trends in dissolved organic carbon in UK in rivers and lakes, Biogeochemistry, 70, 369–402, 2004. Wright, R. F., Aherne, J., Bishop, K., Camarero, L., Cosby, B. J., Erlandsson, M., Evans, C.
D., Forsius, M., Hardekopf, D., Helliwell, R., Hruska, J., Jenkins, A., Moldan, F., Posch, M., 20
and Rogora, M.: Modelling the effect of climate change on recovery of acidified freshwaters: relative sensitivity of individual processes in the MAGIC model, Sci. Total Environ., 365, 154–166, 2006.
WxPrime: Emissions-Scenario Simulations of Potential Nitrogen Emission Reductions Using the Acid Deposition and Oxidant Model (ADOM), WxPrime Corporation, Toronto, 51 pp, 25
HESSD
4, 3027–3054, 2007The impacts of future climate change and sulphur emission... J. Aherne et al. Title Page Abstract Introduction Conclusions References Tables Figures ◭ ◮ ◭ ◮ Back Close
Full Screen / Esc
Printer-friendly Version Interactive Discussion Table 1. Drivers (time-series inputs and processes) incorporated into the three simulation
scenarios: Base, Redox and DOC (see Fig. 2 for model linkages).
Simulation drivers: change direction [simulation model] Scenario Base Redox DOC A Future sulphate deposition under NOX3P emission scenario: ∼40%
decrease by 2020 from 1989 base [ADOM]
× × ×
B Future climate under A2 emissions scenario: ∼5◦C increase in
tem-perature and 5% increase in precipitation between 2000 and 2100 [HadCM3, SDSM]
× × ×
C Runoff under simulated precipitation and temperature: ∼10% de-crease between 2000 and 2100 [HBV]
× × ×
D Wetland reduction-oxidation processes: sulphur oxidation during low flow summer periods [MAGIC]
× ×
E Dissolved organic carbon (DOC) under the simulated precipitation, temperature and HBV moisture characteristics: ∼20% increase be-tween 2000 and 2100 [INCA-C]
×
ADOM: Acid Deposition and Oxidant Model, HadCM3: Hadley Centre General Circulation Model, HBV: Hydrologiska Byr ˚ans Vattenbalansavdelning, INCA-C: Integrated Catchments model for Carbon, MAGIC: Model of Acidification of Groundwater in Catchments, and SDSM: Statistical Downscaling Model.
HESSD
4, 3027–3054, 2007The impacts of future climate change and sulphur emission... J. Aherne et al. Title Page Abstract Introduction Conclusions References Tables Figures ◭ ◮ ◭ ◮ Back Close
Full Screen / Esc
Printer-friendly Version Interactive Discussion
EGU Table 2.Simulated surface water concentrations in PC1 outflow during selected periods
(five-year mean centred on the reporting (five-year) for the base, redox and DOC simulation scenarios under future climate change and sulphate emission reductions.
Parameter Scenario Surface water chemistry
(unit: µmolcL−1) 2000 2020 2040 2060 2080
Acid neutralising capacity Base −2.62 18.46 25.17 27.79 27.94 pH Base 4.34 4.47 4.53 4.56 4.56 Sulphate Base 116.83 66.32 58.31 59.68 62.90 Base cations Base 127.40 98.16 97.07 100.79 105.51 Acid neutralising capacity Redox −0.82 23.27 8.07 24.07 8.40 pH Redox 4.35 4.51 4.43 4.52 4.41 Sulphate Redox 110.52 55.40 72.31 47.61 68.05 Base cations Redox 122.85 92.07 93.58 84.99 90.93 pH DOC 4.39 4.48 4.49 4.59 4.45
HESSD
4, 3027–3054, 2007The impacts of future climate change and sulphur emission... J. Aherne et al. Title Page Abstract Introduction Conclusions References Tables Figures ◭ ◮ ◭ ◮ Back Close
Full Screen / Esc
Printer-friendly Version Interactive Discussion 0 200 m PC1-08 PC1 Plastic Lake CANADA USA
Fig. 1.Map of Plastic Lake gauged catchment No. 1 (PC1, 23.3 ha) showing the gauged sub-catchment (PC1-08, 3.5 ha; broken line) and wetland areas (principal swamp is 2.2 ha; grey). Filled circles indicate gauged catchment outlets (sampling stations).
HESSD
4, 3027–3054, 2007The impacts of future climate change and sulphur emission... J. Aherne et al. Title Page Abstract Introduction Conclusions References Tables Figures ◭ ◮ ◭ ◮ Back Close
Full Screen / Esc
Printer-friendly Version Interactive Discussion
EGU
model chain framework simulated surface water chemistry (1960–2100)
MAGIC HADCM3 NCEP SDSM INCA-C HBV ADOM DOC T and PPT HER and SMD T and PPT Q T andPPT climate (1960–2100) S deposition
Fig. 2. Flowchart of the model chain framework (dashed box) employed to investigate the impacts of future climate change and sulphur emission reductions on acidification recovery at Plastic Lake, Ontario. The diagram indicates the information flow (temperature (T), precipitation volume (PPT), streamflow discharge (Q), hydrologically effective rainfall, (HER), soil moisture deficit (SMD), dissolved organic carbon (DOC) and sulphate (S) deposition) between the suite of models (Statistical Downscaling Model (SDSM), Hydrologiska Byr ˚ans Vattenbalansavdelning (HBV), Integrated Catchments model for Carbon (INCA-C) and the Model of Acidification of Groundwater in Catchments (MAGIC)) employed in the framework. Models not specifically calibrated for use in the current study are external to the model framework (located outside the dashed box): HadCM3 (Hadley Centre, UK) general circulation model (GCM), the National Centre for Environmental Prediction (NCEP) re-analysis data set and the Acid Deposition and Oxidant Model (ADOM).
HESSD
4, 3027–3054, 2007The impacts of future climate change and sulphur emission... J. Aherne et al. Title Page Abstract Introduction Conclusions References Tables Figures ◭ ◮ ◭ ◮ Back Close
Full Screen / Esc
Printer-friendly Version Interactive Discussion 0 200 400 600 800 1000 1200 1400 1600 1960 1980 2000 2020 2040 2060 2080 2100 5.0 10.0 15.0 20.0 25.0 1960 1980 2000 2020 2040 2060 2080 2100 0.0 precipitation (mm) catchment runoff (mm) temperature (°C)
dissolved organic carbon (mg L )–1
Fig. 3.Annual precipitation and runoff volume (mm: upper panel); annual average temperature
(◦C) and stream dissolved organic carbon (mg L−1: lower panel) for the period 1960–2100.
Observed data for runoff and temperature during the calibration period 1980–2000 are also shown (open circles).
HESSD
4, 3027–3054, 2007The impacts of future climate change and sulphur emission... J. Aherne et al. Title Page Abstract Introduction Conclusions References Tables Figures ◭ ◮ ◭ ◮ Back Close
Full Screen / Esc
Printer-friendly Version Interactive Discussion
EGU calibration
calibration pH
acid neutralising capacity
–40.0 –30.0 –20.0 –10.0 0.0 10.0 20.0 30.0 40.0 50.0 60.0 1950 1975 2000 2025 2050 2075 2100 Base Redox 4.0 4.1 4.2 4.3 4.4 4.5 4.6 4.7 4.8 4.9 5.0 1950 1975 2000 2025 2050 2075 2100
Fig. 4. Simulated acid neutralising capacity (µmolcL
−1: upper panel) and pH (lower panel)
under the base scenario (thin line) and redox scenario (thick line) for the period 1960–2100. The calibration period (1980–2000) and the observed data (open circles) are also shown.
HESSD
4, 3027–3054, 2007The impacts of future climate change and sulphur emission... J. Aherne et al. Title Page Abstract Introduction Conclusions References Tables Figures ◭ ◮ ◭ ◮ Back Close
Full Screen / Esc
Printer-friendly Version Interactive Discussion calibration calibration sulphate (µmol L )c –1 0.0 50.0 100.0 150.0 200.0 250.0 300.0 1950 1975 2000 2025 2050 2075 2100 Base Redox 0.0 50.0 100.0 150.0 200.0 250.0 300.0 1950 1975 2000 2025 2050 2075 2100
base cations (µmol L )c
–1
Fig. 5. Simulated sulphate (µmolcL
−1
: upper panel) and base cation (calcium + magnesium + sodium + potassium, µmolcL
−1: lower panel) under the base scenario (thin line) and redox
scenario (black line) for the period 1960–2100. The calibration period (1980–2000) and the observed data (open circles) are also shown.
HESSD
4, 3027–3054, 2007The impacts of future climate change and sulphur emission... J. Aherne et al. Title Page Abstract Introduction Conclusions References Tables Figures ◭ ◮ ◭ ◮ Back Close
Full Screen / Esc
Printer-friendly Version Interactive Discussion EGU calibration pH Redox DOC 4.0 4.1 4.2 4.3 4.4 4.5 4.6 4.7 4.8 4.9 5.0 1950 1975 2000 2025 2050 2075 2100
Fig. 6.Simulated pH under the redox scenario (thin line) and DOC scenario (thick line) for the period 1960–2100. The calibration period (1980–2000) and the observed data (open circles) are also shown.