HAL Id: hal-00328423
https://hal.archives-ouvertes.fr/hal-00328423
Submitted on 27 Mar 2006
HAL is a multi-disciplinary open access
archive for the deposit and dissemination of
sci-entific research documents, whether they are
pub-lished or not. The documents may come from
teaching and research institutions in France or
abroad, or from public or private research centers.
L’archive ouverte pluridisciplinaire HAL, est
destinée au dépôt et à la diffusion de documents
scientifiques de niveau recherche, publiés ou non,
émanant des établissements d’enseignement et de
recherche français ou étrangers, des laboratoires
publics ou privés.
Constraining the total aerosol indirect effect in the
LMDZ and ECHAM4 GCMs using MODIS satellite data
J. Quaas, O. Boucher, U. Lohmann
To cite this version:
J. Quaas, O. Boucher, U. Lohmann. Constraining the total aerosol indirect effect in the LMDZ
and ECHAM4 GCMs using MODIS satellite data. Atmospheric Chemistry and Physics, European
Geosciences Union, 2006, 6 (4), pp.955. �hal-00328423�
© Author(s) 2006. This work is licensed under a Creative Commons License.
Chemistry
and Physics
Constraining the total aerosol indirect effect in the LMDZ and
ECHAM4 GCMs using MODIS satellite data
J. Quaas1,3, O. Boucher2,3, and U. Lohmann4
1Max Planck Institute for Meteorology, Hamburg, Germany
2Laboratoire d’Optique Atmosph´erique, CNRS/Universit´e des Sciences et Technologies de Lille, Villeneuve d’Ascq, France 3Hadley Centre, Met Office, Exeter, UK
4Institute for Atmospheric and Climate Science, ETH Zurich, Switzerland
Received: 5 August 2005 – Published in Atmos. Chem. Phys. Discuss.: 7 October 2005 Revised: 22 December 2005 – Accepted: 5 February 2006 – Published: 27 March 2006
Abstract. Aerosol indirect effects are considered to be the
most uncertain yet important anthropogenic forcing of cli-mate change. The goal of the present study is to reduce this uncertainty by constraining two different general circulation models (LMDZ and ECHAM4) with satellite data. We build a statistical relationship between cloud droplet number con-centration and the optical depth of the fine aerosol mode as a measure of the aerosol indirect effect using MODerate Res-olution Imaging Spectroradiometer (MODIS) satellite data, and constrain the model parameterizations to match this re-lationship. We include here “empirical” formulations for the cloud albedo effect as well as parameterizations of the cloud lifetime effect. When fitting the model parameterizations to the satellite data, consistently in both models, the radiative forcing by the combined aerosol indirect effect is reduced considerably, down to −0.5 and −0.3 Wm−2, for LMDZ and ECHAM4, respectively.
1 Introduction
Anthropogenic aerosols are estimated to cause the second most important anthropogenic forcing of climate change af-ter the greenhouse gases (Ramaswamy et al., 2001). Of particular importance is the fact that aerosols may serve as cloud condensation nuclei (CCN). Increased aerosol centrations may thus increase cloud droplet number con-centration (CDNC), enhancing the cloud albedo (Twomey, 1974), and enhancing cloud lifetime and liquid water content by lowering the collision/coalescence rate (Albrecht, 1989). These so-called “indirect effects” of aerosols on liquid wa-ter clouds are referred to as the cloud albedo or first indirect effect and the cloud lifetime or second indirect effect. Correspondence to: J. Quaas
The radiative forcing due to these aerosol indirect effects (AIE), defined as the perturbation of the short-wave net ra-diative flux at the top of the atmosphere, is still highly un-certain. Some years ago, the possible range was estimated to be −2 to 0 Wm−2for the cloud albedo effect (Boucher and Haywood, 2001). A recent review of current model-based estimates yields values between −1.9 and −0.5 Wm−2 for the cloud albedo effect, and between −1.4 and −0.3 Wm−2 for the cloud lifetime effect (Lohmann and Feichter, 2005). However, it has been shown that such a large (negative) aerosol forcing is inconsistent with values obtained from in-verse studies trying to infer aerosol forcing and climate sensi-tivity from the climate records (Anderson et al., 2003). This is confirmed by studies constraining aerosol indirect effects using satellite-derived relationships of cloud-top droplet ef-fective radius and aerosol concentration, which reduces the associated radiative forcing by roughly a factor of two for the cloud albedo effect (Quaas and Boucher, 2005) and for the total aerosol indirect effect (Lohmann and Lesins, 2002). From POLarization and Directionality of the Earth’s Re-flectances (POLDER) satellite data alone, assuming a certain increase in global-mean aerosol concentration, Sekiguchi et al. (2003) derive a radiative forcing by the cloud albedo effect in the range of −0.4 to −0.1 Wm−2using different methods. These studies use statistical relationships between satellite-derived cloud-top droplet effective radius (CDR) and aerosol concentration measured in terms of the POLDER “aerosol index” (AI; Br´eon et al., 2002; Quaas et al., 2004), where the magnitude of the aerosol indirect effect may be measured as the slope of this relationship (e.g., Feingold et al., 2003). As for the cloud lifetime effect, a recent modelling study also suggests a radiative forcing much smaller than previously es-timated (Rotstayn and Liu, 2005).
It has been argued that when taking the second aerosol indirect effect into account, the CDR-AI relationship may represent the joint influence of the cloud albedo and cloud
948 J. Quaas et al.: Constraining the aerosol indirect effect
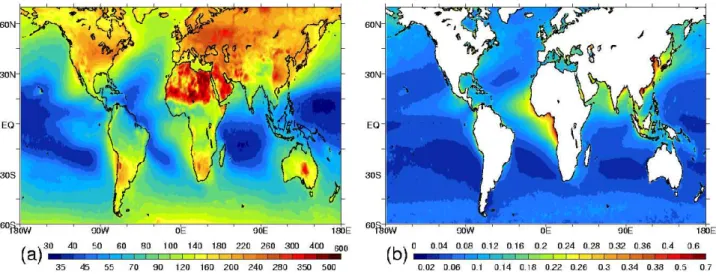
Fig. 1. Annual mean (five-year average) (a) cloud droplet number concentration (cm−3)and (b) fine-mode aerosol optical depth (AODFM, unitless) as derived from MODIS.
lifetime effects, as the former leads to a decrease in CDR with increasing aerosol concentration (through increasing CDNC), while the latter could lead to an increase in CDR (through increasing cloud water content; Quaas et al., 2004). In the present study, thus, we opt for a different measure of the aerosol indirect effect, which is the relationship between CDNC and aerosol concentration. CDNC has the advantage to be independent of the cloud liquid water content. The CDNC to fine-mode aerosol optical depth (AODFM) rela-tionship is then established from satellite data, and the model parameterizations are adjusted to produce the same relation-ship.
2 Method
The tools used in this study are satellite data from the MOD-erate Resolution Imaging Spectroradiometer (MODIS) and the two general circulation models (GCMs) of the Labora-toire de M´et´eorologie Dynamique (LMD-Z), and the Max Planck Institute for Meteorology (ECHAM4).
We are using data from the MODIS instrument on board the Terra satellite for a five-year period between March 2000 and February 2005. Aerosol optical depth is derived at 550 nm (Remer et al., 2005), as well as the fraction of fine particles (yielding the fine-mode aerosol optical depth, AODFM). We use the data derived over oceans only be-cause of their better accuracy. It is recognized, indeed, that the AODFM is not reliable over land (Y. Kaufman, personal communication). Cloud droplet effective radius and cloud optical depth in the solar spectrum (COD) are derived in the 2.1 µm channel assuming plane-parallel homogeneous clouds above a black surface in combination with a non-absorbing channel at 0.86 µm (Platnick et al., 2003). We
calculate the cloud droplet number concentration from re-trieved, quality-assured CDR and COD assuming adiabatic clouds as proposed by Brenguier et al. (2000) and Sch¨uller et al. (2005). The assumption implies adiabatically ascending air parcels within a cloud with a constant cloud droplet num-ber concentration in the vertical, while liquid water content and thus cloud droplet radius increase monotonically. Hence, the cloud droplet number concentration can be expressed in terms of the cloud-top droplet effective radius, re, and the visible cloud optical depth, τc, as:
Nd =ατc0.5re−2.5 (1)
Ndin the above equation is derived from the combination of Eqs. (10) and (13) of Brenguier et al. (2000), with the coef-ficient α=1.37 10−5m−0.5 derived from the constants given in their study. To compute CDNC from MODIS retrievals of COD and CDR, we choose only those data pixels, where the retrieval is the most reliable (in the interval 4 µm≤re≤30 µm and 4≤τc≤70; Nakajima and King, 1990), and where the grid-box mean cloud top temperature is larger than 273 K to assure that only liquid water clouds are considered. We compute CDNC from the joint histograms of COD and CDR at a 1◦×1◦ horizontal and daily temporal resolution1. The annual mean distribution is shown in Fig. 1a. As expected, CDNC is larger over continents than over oceans. Limited re-liability of MODIS retrievals at very high latitudes and over deserts may imply that the very large CDNC over these re-gions are unrealistic. Generally, CDNC is larger over the northern than over the southern hemisphere. Over oceans, it is largest in coastal zones, particularly in the lee of the north-ern hemisphere continents. Over oceans, a marked merid-ional gradient is found with larger CDNC over high latitudes 1The dataset may be downloaded at http://doi.tib.uni-hannover.
de:8000/ under doi:10.1594/WDCC/MODIS CDNC.
than over the tropics. The CDNC distribution corresponds well to the distribution of the AODFM (Fig. 1b), except for large AODFM at low latitudes, where CDNC is low. Sup-posedly, industrial pollution aerosols near the northern hemi-sphere coasts contribute to AODFM, and by acting as CCN, they increase CDNC in these regions. Due to their abundance over deserts, dust aerosols contribute largely to low-latitude AODFM but because they are less numerous and less hygro-scopic, they result in less CCN.
The distribution of the CDNC derived here can be com-pared to the column-CDNC (CCDNC) as derived by Han et al. (1998) from AVHRR data. These authors define the CCDNC, denoted Nc, as the product of cloud geometrical thickness and CDNC, and compute it from the retrieved CDR and COD as Nc=βτcre−2 with β=0.32 m
−1. The same re-lation but with β=0.33 m−1 is found when computing the product of CDNC and cloud geometrical thickness using the adiabatic assumption and the parameters given by Bren-guier et al. (2000). The distributions of CDNC as derived here from MODIS data and CCDNC of Han et al. (1998) show very similar features, including the meridional gradi-ent. Interestingly, even though CCDNC includes the effect that high-latitudes clouds typically have smaller geometrical thickness, the meridional gradient is found for both CDNC and CCDNC.
Uncertainties in the so-derived CDNC arise especially be-cause of uncertainties in the satellite-retrieved CDR (Br´eon and Doutriaux-Boucher, 2005), and because MODIS-derived CDR is representative for the uppermost part of the cloud rather than the very cloud top (Platnick, 2000).
When comparing the data to the GCMs, we use a daily temporal resolution, and we regrid the satellite data to the coarser horizontal resolution of the GCMs before deriving the AODFM to CDNC relationships. Due to the lack of reli-able AODFM retrievals over land, only ocean grid points are taken.
2.1 The LMDZ GCM
We use the Laboratoire de M´et´eorologie Dynamique (LMD-Z3.3) GCM (Li, 1999) in a resolution of 96×72 grid-points horizontally with 19 vertical layers. We apply the warm cloud microphysical scheme of Boucher et al. (1995) which parameterizes the impact of droplet size on precipitation for-mation in the autoconversion scheme. A multi-component aerosol model calculates interactively the cycles of sulphate aerosols (Boucher et al., 2002), organic and black car-bon, dust, and sea salt (Reddy et al., 2005). Emissions are from the AEROCOM project (http://nansen.ipsl.jussieu. fr/AEROCOM). To diagnose cloud droplet number con-centration we use the “empirical” formula of Boucher and Lohmann (1995, hereafter BL95):
Nd=exp(a0+a1ln maer) (2)
where maer is the aerosol mass concentration in µg m−3 (taken here as the total mass of all potential cloud conden-sation nuclei) and a0 and a1 are parameters (a0=5.1 and a1=0.41 for the formula “D” of BL95 used in our control sim-ulation), which have been derived by compiling several in-situ measurement studies in the North Atlantic region. Sim-ulations are done for three years using observed sea surface temperature (SST) and sea ice distributions.
2.2 The ECHAM4 GCM
The ECHAM4 GCM (Roeckner et al., 1996) used in this study is described in Lohmann and Lesins (2003). Prog-nostic aerosol variables are the mass mixing ratios of sul-phate, methanesulphonate, hydrophilic and hydrophobic or-ganic carbon, hydrophilic and hydrophobic black carbon, sub- and supermicron dust, and sub- and supermicron sea salt. Transport, dry and wet deposition, and chemical trans-formations of the aerosols and gaseous precursors are cal-culated on-line with the GCM (Feichter et al., 1996). The emissions for the different species are as in Lohmann et al. (2000). The total number concentration of hydrophilic aerosols, which is used for cloud droplet activation at cloud base, is obtained by assuming an external mixture. The mass of each aerosol component is converted into an aerosol parti-cle number assuming a separate lognormal distribution with a fixed dry density, dry modal radius and geometric width for each type (Hess et al., 1998).
The prognostic cloud variables are the mass mixing ratios of cloud liquid water and cloud ice and the number concen-trations of cloud droplets and ice crystals, as described in Lohmann and K¨archer (2002). The equilibrium cloud droplet concentration at cloud base of stratiform clouds is obtained from the number of hydrophilic aerosols and the vertical ve-locity (Lin and Leaitch, 1997; hereafter LL97):
Nd =0.1[Naw/(w + b0Na)]b1 (3)
where b0=0.023 cm4s−1, b1=1.27, and w is the vertical locity obtained as the sum of the grid-box mean vertical ve-locity wm and a turbulent contribution expressed in terms of the turbulent kinetic energy TKE (w=wm+b2
√ TKE; b2=1.33) (Lohmann, 2002). The autoconversion rate, which determines the cloud lifetime effect, is parameterized follow-ing Khairoutdinov and Kogan (2000).
All simulations were conducted in T30 horizontal reso-lution with 19 vertical levels and a 30 min time-step. The simulations were run over a period of 5 years after an initial spin-up of 3 months using climatological sea surface temper-atures and sea ice extent.
950 J. Quaas et al.: Constraining the aerosol indirect effect
1
0.01 0.1
Aerosol optical depth (fine mode), τaer 0 50 100 150 200 250 300
Droplet number concentration, N
d [cm -3 ]
MODIS
LMDZ
ECHAM
1 0.01 0.1Aerosol optical depth (fine mode), τaer 0 50 100 150 200 250 300
Droplet number concentration, N
d [cm -3 ]
MODIS
LMDZ
ECHAM
(a)
(a)
(a)
(a)
(b)
(a)
(b)
(a)
(b)
Fig. 2. CDNC-AODFM relationships over ocean, as given by MODIS (black, circles), and the LMDZ (red, squares), and ECHAM4 (green,
diamonds) GCMs using (a) the original and (b) the adjusted parameterizations. Error bars show ±1 standard deviation within each bin.
3 Results
3.1 CDNC-AODFM-relationship using the original param-eterizations
Figure 2a shows the relationship between CDNC and AODFM over oceans, as given from MODIS compared to the results from the GCMs. LMDZ strongly overestimates CDNC, and the slope of the relationship is too steep. Also, the variability, expressed in terms of standard deviation, is too large. For ECHAM4, these findings are even more pro-nounced except for very small AODFM.
Since the adiabatic CDNC used here does not depend on cloud water content and cloud geometry, the CDNC-AODFM relationship over oceans and over continents should be approximately the same. We also assume here that the sys-tematic difference in vertical velocity over oceans and con-tinents do not result in systematically different relationships between CDNC and AODFM. The absence of AODFM data over continents thus does imply a limitation for our study. In Fig. 2, AODFM bins are chosen so that each bin contains the same number of measurements, so that the distribution of the points along the AODFM axis gives an indication of the AODFM histogram for both the models and the satellite-retrievals. These histograms roughly agree, implying that the models simulate AODFM distributions well enough to apply our method.
3.2 Fitting the parameterizations
For the LMDZ GCM, we adjust a0 and a1 of the BL95 formula (Eq. 2), so that the model reproduces the CDNC-AODFM relationship. Rather than exploiting the full range
of possibilities for (a0, a1), we diagnose the parameters by fitting a relationship of the form Nd=exp(d0+d1lnτa,f m)to the satellite data (getting d0=5.0 and d1=0.30), and a lin-ear relationship between fine-mode aerosol optical thick-ness and cloud-base aerosol mass concentration as given by LMDZ model results (ma=γ τa,f m; getting γ =0.1). Combin-ing these two relationships results in a0=d0+d1lnγ =4.3 and a1=d1=0.30.
For the ECHAM4 GCM, the fitted parameters of the LL97 formula (Eq. 3) are b1=1.0 and b2=0.667, while b0=0.023 cm4s−1remains unchanged.
Figure 2b shows the adjusted relationships over oceans, where the mean values now match well the observations. Only for very large AODFM, the simulated relationship from LMDZ shows slightly lower CDNC than the observations. Such situations, however, constitute only about 10% of the cases. The variability is not very well reproduced. Both models simulate too little variability at smaller aerosol con-centrations, and for larger aerosol concentrations LMDZ still predicts too low variability, while for ECHAM4 the oppo-site is true. This different behaviour of the two parame-terizations may be explained by the fact that LMDZ uses only the aerosol concentration to diagnose the CDNC, while ECHAM4 also takes the updraft velocity into account. 3.3 Radiative forcings
Figure 3 shows the resulting annual mean radiative forc-ings from the models, comparing the original parameteri-zations to the adjusted ones. The radiative forcing is de-fined here as the difference in top-of-the-atmosphere short-wave net radiative flux between two multi-annual simula-tions, where the first simulation uses present-day and the
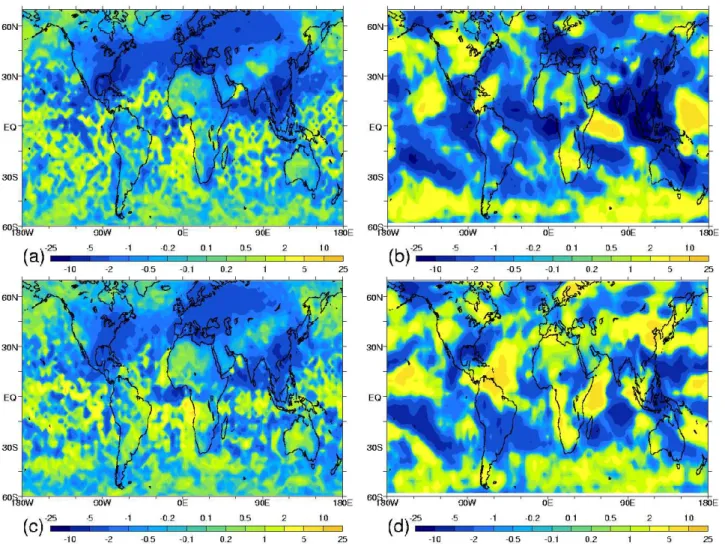
Fig. 3. Annual mean radiative forcing by the total (cloud albedo and cloud lifetime) aerosol indirect effect (Wm−2) as simulated using the original parameterizations by (a) LMDZ and (b) ECHAM4, and using the adjusted parameterizations by (c) LMDZ and (d) ECHAM4.
second one pre-industrial aerosol emissions for the diagnos-tics of the CDNC. It is thus not a radiative forcing in the strict sense, but rather a quasi-forcing (Rotstayn and Penner, 2001) or a radiative forcing in the sense of the “fixed SST forcing” defined by Hansen et al. (2002) and similar to the alterna-tive proposed by Shine et al. (2003). The radiaalterna-tive forcing is smaller in LMDZ than in ECHAM4 and more concentrated in the northern hemisphere. Due to its somewhat coarser hor-izontal resolution, ECHAM4 shows less small-scale variabil-ity than LMDZ. When comparing the control with the ad-justed parameterizations, for both models, a reduction in the radiative forcing is simulated (−37% for LMDZ and −81% for ECHAM4). Table 1 summarizes the global annual mean radiative forcings for the two sets of simulations with the two models.
Table 1. Global annual mean radiative forcings by the total aerosol
indirect effect.
Experiment Standard (Wm−2) Modified (Wm−2) LMDZ −0.84 −0.53
ECHAM4 −1.54 −0.29
4 Discussion
The difference in radiative forcing between the original and the adjusted version of the LMDZ model as obtained by the present study (−37%) is smaller than what has been found in a previous study analyzing the relationship be-tween cloud-top droplet effective radius (CDR) and aerosol concentration. For LMDZ, the fit of the model parame-terization to the satellite-retrieved relationship resulted in a
952 J. Quaas et al.: Constraining the aerosol indirect effect
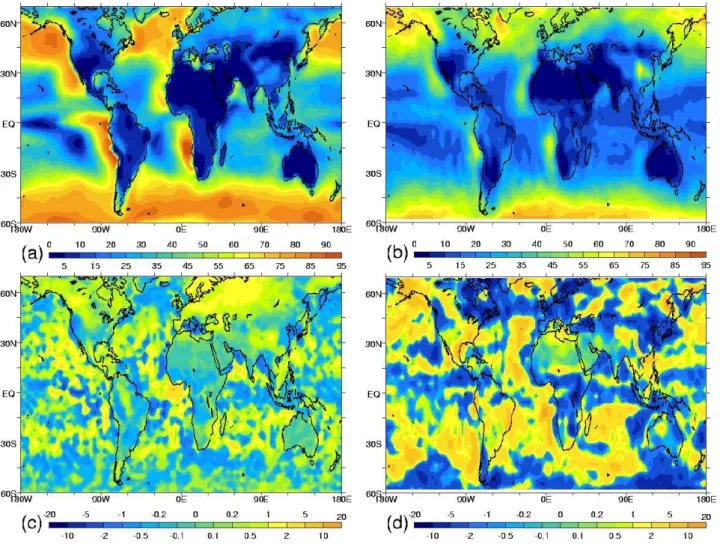
Fig. 4. Annual mean fine-mode aerosol optical depth (AODFM, unitless) for present-day conditions as simulated with the adjusted
param-eterizations by (a) LMDZ and (b) ECHAM4, and anthropogenic AODFM fraction (%) deduced from the present-day and pre-industrial simulations for (c) LMDZ and (d) ECHAM4.
reduction of the radiative forcing by the first aerosol indi-rect effect by roughly 50% down to −0.4 to −0.3 Wm−2 (Quaas and Boucher, 2005). The smaller reduction when fit-ting the CDNC-AODFM relationship is in agreement with former suspicions that the CDR-AI relationship is influenced by both aerosol indirect effects. It is intended to reflect the cloud albedo effect showing a decrease in CDR with increas-ing aerosol concentration, but may be influenced by the cloud lifetime effect, with CDR increasing with increasing aerosol concentration due to increasing cloud liquid water content. A fit of the CDNC parameterization to the CDR-AI rela-tionship thus potentially yields a too low aerosol indirect effect when neglecting the second indirect effect. In con-trast, for ECHAM4 the reduction in radiative forcing found here (−81%) is stronger than what has been suggested from a previous study comparing simulated and satellite-derived CDR to aerosol concentration relationships. Scaling the to-tal aerosol indirect effect in proportion to the slopes of the
CDR to aerosol concentration relationships as simulated by the model and as obtained from satellite data gave a reduction by 40% down to −0.85 Wm−2(Lohmann and Lesins, 2002). However, one may argue that the adjustment to the model which is done in this study is a more rigorous approach.
The radiative forcing by the aerosol indirect effects as sim-ulated by the two models in the control simulations differs by almost a factor of two. Although the constraint from satellite data consistently reduces the forcing in both models, and al-though the absolute difference is reduced as well, it remains considerable (∼40%). One difference in the model setup is that ECHAM4 includes a direct aerosol effect, while LMDZ does not. This effect, however, is small in ECHAM4, of the order of −0.1 Wm−2(Lohmann and Feichter, 2001). Other model parameters may play a role. For example, for LMDZ, the introduction of a new advanced land-surface scheme re-sulted in a decrease in low-level cloud cover over continents and a reduction of the first aerosol indirect radiative forcing
Fig. 5. Annual mean low-level cloud cover (%) as simulated with the adjusted parameterizations by (a) LMDZ and (b) ECHAM4, and
difference in low-level cloud cover (%) between present-day and pre-industrial conditions from (c) LMDZ and (d) ECHAM4.
by a factor of two (Dufresne et al., 2005). When comparing the distributions of the total aerosol indirect radiative forc-ing between LMDZ and ECHAM4, one can observe that the LMDZ forcing is more concentrated in the northern hemi-sphere over North-East America, Europe, and East Asia, while in ECHAM4, it is strong also at low latitudes, with a maximum over South-East Asia. Apart from the parame-terization for CDNC analyzed in the present study, two main factors control the strength of the aerosol indirect radiative forcing, which are the anthropogenic aerosol concentration, and the amount of liquid water clouds. In Fig. 4, we com-pare the AODFM simulated by the adjusted model versions, and its anthropogenic fraction computed from the present-day and pre-industrial simulations. LMDZ simulates a larger AODFM than ECHAM4, with a strong contribution of sub-micronic dust over North-West Africa, and with particularly larger AODFM over the American continents. The relative contribution of anthropogenic aerosols to AODFM is much larger in ECHAM4 than in LMDZ for all regions.
Espe-cially over large parts of East Asia, and over low-latitude and southern hemisphere continents, ECHAM4 simulates a large anthropogenic aerosol fraction, where LMDZ does not. This explains to some extent the different distributions of the aerosol indirect forcing in the two models. Figure 5 shows the low-level cloud cover in the two models, and the differ-ence in low-level cloud cover between the present-day and pre-industrial conditions. The main difference is that LMDZ simulates more clouds over the oceans and less clouds over the continents, in particular over the high latitudes of the northern hemisphere. When comparing present-day to pre-industrial aerosol conditions, LMDZ simulates a consistent increase in low-level cloud cover only over the European and West-Asian continent, while ECHAM4 simulates strong in-creases in low-level cloud cover also over South-East Asia, and over the Pacific and South-Atlantic oceans. This con-tributes to the larger aerosol indirect radiative forcing at low latitudes and in the southern hemisphere as simulated by ECHAM4 compared to LMDZ, too. Generally, ECHAM4
954 J. Quaas et al.: Constraining the aerosol indirect effect simulates a stronger variability of cloud properties. The
larger low-level cloud cover increase in ECHAM4 indicates a more important cloud lifetime effect in this model. The two aerosol indirect effects can be separated when using off-line aerosol concentrations. Using such versions of the mod-els (with their original parameterizations), ECHAM4 and LMDZ simulate ratios between the cloud lifetime and cloud albedo effects of 1.4 and 1.1, respectively, in agreement with the above explanation (see Lohmann and Feichter, 2005, for an intercomparison). While the constraints from observa-tional data presented here narrow down the uncertainties on the cloud albedo effect, a better constraint of the cloud life-time effect is needed through measurements of cloud liquid water content and drizzle rate. This needs to be addressed by future investigations (Lohmann et al., 20062).
5 Conclusions
The present study evaluates and improves the representation of the aerosol indirect effect as parameterized in two gen-eral circulation models by constraining the simulated sta-tistical relationship between cloud droplet number concen-tration and fine-mode aerosol optical depth with satellite-retrieved data. Both original parameterizations overesti-mated the slope of the relationship when compared to satel-lite data, which represents the strength of the aerosol indi-rect effect. Fitting the parameters yields a good match of the CDNC-AODFM relationship from the satellite data. How-ever, the variability is often too small in the models.
The model-simulated radiative forcing by the aerosol in-direct effect is quite different for both models (−0.84 Wm−2 for LMDZ and −1.54 Wm−2 for ECHAM4 in the control simulations), but it is consistently reduced when applying the fitted parameterizations by 37 and 81%, for LMDZ and ECHAM4, respectively. The difference in radiative forcing is reduced too, but remains large in relative terms. Expla-nations for this are differences in simulated aerosol concen-tration and its anthropogenic fraction, and a stronger cloud variability and second aerosol indirect effect in ECHAM4 than in LMDZ.
Compared to the data from field experiments, from which the original parameterizations applied in the GCMs have been derived, the satellite data used here have the advantage to supply a much broader basis for the statistics, with much more datapoints (∼107), well distributed on the globe and among the different seasons. Also, the spatial and tempo-ral resolutions are well suited for the comparison to GCMs, which may be of importance (Sekiguchi et al., 2003; Quaas et al., 2004). However, the satellite retrievals provide only two-dimensional data, and assumptions have to be used to derive 2Lohmann, U., Feichter, J., Kinne, S., and Quaas, J.:
Ap-proaches for constraining global climate models of the anthro-pogenic indirect aerosol effect, Bull. Amer. Meteorol. Soc., sub-mitted, 2006.
the physical quantities. Furthermore, satellite retrievals of aerosol concentration are possible only in cloud-free condi-tions and are not as reliable over land as over oceans. When relating such aerosol retrievals to the cloud retrievals in the same grid-box, we assume therefore that aerosol concentra-tions are homogeneous throughout the grid-box. Thus, future studies using the upcoming spaceborne active remote sens-ing instruments (lidar/radar) will be essential to confirm our results. Also, with these new observations and more comput-ing power, more elaborate parameterizations of the aerosol indirect effects can be designed and evaluated.
Acknowledgements. Computer time was provided by the “Institut
de D´eveloppement et des Resources en Informatique Scientifique” (IDRIS) of the CNRS and the German Klimarechenzentrum (DKRZ). The MODIS instrument is operated by the National Aeronautics and Space Agency (NASA), which we acknowledge for their data. We thank J.-L. Brenguier and L. Sch¨uller for useful comments on this study. The work of O. Boucher forms part of the Climate Prediction Programme of the UK Department for Environ-ment, Food and Rural Affairs (Defra) under contract PECD 7/12/37. Edited by: A. Nenes
References
Albrecht, B. A.: Aerosols, cloud microphysics, and fractional cloudiness, Science, 245, 1227–1230, 1989.
Anderson, T. L., Charlson, R. J., Schwartz, S. E., Knutti, R., Boucher, O., Rodhe, H., and Heintzenberg, J.: Climate forcing by aerosols – A hazy picture, Science, 300, 1103–1104, 2003. Boucher, O. and Lohmann, U.: The sulphate-CCN-cloud albedo
effect – a sensitivity study with two general circulation models, Tellus, 47B, 281–300, 1995.
Boucher, O., Le Treut, H., and Baker, M. B.: Precipitation and ra-diation modeling in a general circulation model: Introduction of cloud microphysical processes, J. Geophys. Res., 100, 16 395– 16 414, 1995.
Boucher, O. and Haywood, J.: On summing the components of radiative forcing of climate change, Clim. Dyn., 18, 297–302, 2001.
Boucher, O., Pham, M., and Venkataraman, C.: Simulation of the atmospheric sulfur cycle in the Laboratoire de M´et´eorologie Dy-namique General Circulation Model. Model description, model evaluation, and global and European budgets, in: Note scien-tifique de l’IPSL, vol. 21, edited by: Boulanger, J.-P. and Li, Z.-X., IPSL, Paris, 26 pp., 2002.
Brenguier, J. L., Pawlowska, H., Sch¨uller, L., Preusker, R., Fis-cher, J., and Fouquart, Y.: Radiative properties of boundary layer clouds: Droplet effective radius versus number concentration, J. Atmos. Sci., 57, 803–821, 2000.
Br´eon, F.-M. and Doutriaux-Boucher, M.: A comparison of cloud droplet radii measured from space, IEEE Trans. Geosci. Remote Sens., 1796–1805, doi:10.1109/TGRS2005.852838, 2005. Br´eon, F.-M., Tanr´e, D., and Generoso, S.: Aerosol effect on cloud
droplet size monitored from satellite, Science, 295, 834–838, 2002.
Dufresne, J.-L., Quaas, J., Boucher, O., Denvil, S., and Fairhead, L.: Contrasts in the effects on climate of anthropogenic sulphate aerosols between the 20th and 21st century, Geophys. Res. Lett., 32, L21703, doi:10.1029/2005GL023619, 2005.
Feichter, J., Kjellstr¨om, E., Rodhe, H., Dentener, F., Lelieveld, J., and Roelofs, G.-J.: Simulation of the tropospheric sulfur cycle in a global climate model, Atmos. Environ., 30, 1693–1707, 1996. Feingold, G., Eberhard, W. L., Veron, D. E., and Previdi,
M.: First measurements of the Twomey indirect effect using ground-based remote sensers, Geophys. Res. Lett., 30, 1287, doi:10.1029/2002GL016633, 2003.
Han, Q., Rossow, W. B., Chou, Y., and Welch, R. M.: Global vari-ation of column droplet concentrvari-ation in low-level clouds, Geo-phys. Res. Lett., 25, 1419–1422, 1998.
Hansen, J., Sato, M., Nazarenko, L., et al.: Climate forcings in God-dard Institute for Space Studies SI2000 simulations, J. Geophys. Res., 107(D18), 4347, doi:10.1029/2001JD001143, 2002. Hess, M., Koepke, P., and Schult, I.: Optical properties of aerosols
and clouds: The software package OPAC, Bull. Amer. Meteorol. Soc., 79, 831–844, 1998.
Khairoutdinov, M. and Kogan, Y.: A new cloud physics parameteri-zation in a large-eddy simulation model of marine stratocumulus, Mon. Wea. Rev., 128, 229–243, 2000.
Li, Z.-X.: Ensemble atmospheric GCM simulation of climate inter-annual variability from 1979 to 1994, J. Climate, 12, 986–1001, 1999.
Lin, H. and Leaitch, W. R.: Development of an in-cloud aerosol activation parameterization for climate modelling. Proceedings of the WMO Workshop on Measurement of Cloud Properties for Forecasts of Weather, Air Quality and Climate, Mexico City, June, 328–335, 1997.
Lohmann, U.: Possible aerosol effects on ice clouds via contact nucleation, J. Atmos. Sci., 59, 647–656, 2002.
Lohmann, U. and Feichter, J.: Can the direct and semi-direct aerosol effect compete with the indirect effect on a global scale?, Geo-phys. Res. Lett., 28, 159–161, 2001.
Lohmann, U. and Feichter, J.: Global indirect aerosol effects: A review, Atmos. Chem. Phys., 5, 715–737, 2005.
Lohmann, U., Feichter, J., Penner, J., and Leaitch, R.: Indi-rect effect of sulfate and carbonaceous aerosols: A mecha-nistic treatment, J. Geophys. Res., 105(D10), 12 193–12 206, doi:10.1029/1999JD901199, 2000.
Lohmann, U. and K¨archer, B.: First interactive simulations of cirrus clouds formed by homogeneous freezing in the ECHAM GCM, J. Geophys. Res., 107, 4105, doi:10.1029/2001JD000767, 2002. Lohmann, U. and Lesins, G.: Stronger constraints on the anthro-pogenic indirect aerosol effect, Science, 298, 1012–1015, 2002. Lohmann, U. and Lesins, G.: Comparing continental and oceanic
cloud susceptibilities to aerosols, Geophys. Res. Lett., 30, 1791, doi:10.1029/2003GL017828, 2003.
Nakajima, T. and King, M. D.: Determination of the optical thick-ness and effective particle radius of clouds from reflected solar radiation measurements. Part I: Theory, J. Atmos. Sci., 47, 1878– 1893, 1990.
Platnick, S.: Vertical photon transport in cloud remote sensing prob-lems, J. Geophys. Res., 105, 22 919–22 935, 2000.
Platnick, S., King, M. D., Ackerman, S. A., Menzel, W. P., Baum, B. A., Ri´edi, J. C., and Frey, R. A.: The MODIS cloud products: Algorithms and examples from Terra, IEEE Trans. Geosci. Rem. Sens., 41, 459–473, 2003.
Quaas, J. and Boucher, O.: Constraining the first aerosol in-direct radiative forcing in the LMDZ GCM using POLDER and MODIS satellite data, Geophys. Res. Lett., 32, L17814, doi:10.1029/2005GL023850, 2005.
Quaas, J., Boucher, O., and Br´eon, F.-M.: Aerosol indirect effects in POLDER satellite data and in the LMDZ GCM, J. Geophys. Res., 109, D08205, doi:10.1029/2003JD004317, 2004.
Ramaswamy, V., Boucher, O., Haigh, J., Hauglustaine, D., Hay-wood, J., Myhre, G., T., Shi, G. Y., and Solomon, S.: Radiative forcing of climate change, in: Climate change 2001 – The scien-tific basis, Contribution of working group I to the Third Assess-ment Report of the IntergovernAssess-mental Panel on Climate Change, edited by: Houghton, J. T., Ding, Y., Griggs, D. J., Noguer, M., van der Linden, P. J., Dai, X., Maskell, K., and Johnson, D. J., Cambridge University Press, Cambridge, p. 349–416, 2001. Reddy, M. S., Boucher, O., Bellouin, N., Schulz, M.,
Balkan-ski, Y., Dufresne, J.-L., and Pham, M.: Estimates of multi-component aerosol optical depth and direct radiative perturba-tion in the LMDZT General Circulaperturba-tion Model, J. Geophys. Res., 110, D10S16, doi:10.1029/2004JD004757, 2005.
Remer, L. A., Kaufman, Y. J., Mattoo, S., Martins, J. V., Ichoku, C., Levy, R. C., Kleidman, R. G., Tanr´e, D., Chu, D. A., Li, R. R., Eck, T. F., Vermote, E., and Holben, B. N.: The MODIS algorithm, products, and validation, J. Atmos. Sci., 62, 947–973, doi:10.1175/JAS3385.1, 2005.
Roeckner, E., Arpe, K., Bengtsson, L., et al.: The atmospheric gen-eral circulation model ECHAM4: Model description and simu-lation of the present day climate, Tech. Rep., 218, Max-Planck-Inst. f¨ur Meteorol., Hamburg, Germany, 1996.
Rotstayn, L. D. and Liu, Y.: A smaller global estimate of the sec-ond indirect aerosol effect, Geophys. Res. Lett., 32, L05708, doi:10.1029/2004GL021922, 2005.
Rotstayn, L. D. and Penner, J. E.: Indirect aerosol forcing, quasi-forcing and climate response, J. Climate, 20, 2960–2975, 2001. Sch¨uller, L., Bennartz, R., Fischer, J., and Brenguier, J.-L.: An
al-gorithm for the retrieval of droplet number concentration and ge-ometrical thickness of stratiform marine boundary layer clouds applied to MODIS radiometric observations, J. Appl. Meteorol., 44, 28–38, 2005.
Sekiguchi, M., Nakajima, T., Suzuki, K., Kawamoto, K., Higurashi, A., Rosenfeld, D., Sano, I., and Mukai, S.: A study of the direct and indirect effects of aerosols using global satellite data sets of aerosol and cloud parameters, J. Geophys. Res., 108(D22), 4699, doi:10.1029/2002JD003359, 2003.
Shine, K. P., Cook, J., Highwood, E. J., and Joshi, M. M.: An alter-native to radiative forcing for estimating the relative importance of climate change mechanisms, Geophys. Res. Lett., 30, 2047, doi:10.1029/2003GL018141, 2003.
Twomey, S.: Pollution and the planetary albedo, Atmos. Environ., 8, 1251–1256, 1974.