HAL Id: hal-00295529
https://hal.archives-ouvertes.fr/hal-00295529
Submitted on 15 Sep 2004
HAL is a multi-disciplinary open access
archive for the deposit and dissemination of
sci-entific research documents, whether they are
pub-lished or not. The documents may come from
teaching and research institutions in France or
abroad, or from public or private research centers.
L’archive ouverte pluridisciplinaire HAL, est
destinée au dépôt et à la diffusion de documents
scientifiques de niveau recherche, publiés ou non,
émanant des établissements d’enseignement et de
recherche français ou étrangers, des laboratoires
publics ou privés.
Soot aging time scales in polluted regions during day
and night
N. Riemer, H. Vogel, B. Vogel
To cite this version:
N. Riemer, H. Vogel, B. Vogel. Soot aging time scales in polluted regions during day and night.
Atmospheric Chemistry and Physics, European Geosciences Union, 2004, 4 (7), pp.1885-1893.
�hal-00295529�
www.atmos-chem-phys.org/acp/4/1885/
SRef-ID: 1680-7324/acp/2004-4-1885
Chemistry
and Physics
Soot aging time scales in polluted regions during day and night
N. Riemer1, H. Vogel2, and B. Vogel2
1Center for Turbulence Research, Stanford University, Stanford, USA
2Institut f¨ur Meteorologie und Klimaforschung, Forschungszentrum Karlsruhe, Karlsruhe, Germany
Received: 2 March 2004 – Published in Atmos. Chem. Phys. Discuss.: 16 April 2004 Revised: 6 September 2004 – Accepted: 6 September 2004 – Published: 15 September 2004
Abstract. The aging of soot is one of the key
uncertain-ties in the estimation of both the direct and indirect climate effect. While freshly emitted soot is initially hydrophobic and externally mixed, it can be transferred into an internal mixture by coagulation, condensation or photochemical pro-cesses. These aging processes affect the hygroscopic qual-ities and hence the growth behaviour, the optical properties and eventually the lifetime of the soot particles. However, due to computational limits the aging of soot in global cli-mate models is often only parameterised by an esticli-mated turnover rate resulting in a lifetime of soot of several days. Hence, the aging process of soot is one of the key uncertain-ties governing the burden and effect of black carbon. In this study, we discuss the time scale on which diesel soot is trans-ferred from an external to an internal mixture based on the results of our simulations with a comprehensive mesoscale model. For daytime conditions during summer condensation of sulphuric acid is dominant and the aging process occurs on a time scale of τ =8 h close to the sources and τ =2 h above the source region. During winter comparable time scales are found but ammonium nitrate becomes more important. Dur-ing night time condensation is not effective. Then coagula-tion is the most important aging process and our results show time scales between 10 h and 40 h.
1 Introduction
Soot particles are an important constituent of the atmo-spheric aerosol, since they participate in tropoatmo-spheric chem-istry (Saathoff et al., 2001), affect human pulmonary health (Pope and Dockery, 1996) and scatter and absorb light (Hor-vath, 1993). The size distribution of soot particles peaks in the accumulation range, therefore dry deposition veloc-Correspondence to: B. Vogel
ities are small and soot particles can attain long lifetimes and be transported over long distances. The source of soot particles is the incomplete combustion of carbon contain-ing material, which means that except for natural biomass burning all sources of soot are anthropogenic. In cities of the northern hemisphere the combustion of fossil fuel dom-inates the sources. Typical concentrations of soot range between several hundreds of nanograms per m3 in unpol-luted areas to several micrograms per m3 in urban regions (Heintzenberg, 1988; Br´emond, 1989; Baltensperger et al., 2002). While freshly emitted soot particles are hydrophobic and present in an external mixture their hygroscopic qualities can change due to the coagulation with soluble aerosols, con-densation, and photochemical processes (Weingartner et al., 1997). Hereby the particle growth in response to ambient rel-ative humidity, the optical properties, and the ability of being activated as cloud condensation nuclei are determined. Mea-surements show that both the external and the internal mixing state exist in the atmosphere (Okada, 2001) and that the hy-drophobic portion of the aerosols decreases significantly as the distance from the sources increases.
It is well recognized that soot particles contribute to both the direct and indirect climate effect. While Lesins et al. (2002) and Jacobson (2000) recently studied the direct effect; Nenes et al. (2002) highlighted the indirect effect. A number of studies in the past have been devoted to the rep-resentation of soot in global scale models (Liousse, 1996; Cooke et al., 1996, 1999; Lohmann et al., 2000) and the im-pact of soot aerosol on global climate (Jacobson, 2002). Due to computational limits the aging of soot in global scale mod-els is often not represented explicitly but parameterised. For example, Liousse (1996) assume that soot is hydrophilic as soon as it is emitted. Myhre et al. (1998), in contrast, hy-pothesize soot to be hydrophobic. Tsigaridis and Kanaki-dou (2003) assume that the aging process occurs due to pho-tochemical reactions. Cooke et al. (1996) parameterise the aging process by an estimated turnover rate of 1.25% h−1,
1886 N. Riemer et al.: Soot aging time scales in polluted regions
which translates to an exponential lifetime of 80 h. Lohmann et al. (2000) assume an exponential lifetime of 40 h empha-sizing however, that the model results are highly sensitive to the turnover rate. Koch (2001) comes to a similar conclusion comparing three different methods for the parameterisation of the aging process.
Recently, Wilson et al. (2001) have provided a more de-tailed representation of the aging process in a global model. In their approach they explicitly calculate the aging of soot depending on the abundance of sulphuric acid. Neverthe-less, parameterisations of certain processes are still necessary when such global models are run in the climate mode, that is when several hundreds of years are simulated.
Since the aging process is one of the key uncertainties governing the burden and effect of black carbon, we find it worthwhile to carry out 3D simulations with the coupled mesoscale-γ model KAMM/DRAIS (Vogel et al., 1995) that provides a highly resolved boundary layer and allows for an explicit treatment of the aging process of soot by coagula-tion and condensacoagula-tion to investigate the variability of the ag-ing time scale of soot in more detail. The particle phase is treated with the aerosol model MADEsoot (Riemer et al., 2003b) and calculates both the composition and the size dis-tribution of the aerosol particles. Based on the results of our simulations, we discuss the time scale on which soot is trans-ferred from an external to an internal mixture, and calculate the turnover rates for a domain size that compares to the grid size of a global climate model. In doing so, we focus on continental conditions in an industrialised environment and investigate two different meteorological scenarios, that is a summer and a winter episode.
2 Model description
The comprehensive model system KAMM/DRAIS couples the non-hydrostatic meteorological driver KAMM and the submodule DRAIS that calculates the transport and diffusion of the reactive trace gases and the aerosol particles. Since the model system KAMM/DRAIS has been described in detail in previous papers (Vogel et al., 1995; Hammer et al., 2002) and has been extensively validated against observations in the past (Vogel et al., 1995; Nester et al., 1995; Fiedler et al., 2000; Corsmeier et al., 2002; Hammer et al., 2002) we only give a short summary with the focus on the aerosol model MADEsoot (Riemer et al., 2003b).
In MADEsoot, several overlapping modes represent the aerosol population, which are approximated by log-normal functions. Currently, we use five modes for the sub-micron particles. Two modes (if and jf) represent secondary in-organic particles consisting of sulphate, ammonium, nitrate, secondary organic compounds, and water, one mode (s) rep-resents pure soot and two more modes (icand jc) represent particles consisting of sulphate, ammonium, nitrate, organic compounds, water and soot. The modes if, jf, icand jcare
assumed to be internally mixed. Thus, the modes if and jf represent soot-free particles whereas the modes icand jc rep-resent soot containing particles or, in other words, the aged soot particles. All modes are subject to condensation and coagulation. The growth rate of the particles due to conden-sation is calculated following Binkowski and Shankar (1995) depending on the available mass of the condensable species and the size distribution of particles. With coagulation, the assignment to the individual modes follows Whitby et al. (1991): (1) Particles formed by intramodal coagulation stay in their original modes. (2) Particles formed by intermodal coagulation are assigned to the mode with the larger median diameter. Furthermore, a thermodynamic equilibrium of gas phase and aerosol phase is applied to calculate the concen-trations of sulphate, ammonium, nitrate and water (Kim et al. 1993). The calculation of the thermodynamic equilib-rium follows a bulk approach. This means that the aerosol concentrations summed over all modes enter the calculation. After the equilibrium concentrations are obtained the con-centrations of ammonium, nitrate and water are distributed over the modes depending on the mass fraction of sulphate. The source of the secondary inorganic particles in modes if and jf is the binary nucleation of sulphuric acid and water. The secondary organic compounds are treated according to Schell et al. (2001). The soot particles in mode s are directly emitted into the atmosphere. The source of the particles in modes icand jcis due to the aging process described below. Additionally, sedimentation, advection and turbulent diffu-sion can modify the aerosol distributions.
In this framework, two processes can impact the transfer of soot from the external into the internal mixture, namely coagulation and condensation. Coagulation of soot particles in mode s with particles in modes if, jf, ic or jc transfers the mass of mode s into the modes ic or jc. As a second process, condensation of sulphuric acid on the surface of the soot particles and the subsequent formation of ammonium nitrate can transfer soot into an internal mixture as well. To retain the soot mode for pure soot particles, a criteria must be chosen that determines when the aged soot together with the soluble mass is moved to the modes ic and jc. Weingartner et al. (1997) show, that atmospheric particles can be divided into “more hygroscopic” and “less hygroscopic” depending on their growth behaviour when they are exposed to a relative humidity above 90%. Based on their findings we define that all material of mode s is moved to modes ic and jc if the soluble mass fraction of mode s rises above the threshold value ε=5%.
We do not consider the aging process due to photochemi-cal reactions in this study. This is justified since it was shown by Saathoff et al. (2003) that these reactions do not contribute significantly to this process.
We apply the model to an area in south-western Germany. It covers main parts of Baden – W¨urttemberg and the ad-jacent regions (248×248 km2). The horizontal grid size is 4×4 km2. The biogenic VOC emissions are calculated online
0 50 100 150 200 yi n k m 0 50 100 150 200 x in km 0 0,1 0,2 0,3 0,4 0,5 0,6 0,7 0,8 0,9 1 µg m-3 * Saarbrücken Strasbourg * * Karlsruhe * Stuttgart * Mannheim * Basel 0 50 100 150 200 yi n k m 0 50 100 150 200 x in km 0 0,1 0,2 0,3 0,4 0,5 0,6 0,7 0,8 0,9 1 µg m-3 * Saarbrücken Strasbourg * * Karlsruhe * Stuttgart * Mannheim * Basel
Fig. 1. Horizontal distribution of the externally mixed soot at 20 m above the surface, 12:00 CET, day 2 (left: summer, right: winter).
0 50 100 150 200 yi n k m 0 50 100 150 200 x in km 0 0,1 0,2 0,3 0,4 0,5 0,6 0,7 0,8 0,9 1 µg m-3 * Saarbrücken Strasbourg * * Karlsruhe * Stuttgart * Mannheim * Basel 0 50 100 150 200 yi n k m 0 50 100 150 200 x in km 0 0,3 0,6 0,9 1,2 1,5 1,8 2,1 2,4 2,7 3 µg m-3 * Saarbrücken Strasbourg * * Karlsruhe * Stuttgart * Mannheim * Basel
Fig. 2. Same as Fig. 1, but for internally mixed soot.
depending on the land use, the modelled temperatures and the modelled radiative fluxes (McKeen et al., 1991, Lamb et al., 1987, Vogel et al., 1995). We parameterise the NO emis-sions from the soil according to Ludwig et al. (2001). The anthropogenic emissions of SO2, CO, NOx, NH3, 32 classes
of VOC and diesel soot are pre-calculated with the spatial resolution of 4×4 km2and a temporal resolution of one hour (Obermeier et al., 1995; Wickert et al., 1999; Pregger et al., 1999; Seier et al., 2000). The diesel soot emissions represent the sources by traffic. In addition to the source strength, we must prescribe the median diameter and the standard devi-ation of the emitted soot particle distribution. The median diameter is fixed to 60 nm and the standard deviation to 1.8
according to measurements by Vogt et al. (2000). We in-vestigate two scenarios. First, we simulate a typical sum-mer situation with a geostrophic wind of 4.5 m s−1blowing from East. Second, we consider a winter day with a westerly flow with a geostrophic wind of 4 m s−1. Three consecu-tive days were simulated in each case where the first day is used as spin-up and we only consider the results of the sec-ond and the third day. Considering further details about the initialisation and boundary conditions we refer to Riemer et al. (2003b).
1888 N. Riemer et al.: Soot aging time scales in polluted regions 0.0 0.5 1.0 1.5 2.0 2.5 zi nk m 0 50 100 150 200 x in km 0 0.02 0.04 0.06 0.08 0.1 0.12 0.14 µg m-3
Fig. 3. Vertical cross section of the externally mixed soot concen-tration for the summer case at y=80 km, 12:00 CET, day 2.
3 Calculation of the turnover rate
In the following we will explain the approach we use to de-termine the turnover rate of the externally mixed soot and how a turnover rate for a domain comparable to the grid size of a global climate model can be calculated. In MADEsoot the temporal development of the mass density ms of the ex-ternally mixed soot is determined by the following equation:
∂ms(x, t)
∂t =
A(x, t) + S(x, t) + D(x, t) + E(x, t) − T (x, t) (1)
A, S, D, and E describe the rate of change due to advection, sedimentation, turbulent diffusion, and the emission, respec-tively. The bar indicates that the operators A, S, D and E are applied to the Reynolds-averaged quantities representing a typical spatial and temporal scale. T is the turnover rate of the externally mixed soot and the sum of two processes:
T (x, t) = Ca(x, t) + Cn(x, t) (2)
Cadescribes the transfer due to the coagulation of the ex-ternally mixed soot particles with soot containing inex-ternally mixed particles or soot free internally mixed particles. Cn describes the transfer due to condensation of sulphuric acid and organic compounds. The externally mixed soot particles are transferred into internally mixed soot if the soluble mass fraction of mode s rises above the threshold value ε=5%. In our mesoscale model system KAMM/DRAIS both pro-cesses are explicitly determined as described in Riemer et al. (2003b).
Typical applications of the model simulations of KAMM/DRAIS cover areas of about 250×250 km2. This equals more or less the typical grid size of a global cli-mate model. In the ideal case averaging a variable over the
0.0 0.5 1.0 1.5 2.0 2.5 zi nk m 0 50 100 150 200 x in km 0.1 0.2 0.3 0.4 0.5 0.6 0.7 0.8 µg m-3
Fig. 4. Same as Fig. 3, but for internally mixed soot.
mesoscale domain A should give the variable of the global climate model (assigned by a tilde).
˜
a(z, t ) = 1 A
Z Z
a(x, y, z, t )dA0. (3) In the global climate model the equivalent equation to Eq. (1) would read as:
∂ ˜ms(x, t)
∂t = ˜
A(x, t) + ˜S(x, t) + ˜D(x, t) + ˜E(x, t) − ˜k(z, t) · ˜ms(x, t). (4) Here the transfer from the external to the internal mode is already parameterised as a first order reaction since in global climate models the aerosol processes usually cannot be treated as detailed as it is done in regional scale model. The problem is now reduced to the parameterisation of the rate coefficient ˜k. Following the ideas explained so far ˜k can be derived from results of the mesoscale simulations. This means: ˜ k(z, t ) = R R A t +1t /2 R t −1t /2 T (x, y, z, t0)dt0dA0 R R A t +1t /2 R t −1t /2 ms(x, y, z, t0)dt0dA0 . (5)
with 1t =1 h. This time interval was chosen as it is compara-ble to the time steps that are used in global climate models. In this way we determine time-dependent vertical profiles of
˜
k. The time scale that represents the exponential time scale for the decay of externally mixed soot is given by
τ (z, t ) = 1 ˜
k(z, t ). (6)
4 Results
Figures 1 and 2 show the horizontal distributions of the soot concentration in external and internal mixtures at 20 m above
0 2 4 6 8 10 12 mass density in µ g m -3 SO42- NH4+ NO3- Soot H2O Org. winter summer
Fig. 5. Composition of the total aerosol concentration averaged over the model domain at 12:00 CET at 25 m above the surface.
the surface at 12:00 CET (day 2) for the summer and the win-ter episode. The distributions of the soot in exwin-ternal mixture reflect the distribution of the sources, i.e. the main motor-ways and urban centres in the model domain. In the plumes of the urban areas and at some distance from the sources, soot is internally mixed. Comparing the winter and summer results we find that the total soot concentrations reach signif-icantly higher values in winter due to the shallower boundary layer and the reduced vertical mixing in winter.
Figures 3 and 4 show the vertical cross sections of the soot concentration at y=80 km for the summer case. In the ele-vated layers soot exists mainly internally mixed. The val-ues for the total soot concentrations range between 0.1 and 2 µg m−3 near the surface at 12:00 CET (day 2). However, higher concentrations (up to 10 µg m−3) are reached in the morning hours. Figure 5 displays an overview of the com-position of the aerosol phase for the summer and the winter case. Shown is the aerosol concentration summed over all modes and averaged over the whole model domain for 12:00 CET (day 2) and 25 m above the surface.
During summer, the averaged sulphate concentration reaches a value of 6 µg m−3. Due to temperatures around 27◦C the nitrate concentration is low during the afternoon reaching only 0.3 µg m−3.
During winter the sulphate concentration is much lower and reaches only 0.7 µg m−3 since the production via
ho-mogeneous oxidation of SO2 in the gas phase through
re-action with OH is less efficient. We do not consider cloud processes; hence the effect of the heterogeneous reaction of SO2in aqueous solution with ozone and/or peroxides is not
included. Nitrate is much more abundant during the winter and reaches a value of 11.5 µg m−3. The order of magni-tude of our model results for the aerosol composition are in agreement with measurements for continental Europe as the
0.0 0.5 1.0 1.5 zi nk m 0 6 12 18 24 t in h 0 4 8 12 16 20 24 28 32 36 40 0.0 0.5 1.0 1.5 zi nk m 0 6 12 18 24 t in h 0 4 8 12 16 20 24 28 32 36 40
Fig. 6. Vertical profiles for the aging time scale for summer (top) and winter (bottom) at day 2.
comparison with measurements shows (e.g. Neus¨uss et al., 2002; Zappoli et al., 1999; Mehlmann and Warneck, 1995). On the basis of the simulation results for both episodes we derive the aging time scale as described in Sect. 3. As ex-plained there, τ may depend on height and time. Figure 6 shows time height sections of τ for the summer and winter episode, respectively. In both cases τ is below 2 h during the day and above 250 m above the surface. During the same time interval and below this height τ varies between 1 hour during the morning and up to about 20 h in the afternoon. During night time τ is much larger than during the day at all heights and there is a strong increase of τ from midnight of day 2 to midnight of day 3 in the summer and the win-ter case. While τ is almost constant with height during the night in the summer case it decreases with height in the win-ter case. Considering the temporal and spatial variations of τ in Fig. 6, it becomes obvious that the parameterisation of the aging process of soot using a fixed turnover rate represents an oversimplification.
1890 N. Riemer et al.: Soot aging time scales in polluted regions Winter Summer 0 10 20 30 40 50 60 τ in h 0 6 12 18 24 t in h 25 m 1100 m 250 m 0 10 20 30 40 50 60 τ in h 0 6 12 18 24 t in h 25 m 1100 m 250 m
Fig. 7. Daily cycles of the aging time scale (day 2).
Figure 7 (top) displays the daily cycle of τ in three differ-ent heights within the boundary layer for the summer episode (day 2) in more detail. At the heights of 250 m and 1100 m, we can clearly distinguish between the daytime and the night time regime. During daytime at these heights, τ is very short (∼1 h). From detailed process studies based on our model results we find that condensation of sulphuric acid is very ef-ficient in transferring externally mixed soot into the internal mixture when sulphuric acid is abundant. During the night, the production of sulphuric acid ceases. Once the avail-able sulphuric acid has been depleted by condensation on the existing particles, condensation of sulphuric acid there-fore stops to occur. Under these conditions coagulation is the only process for the transfer into internal mixture, oper-ating very slowly. This leads to much higher values for τ during the night compared to the day.
0.0 0.5 1.0 1.5 2.0 2.5 3.0 mass de nsity in g m µ -3 SO42- NH4+ NO3- Soot H O2 Org. winter summer
Fig. 8. Composition of the internally mixed soot particles averaged over the model domain at 12:00 CET at 25 m above the surface.
At the height of 25 m, which is identical with the source height used for our simulations, the distinction between day and night is not as apparent and τ remains at a relatively high level of about 20 h in the afternoon. The reason is that at this height, fresh soot is permanently emitted and the concentra-tion of externally mixed soot reaches its maximum. Given a certain amount of condensable species, it takes a longer time until the shell mass has grown to the certain threshold that marks the transition between externally and internally mixed soot which eventually results in the high values for τ .
At all heights a characteristic trend of the time scale is ob-vious. This trend can be attributed to the fact that the coag-ulation rate depends on the particles number densities. The particle number densities of the mode s are largely domi-nated by the emissions. However, the number densities of the modes if, jf, icand jcare decreasing with time in our simu-lation, because nucleation on the third day is weaker than on the second day due to the meteorological conditions. Con-sequently, since these are the particles that provide the coag-ulation partner for the externally mixed soot for the transfer into the internal mixture, the time scale increases. Similar arguments apply to the winter episode as displayed in Fig. 7 (bottom). Compared to the summer conditions, however, im-portant differences concern the following issues: Obviously, the daytime is shorter, solar radiation less intense and tem-peratures are significantly lower. This causes a shallower boundary layer and decelerated photochemistry, in particu-lar a lower production rate of H2SO4. However, the lower
temperatures favour the formation of ammonium nitrate. It turns out that ammonium nitrate contributes significantly to the aging of soot in winter during daytime and hence com-pensates the lack of H2SO4leading to time scales during the
day that are comparable to the summer case. To underline these findings Fig. 8 shows the average mass densities of
0.0 0.5 1.0 1.5 z in km 24 30 36 42 48 t in h 0.0001 0.0005 0.001 0.005 0.01 0.05 0.1 0.5 g m µ -3
Fig. 9. Time height section of the mass transfer rate of pure soot from the external to the internal mixture by condensation only aver-aged over the whole model domain and integrated for a time interval of one hour.
the individual species for the internally mixed soot aerosol (modes icand jc) at 12:00 CET (day 2) at 25 m above the sur-face. While the soluble mass fraction of these aerosol parti-cles is clearly dominated by sulphate for the summer case ni-trate represents the main contribution for the winter case. Of course the formation of ammonium nitrate also occurs dur-ing the night when the gas phase precursor HNO3is formed
due to the heterogeneous hydrolysis of N2O5(Riemer et al.,
2003a). However, since the formation and hence the conden-sation of H2SO4 ceases during the night due to the lack of
sunlight, the soot particles that are emitted during the night cannot be coated with sulphate. Since in our current model formulation the total amount of nitrate is distributed over the modes according to the sulphate content the available nitrate ends up in the modes if, jf, ic and jc and not in mode s. This means that the aging of soot due to condensation is not effective during the night, both in winter and in summer. Fig-ure 9 which displays a time height section of the soot transfer due to condensation (winter case only) shows this fact.
We are aware of the fact that this treatment of aerosol chemistry represents a limitation of our model. With this as-sumption it is not possible to form ammonium nitrate on the soot particles without sulphate being involved. In reality this process might occur which means that we might overestimate the time scale for the situations where ammonium nitrate is present. This issue will be addressed in future work.
The pronounced minimum for the time scale in 25 m (Fig. 7, bottom) can be attributed to the interaction of two processes that act in the opposite direction: First, the con-densation of sulphate and the formation of ammonium ni-trate sets in, which leads to a decrease in τ . Concurrently, the surface area of the particles in the modes if, jf, ic and
jcincreases compared to the surface of the particles in mode
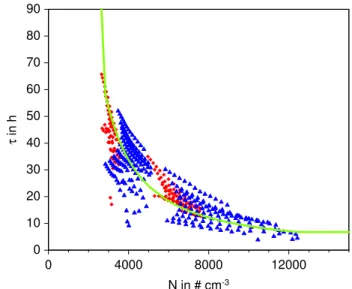
s. Therefore the low value of τ cannot be sustained and in-creases again. 0 10 20 30 40 50 60 70 80 90 τ in h 0 4000 8000 12000 N in # cm-3
Fig. 10. Correlation of τ and the number density of the internally mixed particles. The solid line shows the fit according to Eq. (7). The blue dots indicate the results for the winter day, the red ones those for the summer day.
Summarizing our findings we can state the following: Our model results suggest to distinguish between two regimes, a daytime and a night time regime. During daytime, condensation of sulphate and nitrate is the dominant process, and an additional separation according to the height above the source region appears to be appropriate. Above 250 m
τ is approximately 2 h, regardless of the season. In order to derive the time scale during daytime and below 250 m we ap-ply the following procedure. The time scales shown in Fig. 6 are averaged below 250 m and for the time interval where the global radiation is above zero. We find an average time scale of 9.38 h for the summer case and 6.89 h for the winter case. For the night time coagulation has been found to be the governing process. Compared to the day time results the time scales during the night show a much higher variability with height and especially with time, with a clear increase from night to night. Apart from other parameters such as the mean diameters, the coagulation coefficients, the temperature co-agulation depends on the number densities of the internally mixed particles. Therefore Fig. 10 shows the simulated val-ues of τ versus the number density of the internally mixed particles for the summer days and the winter days. All grid points are shown for heights below 1100 m above the surface during night time. As expected a decrease of τ with increas-ing number density is obvious. For these data we calculate the following fit, the result of which is depicted in Fig. 10:
τ = a N +
b
N2 (7)
with a=6×10⁴h cm−3and b=3×10⁸h cm−6
N is the number density in the modes if, jf, icand jc in cm−3and the dimension of τ is h.
1892 N. Riemer et al.: Soot aging time scales in polluted regions
The limitations inherent to our case studies should be stated clearly:
We only include soot emissions from traffic. While they con-tribute a large fraction of the emissions in densely populated areas, more sources contribute to the total soot than diesel cars alone, especially in winter. However, we did not have emission data for these emission categories.
Cloud and wet deposition processes as well as cloud chem-istry are not included in the model. Again, this introduces uncertainties mainly for the winter simulation. It is impossi-ble to estimate the overall effect of clouds on the aging pro-cess due to the competing effects of sulphate production in the aqueous phase and the removal by wet deposition as has been shown by Koch et al. (2003).
Despite these limitations the discussion of our case studies reveals the important issues that the time scale of soot aging is highly variable with respect to time and height and that nitrate can play an important role for the aging process.
5 Conclusions
We performed three-dimensional model simulations with the coupled mesoscale-γ model KAMM/DRAIS to derive the time scale τ that characterizes the transfer of diesel soot from external into internal mixture. From the two case studies that we considered we are not able to derive a parameterisation that will hold for the global scale. However, the method that we presented to derive the aging time scales are generally ap-plicable and can be used as a tool in the future to improve the parameterisation for global models.
Generally, the aging time scales that we derived are smaller than most of the values that are currently used in global climate models and show a considerable variability in space and time. Hence, parameterising the aging process of soot with a fixed turnover rate represents an oversimplifi-cation.
During daytime in summer, condensation of sulphuric acid is the governing process for the aging of soot. In wintertime, the formation of ammonium nitrate gains in importance. To our knowledge the role of ammonium nitrate for the aging of soot has been highlighted for the first time. Overall, the time scales for daytime in summer and winter are compara-ble, about 2 h above 250 m and 8 h below during night time, condensation stops being the important process. Instead, co-agulation becomes more significant, acting very slowly. This leads to a time scale during night of 10–40 h.
Acknowledgements. We thank the reviewers for their helpful
comments that improved the original version of the paper.
Edited by: F. Dentener
References
Baltensperger, U., Streit, N., Weingartner, E., Nyeki, S., Pr´evˆot, A. S. H., Van Dingenen, R., Virkkula, A., Putaud, J.-P., Even, A., ten Brink, H., Blatter, A., Neftel, A., and G¨aggeler, H. W.: Urban and rural aerosol characterization of summer smog events during the PIPAPO field campaign in Milan, Italy, J. Geophys. Res., 107, 8193 doi:10.1029/2001JD001292, 2002.
Binkowski, F. S. and Shankar, U.: The regional particulate matter model, 1. Model description and preliminary results, J. Geophys. Res., 100, 26 191–26 209, 1995.
Br´emond, M.-P., Cachier, H., and Buat-M´enard, P.: Particulate car-bon in the Paris region atmosphere, Environ. Technol. Lett., 10, 339–346, 1989.
Cooke, W. F. and Wilson, J. N.: A global black carbon aerosol model, J. Geophys. Res., 101, 19 395–19 408, 1996.
Cooke, W. F., Liousse, C., Cachier, H., and Feichter, J.: Construc-tion of a 1 degrees×1 degrees fossil fuel emission data set for carbonaceous aerosol and implementation and radiative impact in the ECHAM4 model, J. Geophys. Res., 104, 22 137–22 162, 1999.
Corsmeier, U., Kalthoff, N., Vogel, B., Hammer, M.-U., Fiedler, F., Kottmeier, C., Volz-Thomas, A., Konrad, S., Glaser, K., Neininger, B., Lehning, M., Jaeschke, W., Memmesheimer, M., Rappengl¨uck, B., and Jakobi, G.: Ozone and PAN formation in-side and outin-side of the Berlin plume Process analysis and numer-ical process simulation, J. Atmos. Chem., 42, 289–322, 2002. Fiedler, F., Bischoff-Gauß, I., Kalthoff, N., and Adrian, G.:
Mod-eling of the transport and diffusion of a tracer in the Freiburg-Schauinsland area, J. Geophys. Res., 105, 1599–1610, 2000. Hammer, M.-U., Vogel, B., and Vogel, H.: Findings on
H2O2/HNO3 as an indicator of ozone sensitivity in
Baden-W¨urttemberg, Berlin-Brandenburg, and the Po valley based on numerical simulations, J. Geophys. Res., 107, 8190, doi:10.1029/2000JD000211, 2002.
Heintzenberg, J.: A processor-controlled multisample soot pho-tometer, Aerosol Sci. Technol., 8, 227–233, 1988.
Horvath, H.: Atmospheric light absorption – A review, Atmos. En-viron., 27, 293–317, 1993.
Jacobson, M. Z.: A physically based treatment of elemental carbon optics: Implications for global direct forcing of aerosols, Geo-phys. Res. Lett., 27, 217–220, 2000.
Jacobson, M. Z.: Control of fossil-fuel particulate black car-bon and organic matter, possibly the most effective method of slowing global warming, J. Geophys. Res., 107, 4410, doi:10.1029/2001JD001376, 2002.
Kim, Y. P., Seinfeld, J. H., and Saxena, P.: Atmospheric gas-aerosol equilibrium I. Thermodynamic model, Aerosol Sci. Technol., 19, 157–181, 1993.
Koch, D.: Transport and direct radiative forcing of carbonaceous and sulfate aerosols in the GISS GCM, J. Geophys. Res., 106, 20 311–20 332, 2001.
Koch, D., Park, J., and Del Genio, A.: Clouds and sulfate are an-ticorrelated: A new diagnostic for global sulfur models, J. Geo-phys. Res., 108, 4781, doi:10.1029/2003JD003621, 2003. Lamb, B., Guenther, A., Gay, D., and Westberg, H.: A national
inventory of biogenic hydrocarbon emissions, Atmos. Environ., 21, 1695–1705, 1987.
Lesins, G., Chylek, P., and Lohmann, U.: A study of internal and external mixing scenarios and its effect on aerosol optic prop-erties and direct radiative forcing, J. Geophys. Res., 107, 4094, doi:10.1029/2001JD000973, 2002.
Liousse, C., Penner, J. E., Chuang, C., Walton, J. J., Eddleman, H., and Cachier, H.: A global three-dimensional model study of carbonaceous aerosols, J. Geophys. Res., 101, 19 411–19 432, 1996.
Lohmann, U., Feichter, J., Penner, J., and Leaitch, R.: Indirect ef-fect of sulfate and carbonaceous aerosols: A mechanistic treat-ment, J. Geophys. Res., 105, 12 193–12 206, 2000.
Ludwig, J., Meixner, F. X., Vogel, B., and F¨orstner, J.: Soil-air ex-change of nitric oxide: An overview of processes, environmental factors, and modeling studies, Biogeochemistry, 52, 225–258, 2001.
Mehlmann, A. and Warneck, P.: Atmospheric gaseous HNO3,
par-ticulate nitrate, and aerosol size distributions of major ionic species at a rural site in Western Germany, Atmos. Environ., 29, 2359–2373, 1995.
McKeen, S.A., Hsie, E.-Y., and Liu, S.C.: A study of the depen-dence of rural ozone on ozone precursors in the eastern United States, J. Geophys. Res., 96, 15 377–15 394, 1991.
Myhre, G., Stordal, F., Restad, K., and Isaksen I.S.A.: Estimation of the direct radiative forcing due to sulfate and soot aerosol, Tellus, 50B, 463–477, 1998.
Nester, K., Panitz, H.-J., and Fiedler, F.: Comparison of the DRAIS and EURAD model simulations of air pollution in a mesoscale area, Meteorol. Atmos. Phys., 57, 135–158, 1995.
Nenes, A., Conant, W.C., and Seinfeld, J.H.: Black carbon radiative heating effects on cloud microphysics and implications for the aerosol indirect effect – 2. Cloud microphysics, J. Geophys. Res., 107, 4605, doi:10.1029/2002JD002101, 2002.
Neus¨uss, C., Wex, H., Birmili, W., Wiedensohler, A., Koziar, C., Busch, B., Br¨uggemann, E., Gnauck, T., Ebert, M. and Covert, D.S.: Characterization and parameterization of atmospheric par-ticle number-, mass-. and chemical-size distributions in central Europe during LACE 98 and MINT, J. Geophys. Res., 107, 8127, doi:10.1029/1001JD000514, 2002.
Obermeier, A., Friedrich, R., John, C., Seier, J., Vogel, H., Fiedler, F., and Vogel, B.: Photosmog: M¨oglichkeiten und Strategien zur Verminderung des bodennahen Ozons, Umweltforschung in Baden-W¨urttemberg, ecomed Verlagsgesellschaft, Landsberg, 1995.
Okada, K. and Hitzenberger, R. M.: Mixing properties of individual submicrometer aerosol particles in Vienna, Atmos. Environ., 35, 5617–5628, 2001.
Pope, A. and Dockery, D.: Epidemiology of chronic health effects: Cross-sectional studies, in: Particles in Our Air: Concentrations and Health Effects, edited by: Wilson, R. and Sprengler, J., Cam-bridge, MA, Havard University Press, 149–168, 1996.
Pregger, T., Friedrich, R., Obermeier, A., Wickert, B., Blank, P., Theloke, J., Vogel, H., Riemer, N., Vogel, B., and Fiedler, F., En-twicklung von Instrumenten zur Analyse der Umweltbelastungen durch Feinst¨aube und andere ausgew¨ahlte Luftverunreinigungen in Baden-W¨urttemberg, http://bwplus.fzk.de, 1999.
Riemer, N., Vogel, H., Vogel, B., Schell, B., Ackermann, I., Kessler, Ch., and Hass, H.: The impact of the heterogeneous hydrolysis of N2O5on tropospheric chemistry and nitrate aerosol formation, J. Geophys. Res., 108, 4144, doi: 10.1029/2002JD002436, 2003a. Riemer, N., Vogel H., Vogel, B., and Fiedler, F.:
Model-ing aerosols on the mesoscale-γ : Treatment of soot aerosol and its radiative effects, J. Geophys. Res., 109, 4601, doi: 10.1029/2003JD003448, 2003b.
Saathoff, H., Naumann, K.-H., Riemer, N., Kamm S., M¨ohler O., Schurath U., Vogel, H., and Vogel, B.: The loss of NO2, HNO3, NO3/N2O5, HO2/HOONO2on soot aerosol: A chamber and
modeling study, Geophys. Res. Lett., 28, 1957–1960, 2001. Saathoff, H., Naumann, K.H., Schnaiter, M., Sch¨ock, W., M¨ohler,
O., Schurath, U., Weingartner, E., Gysel, M., and Baltensperger, U.: Coating of soot and (NH4)2SO4 particles by
ozonol-ysis products of α-pinene, J. Aerosol Sci., 34, 1297–1321, doi:10.1016/S0021-8502(03)00364-1, 2003.
Schell, B., Ackermann I. J., Binkowski, F. S., and Ebel, A.: Model-ing the formation of secondary organic aerosol within a compre-hensive air quality model system, J. Geophys. Res., 106, 28 275– 28 293, 2001.
Seier, J., Berner, P., Friedrich, R., John, C., and Obermeier, A.: Generation of an emission data base for TRACT, in: Exchange and Transport of Air Pollutants over Complex Terrain and the Sea, edited by: Larsen, S., Fiedler, F., and Borell, P., Springer Verlag, Berlin, Heidelberg, 269–278, 2000.
Tsigaridis, K. and Kanakidou, M.: Global modeling of secondary organic aerosol in the troposphere: A sensitivity analysis, Atmos. Chem. Phys., 3, 1849–1869, 2003,
SRef-ID: 1680-7324/acp/2003-3-1849.
Vogel, B., Fiedler, F., and Vogel, H.: Influence of topography and biogenic volatile organic compounds emission in the state of Baden-W¨urttemberg on ozone concentrations during episodes of high air temperatures, J. Geophys. Res., 100, 22 907–22 928, 1995.
Vogt, R., Scheer, V., and Rehbein, C.: Measurement of exhaust par-ticles: A comparison of the Emission lab and atmosphere, Con-tribution at IAA Technical Congress, Frankfurt, 2000.
Weingartner, E., Burtscher, H., and Baltensperger, H.: Hygroscopic properties of carbon and diesel soot particles, Atmos. Environ., 31, 2311–2327, 1997.
Whitby, E. R., McMurray, P. H., Shankar, U., and Binkowski, F. S.: Modal Aerosol Dynamics Modeling, Atmos. Res. and Ex-posure Assess. Lab. U.S. Environ. Prot. Agency, 600/3-91/020, (NTIS PB91-161729/AS Natl. Tech. Inf. Serv. Springfield, Va.), Research Triangle Park, N.C, 1991.
Wickert, B., Schwarz, U., Blank, P., John, C., K¨uhlwein, J., Ober-meier, A., and Friedrich, R.: Generation of an emission data base for Europe 1994, in Proceedings of EUROTRAC Sympo-sium’98, Vol. 2, edited by: Borrell, P. M. and Borrell, P., WIT-Press, Boston, Southampton, 255–260, 1999.
Wilson, J., Cuvelier, C., and Raes, F.: A modeling study of global mixed aerosol fields, J. Geophys. Res., 106, 34 081–34 108, 2001.
Zappoli, S., Andracchio, A., Fuzzi, S., et al.: Inorganic, organic and macromolecular components of fine aerosol in different areas of Europe in relation to their water solubility, Atmos. Environ., 33, 2733–2743, 1999.