HAL Id: insu-00442625
https://hal-insu.archives-ouvertes.fr/insu-00442625
Submitted on 10 Apr 2012HAL is a multi-disciplinary open access archive for the deposit and dissemination of sci-entific research documents, whether they are pub-lished or not. The documents may come from teaching and research institutions in France or abroad, or from public or private research centers.
L’archive ouverte pluridisciplinaire HAL, est destinée au dépôt et à la diffusion de documents scientifiques de niveau recherche, publiés ou non, émanant des établissements d’enseignement et de recherche français ou étrangers, des laboratoires publics ou privés.
From sedimentary records to sediment budgets:
Multiple approaches to catchment sediment flux
Anthony G. Brown, Christopher Carey, Gilles Erkens, Markus Fuchs, Thomas
Hoffmann, Jean-Jacques Macaire, Kaus-Martin Moldenhauer, Des E. Walling
To cite this version:
Anthony G. Brown, Christopher Carey, Gilles Erkens, Markus Fuchs, Thomas Hoffmann, et al.. From sedimentary records to sediment budgets: Multiple approaches to catchment sediment flux. Geomor-phology, Elsevier, 2009, 108 (1-2), pp.35-47. �10.1016/j.geomorph.2008.01.021�. �insu-00442625�
From sedimentary records to sediment budgets: Multiple
approaches to catchment sediment flux
Anthony G. Browna Christopher Careyb Gilles Erkensc Markus Fuchsd Thomas Hoffmanne Jean-Jacques Macairef Klaus-Martin Moldenhauerg Des E. Wallingb a
School of Geography, University of Southampton, Highfield, Southampton SO17 1BJ, UK
b
School of Geography, Archaeology and Earth Resources, University of Exeter, Amory Boulevard, Rennes Drive, Exeter EX4 4RJ UK
c
Department of Physical Geography, Faculty of Geosciences, Utrecht University, P.O. Box 80.115, 3508 TC Utrecht, The Netherlands
d
LS Geomorphologie, University of Bayreuth, 95440 Bayreuth, Germany
e
Department of Geography, University of Bonn, Meckenheimer Allee 166, 53130 Bonn, Germany
f
Université François Rabelais de Tours, UPRES-EA 2100, Laboratoire de Géologie des Environnements Aquatiques Continentaux, Faculté des Sciences et Techniques, Parc de Grandmont, 37200 Tours, France
g
Department of Physical Geography, Goethe-University Frankfurt a.M., 60438 Frankfurt a.M., Germany
Abstract
This paper reviews the traditional approach to sediment budget studies in geomorphology, new approaches and more specifically the potential impact of new methodological advances. Each component of the budget is discussed including the spatial and volumetric estimations of erosion, deposition and storage and the precision and accuracy of flux rate estimation.
Examples are used from recent work in Germany, The Netherlands and the UK and include the pedogenic approach to erosion estimation, remote sensing (LiDAR), geophysics and sediment-based dating techniques for flux rate estimation. The precision and accuracy of
catchment sediment flux estimates based upon sediment storage is not only dependant upon volumetric accuracy but also on the precision and accuracy of sediment dating. In this area there has been a revolution with direct sediment dating techniques (TL, OSL, ESR) freeing budget studies from the constraints and biases of radiocarbon. Of particular importance is the use of cosmogenic nuclides for dating but which can also be used to derive long-term erosion rates but only using a steady state assumption. Finally a tentative initial application of the sediment budget approach to Pleistocene terrace staircase in unglaciated basins is discussed. It is argued that only now do we have the techniques available to be able to produce accurate sediment budget estimations at spatial scales greater than that of zero order basins and over time periods greater than that covered by direct observations.
Keywords : Sediment budget; Sedimentary records; Sediment dating; Alluviation;
Colluviation; Fluvial terraces
1. Introduction
A sediment budget is in theory a relatively simple application of the continuity equation (Dietrich and Perron, 2006), indeed it can be conceived of as a form of geomorphic accountancy where the conservation of mass is given by:
∂z/∂t=U−E−∇.qs
and where z is the ground surface elevation, t is time, U is the uplift rate, E is erosion rate and qs is
the volume flux of sediment and soil (used here to refer to sediment altered by some degree of pedogenesis). In the case of short periods of time the uplift rate can be ignored so reducing (1) to: ∂z/∂t=E−∇.qs
Assuming that all the operational transfers in the catchment have been recognised then the value of such budgets is entirely dependant upon the mass estimation and the temporal precision and accuracy. Accurately estimating masses of sediment or soil in storage is not a trivial problem let alone the estimation of negative mass i.e. eroded soil. There is an inevitable tension between scale and the precision and accuracy of estimation, due to economic
constraints and time. Whilst it is possible to estimate the colluvial depth of soil to within 10% or even better in a small, zero or first order catchment (1–10 km2), this is unlikely to be a representative area and cannot easily be generalised up to the 10–100 km2 catchment scale. This estimation problem stems partially from the additive nature of the error through a number of budgets units, which generally increases with catchment size, and through the propagation of errors of mass and time, when calculating sediment fluxes. However, it is the quantification of these terms that is the basis of converting sedimentary records into
sedimentary budgets.
Although the basic principles of budgeting sediments are firmly established and widely used, the potential of using sediment budgets to better understand catchment fluxes has increased as a result of newly developed techniques and further evolved insights. The traditional approach (discussed in Section 2), based on field data, has limited applicability potential, as it is time and money consuming to gather enough accurate data. In addition, direct dating of sediments has been problematic until recently. Several decades of applying this traditional approach to
estimate sediment volumes and fluxes amplified the problems of budgeting sediments in palaeo-environments, such as establishing hillslope-channel connectivity and estimating sediment residence time. Lately, new approaches complementary to the traditional approach were developed, facilitated by recent technical advances in data acquisition, data storage and sediment dating. In this paper, examples of recent work in sediment budgeting are presented, using both new techniques within a traditional approach as well as completely new
approaches to sediment budgeting. Section 2 of this paper discusses several parts of the traditional sediment budget study and the latest advance herein. Recent technical advances allow for more direct measurement of the extent and volume of sediment bodies, this is exemplified by case studies using laser altimetry measurements (Section 3.2), better GIS applications (Section 4) and sub-surface remote sensing (Section 3.3). Just as important a contribution is the continuously evolving range of available dating techniques (Section 4), which enables the construction of a chronostratigraphy for sediment budgets. Lastly, the possibilities and limitations of recent and future developments in dating techniques (4.1, 4.2 and 4.3) and sediment budget approaches (4.4 and 4.5) are discussed.
2. Traditional approaches
Traditional approaches are based on sediment-store or soil observation and sampling using drilling and the correlation of sedimentary units by inspection in order to construct a stratigraphic model in 2D or 3D. An appropriate approach to this problem was the use of computers in the correlation of boreholes and the creation of 3D volumetric models
particularly for the petroleum exploration industry (Hanley and Merriam, 1986). However, whilst these systems work well at the geological scale of sedimentary basins they are much more difficult to apply to superficial data due to the greater lateral variability and the finer spatial resolution required. One approach has been to use an extremely high density of cores or boreholes, an excellent example of which is the sedimentary models of the Rhine–Meuse delta by Berendsen and Stouthamer (2001). At the opposite end of the spatial spectrum high density augering and the excavation of trenches can be part of ‘four-dimensional landscape analysis’ (Reiß et al., 2006) which could include budget estimation. However, high density augering and coring is extremely time consuming and expensive and is rarely possible for short research projects. There are a number of computer programs now routinely used for the correlation and visualization of such data, the most commonly used of which is probably RockWorks (RockWare™, USA). Early attempts were made in the 1980s to use remote sensing but these were only extensions of standard photogeology (Drury, 1987) and it is only recently that a suite of remote sensing techniques have become available which are beginning to allow us to tackle this problem.
Sedimentary archives enable sediment flux analysis in deep time, especially for the Holocene, which is necessary to evaluate the cumulative impact of human activities. Detailed analysis of sediments, although time consuming and expensive, is a fundamental and necessary approach to understanding the calculated sediment budget for a given period. Indeed, it provides not only useful data for the quantification of fluxes, but also reveals the composition and the origin (solid, dissolved, mineral, organic) of the sediment-forming material and thus the nature of the flux. It also details the sedimentation landscape dynamics which gives
information about the retention capacity of the basin, crucial for the budget evaluation. The interpretation of sedimentary archives for sediment budget evaluation raises classical questions (Meade et al., 1990), but some of them are often underestimated such as the calculation and interpretation of budgets.
2.1. Quantifying sediment storage and residence time
In order to calculate a budget it is necessary to quantify sediment storage and flux rate or residence time. Each catchment has particular characteristics which influence the proportion of the matter in transit stored in the form of sediments. These characteristics involve the area where the matter is generated on one hand, that has to be studied very carefully (lithology, topography, vegetation, etc.), but especially important is the area of sedimentation (geometry, hydrodynamics, preservation potential, etc.). For example, the same sedimentation basin (lake or floodplain) can store little sediment if the sediment yield is mainly composed of dissolved matter, and much sediment if the yield is mainly clastic. In addition; the quantity of stored matter (detrital or precipitated) in a lake of given geometry varies greatly according to the lithological characteristic of a dam (impermeable or permeable) which also influences the hydrology of the retention basin.
When starting to quantify storage in a retention basin, the composition of the sediment has to be studied first. A distinction between the detrital and the precipitated sediment phases is necessary in order to separate what is due to solid and dissolved fluxes respectively. Although this is sometimes difficult to establish, especially for carbonate sediments or for the clay-rich fraction, mineralogical, geochemical or microfacies analyses can give very useful
information. If organics are abundant, a study using suitable methods of organic petrography and geochemistry can enable the distinction between allochthonous (due to rock and soil erosion) or autochthonous (mainly peat) origin (Macaire et al., 2006).
A second step is to calculate as accurately as possible the quantity of stored sediment. In spatially limited sedimentation basins (lakes, flood plains), it is relatively easy to estimate the volume of stores from the geometry of the basin using classical or recently developed
methods of surveying, geophysics or remote sensing, but it is always necessary to check the data with coring, especially in basins containing a number of sediment facies. In more complex sedimentation basins (deltas, larger trunk valleys), using a well developed facies model is inevitable to budget masses of specific transported sediment (bedload, suspended load). Eventually, the bulk of sediment has to be expressed in mass, which requires
measurement of the volumetric mass of various sediment facies. Often, this varies by a factor > 10 between different facies, depending particularly upon the content of organic matter and the degree of burial and compaction.
Finally, the duration of storage has to be estimated from the age of the sediments. There are many dating methods, classical or more recently developed (see later section), but their use and reliability greatly depends on the sediment composition and origin: organic matter for the radiocarbon methods, quartz for the OSL, calcite for uranium-series disequilibrium dating and shells for amino acid racemisation dating. At present, reliably dating sediments is often the main limiting factor in the calculation of sediment budgets. An important question is that of diachronism between the dated period of sediment storage and the period of sediment yield: ideally the duration of matter transport within the catchment has to be evaluated (sediment residence time). A fully developed, temporally dissolved sediment budget has the possibility of estimating the residence time of sediment in sinks (lakes, floodplains) within a catchment.
2.2. Through-flow: sediment delivery ratio's and solid vs. dissolved sediment loads
It is pertinent to ask what the rates of sediment yield calculated for given periods from large sediment sinks actually means, since a given proportion of matter is delivered downstream
from the sedimentation basin. Within sediment budget studies, the sediment through-flow between (sub) catchments and/or sinks is therefore a very relevant component. It is, unfortunately, also one of the most difficult to calculate. The only possibility to address it directly is to calculate both erosion and deposition on a (sub)catchment-wide scale as accurately as possible (e.g. method followed by Houben, 2006). The difference between the two units is the through-flow. The relative amount of sediment through-flow is also called the sediment delivery ratio (SDR), which describes the proportion of sediment leaving an area, relative to the amount of sediment eroded in that area. The proportion of erosion-generated sediment that reaches the river is referred to as the hillslope SDR. In contrast, the proportion of sediment that reaches the outlet compared with the sediment delivered to the channel is referred to as the channel SDR (terminology following Asselman et al., 2003). This is crucial if sediment dating is accurate (decades for the Holocene) because material can be stored as colluvium on slopes for very variable periods of time. A fully developed sediment budget requires a calculation of the volume of colluvium or other slope sediments. This is a difficult exercise because of the scattered and the heterogeneous nature (spatial spread and depth) of these formations. Advances in the evaluation of these formations can be obtained from predictive models based on relations between these deposits and environmental parameters, especially morphology; but the problems are complex and very different depending on whether deposits are of natural origin or due to human activity. Recently this approach has been used by the British Geological Survey for the mapping of ‘head’ (solifluction) deposits. The notion of connection–disconnection between the slopes and the channel network
(hillslope SDR) is therefore very important.
Because the SDR is usually not known, the calculated sediment yields are always minimum estimates, possibly far from the real values. The estimated rates of solid yield which at present greatly dominates at global scale (80%–90%: Probst, 1992), are generally quite close to the real values if the analysed storage is a low energy sedimentation basin (lakes, flood plains) where not only the bed load, but also the suspended matter are efficiently trapped. Hoffmann et al. (2007) calculated a Holocene sediment budget for the entire Rhine catchment and estimated channel SDRs of large sinks from present-day measured channel SDRs. However, permanently flooded fens seem to be poor traps for suspended matter (Macaire et al., 2006).
The rates of dissolved yield, currently low at the global scale (10%–20%), can be very high in some catchments (carbonate catchments especially), but are generally not evaluated for past periods. Dissolved yield can be approached in two ways: (1) from the volume of precipitated matter in sedimentary stores ( [Arnaud et al., 2005] and [Fourmont, 2005]), (2) by comparison of mean chemical composition of sediments with the mean chemical composition of soil parent materials in the catchment (iso-element geochemical budget method: Gay and Macaire, 1999). The second approach can be applied if sediments are detrital in origin and directly weathered (first weathering cycle: Suttner et al., 1981), which is more frequently the case in small upstream catchments. The quasi dissolved yield can be evaluated using method (1) in endorheic basins or using method (2) above (e.g., Bréhéret et al., in press).
2.3. Using pedogenetic properties and soil profile truncation
The pedogenetic approach is based on the assumption, that in areas where the most important soil forming factors (e.g. parent material, terrain, climate, vegetation cover) varied relatively little during the Holocene, uniform soil properties prevailed over great distances constituting a so called soilscape, where related soil types show very similar horizonation (i.e. within a soil group) ( [Ganssen and Gracanin, 1972] and [Semmel, 1977]). Since soil horizons tend to
develop parallel to the surface and show relatively constant thickness values (Jenny, 1994) they serve as ideal markers for recent to sub-recent geomorphic processes. Erosion can easily be estimated from the amount of soil profile truncation (Fig. 1), whilst accumulation is indicated by colluvial deposits (colluvia in the sense of detached and redeposited material originating from soils). In the case where colluvium covers pristine soil with a complete succession of horizons only sedimentation occurred. If colluvium is deposited on a truncated soil, it can be stated that erosion as well as sedimentation took place at this specific point. Moreover, by applying pedological analyses it is often possible to distinguish different
colluvial beds which are indicative of a more complex history of erosional and/or depositional processes. The working steps for this approach are:
(i) The assessment of natural soilscape for the area of interest.
(ii)The determination of suitable soils within the catchment or adjacent to it.
(iii)Estimation of average thickness of horizons either by using soil maps or a field survey. (iv)The delineation of a typical soil profile as a reference.
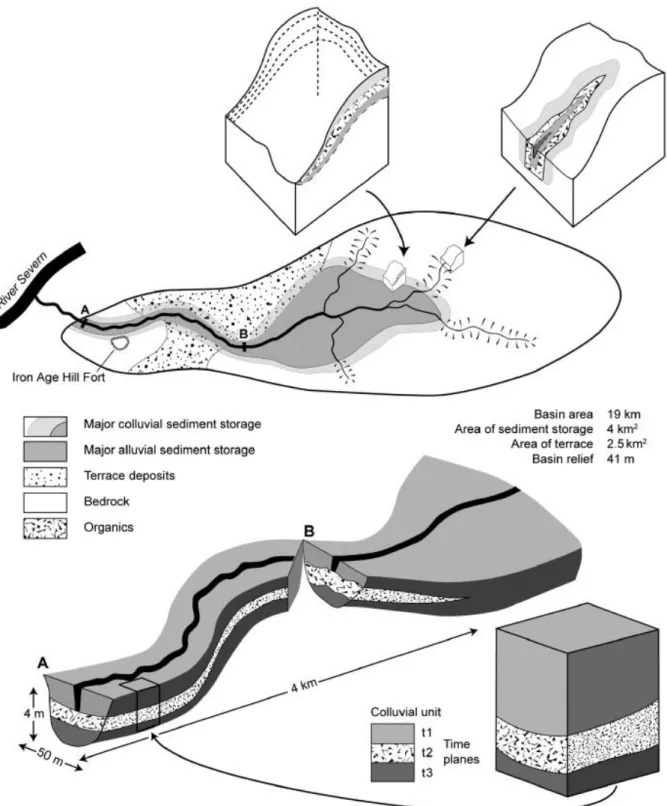
Fig. 1. A schematic diagram of a small sub-catchment with erosional and depositional zones and representations of gully truncation and colluvial and alluvial stores. Based upon a small catchment (Ripple Catchment) in the West Midlands of England.
Clear examples are given in Houben (2006) for Central European catchments characterized by Luvisols that developed in loess. The degree of truncation of the Luvisols was calculated spatially (combining soil profile descriptions in a GIS). Although it is not necessarily a precondition, this approach works best in areas where pedogenesis produced highly
differentiated soil profiles (e.g. Luvisols in loess, glacial till, glaciofluvial deposits or silt rich eolian sands). Here, detailed estimations of the extent of truncation are usually possible (Houben et al., 2006) but unlikely in basins dominated by very variable lithology and complex soil–landform relationships such as many granitic and limestone areas.
As outlined in Houben (2006), it is also possible to apply this approach to soils developed in solifluction cover beds. In this case the thickness of sedimentary successions serves as an indicator of postdepositional erosion. In particular the Main Solifluction Sheet (LH) is suitable for estimations because of its ubiquitous nature and constant thickness values of 0.4 to 0.6 m. This could be dated by incorporated remnants of Laacher Sea Tephra showing that the Main Solifluction Sheet (LH) accumulated during the Younger Dryas on nearly all slopes > 2° and it is thought to be the fossilised active layer of the Latest Pleistocene permafrost which is the reason for constant thickness ( [Semmel, 1964] and [Semmel, 1973]).
3. New approaches: advances in the acquisition of spatial and temporal data
Several recent technical advances have the potential to improve our estimation of the storage of sediment within catchments both in spatial, volumetric and temporal precision and
accuracy.
3.1. High-precision topographic measurements
Many studies have shown that the stratigraphy of floodplains is at least to some extent related to surface topography and micro-topography and geomorphometry ( [Evans,
1986] and [Carey et al., 2006]). The high horizontal and vertical precision of Light Detection and Ranging (LiDAR) system allows this relationship to be exploited. In a study of the sedimentary sequence of a confluence area of a floodplain in Central England Carey et al. (2006) have shown that the lateral and vertical units identified from the LiDAR reflect both the sub-surface stratigraphy and the depositional sequence of the floodplain (Fig. 2). The LiDAR survey was flown in February 2003 by Infoterra (www.infoterra-global.com) using an Optech 2033 ALTM with a 1047 nm laser, operating in the Near-Infrared (NIR) portion of the electromagnetic spectrum (Optech, 2003). In order to map the topography at a resolution sufficient for the identification of cultural and geomorphological features a 1 m survey posting was used. This created 1,000,000 data collection points/1 km2, creating a data set of 8,000,000 points over the survey area. The vertical resolution of LiDAR is estimated to be 10 cm to 15 cm, allowing high precision mapping of cultural (field boundaries, banks etc.) and geomorphological features. Post-survey processing of the simultaneously recorded laser, location and altitude data allows reconstruction of elevation values for the ground surface. Raw survey data in the form of a three dimensional point-cloud are projected to a local map datum, sorted, filtered and used to generate a regular grid of elevation values. The laser receiver is able to record multiple returns for a single pulse, recording a partial return from the top of a semi-opaque object such as a woodland canopy–the first pulse return (FP) and from the opaque ground beneath the canopy–the last pulse return (LP). Other information, such as the intensity (amplitude) was also recorded. Intensity data provide a record of the
backscattered intensity of reflection of each laser pulse. Backscattered intensity values vary according to changes in the reflectance of differing earth surface materials at NIR
wavelengths (Wehr and Lohr, 1999). These studies have also shown that not only is the last pulse return data valuable for generating the digital terrain model (DTM) but that the intensity of return can show features with no topographic expression, probably through surface
systems satellite mounted radar can be appropriate such as IFSAR. These techniques can also reveal cultural features which may be important in the delivery of soil down slopes and onto floodplains such as headlands, lynchets and ridge and furrow cultivation forms. The universal availability of GIS allows these data to be integrated with sub-surface modelling.
Fig. 2. LIDAR DTM of the Trent–Soar junction in the East Midlands UK.
The use and advantages of Digital Elevation Models in catchment flux studies is exemplified by recent work in The Netherlands. In 2004, the so-called AHN (Actueel Hoogtebestand Nederland) digital elevation model of the Netherlands based on laser-altimetry was released (Rijkswaterstaat-AGI, 2005). This remote sensing dataset has an undreamt of accuracy and resolution: 1 measurement/8 m2 on average for The Netherlands (of ground elevation, i.e.
after filtering to remove canopy reflections) and is commonly viewed as mean elevation for 5 × 5 m grid-cells calculated over an 8 × 8 m footprint (van Heerd et al., 2000). Using GIS, it can easily be combined with topographical maps, borehole databases, and other digital databases. The potential of this DEM already radically changed geomorphological and geological mapping in the traditional approach (e.g. Berendsen and Volleberg, 2007). Ideal location for boreholes can be determined much more efficiently, using the ability to map patterns in surface elevation in detail. Additional boreholes remain necessary to reconstruct the genesis and geological history. In other words, the new data source allows the mapping and correlating sediment bodies with greater accuracy and in a shorter period of time. Especially field-based sediment budget studies in larger catchments or the up-scaling of smaller scale sediment budgets can benefit from this. It also has large advantages for the (new) topographical approach where high resolution digital elevation models can be used in estimating sediment volumes by using voxels. A case study example of using a very primitive voxel approach is the Holocene sediment budget for the Rhine delta (Erkens et al., 2006).
The Rhine Delta in The Netherlands is a near-complete sediment trap for Rhine sediments during the last 9000 years (Erkens et al., 2006). These deposits form a deltaic wedge or prism. This is a volume of sediment enveloped by a lower and an upper bounding surface:
respectively, the Late-Pleistocene subsurface (the buried palaeovalley of the last glacial course of the Rhine) and the modern land surface (Cohen, 2005). To reconstruct sediment delivery into the delta as a part of a sediment budget study, the starting point was to calculate the total amount of sediment trapped within this prism. An extensive database of 200,000 borehole descriptions was assessed (Berendsen and Stouthamer, 2001) to create a digital elevation model (DEM) of the Late-Pleistocene surface (cell size 250 × 250 m) using all borings that reached the Holocene–Pleistocene interface. A second DEM with the same cell size was created for the modern surface by resampling the high-resolution DEM available from laser altimetry (Rijkswaterstaat-AGI, 2005). Calculating their difference yielded the thickness of the Holocene deposits for each cell, which after summation gave the total volume of the Holocene fluvial prism (Erkens et al., 2006). Calculation errors are considered to be in the order of 20%, caused by different delineations of the prism and differences in DEM resolution. This estimate is based on cross-checking volume estimates independently derived from different data sets (Erkens et al., 2006). The calculated volumes represent a net result of 9000 years of sedimentation. A long-term averaged yearly deposition rate can be derived by dividing the total amount by deposition time (assuming 100% trapping efficiency). As the total volume was broken down to depositional environments, a direct comparison with today's bed load and suspension load measurements is enabled. Suspension load of the last decades and Holocene-averaged estimates are within the same order of magnitude. This suggests that although this is a very gross method, DEMs provide the opportunity to calculate sediment volume over a large area with a relatively small error (Erkens et al., 2006).
Due to computing power and readily available software it is also possible to use DEM drapes to estimate volume in terms of voxels within channel and coastal systems. An example of this approach for in-channel sediments is the work done near Brashear Island, USA by the Oak Ridge National Laboratory which used regularized spline with tension and smoothing to interpolate the sub-bottom densities in 3 dimensions. This algorithm is a part of the GRASS GIS as s.surf.3d, a variant of s.surf.tps (http://research.esd.ornl.gov/CRERP/SEDIMENT/ BRASHEAR.HTM).
3.2. The use of GIS in catchment flux studies
When evolving from a classical sedimentary record study towards a more complex sediment budget study, it is very important to be able to integrate different types of data and to make both spatial as well as temporal analyses and correlations. GIS provides a tool to make this step; using two of its main advantages. Firstly, GIS is known for its spatial database function, archiving raw observational evidence and making it accessible. For some areas of study such as the Rhine–Meuse delta (Berendsen and Stouthamer, 2000) and the Mississippi delta (Kesel et al., 1992), extremely large data sets are now available that ask for a clear spatial database structure. In addition, many databases used for sediment budgeting studies are constructed from several smaller databases and/or even from databases with different types of data (borehole data, elevation data, etc.); GIS can be used here to integrate the data. In the near future, instead of data availability, data management may be the limiting factor. Secondly, GIS allows data and palaeogeographical reconstructions to be verified and improved
progressively. It provides in the ability to perform iterative editing during implementation of a palaeogeographical reconstruction ( [Berendsen et al., 2001], [Cohen, 2003], [Berendsen and Volleberg, 2007] and [Berendsen et al., 2007]). When the reconstruction is locally modified, e.g. by more accurate mapping, new relative dating insights, new absolute age evidence, GIS cannot only be used as a mapping tool but also as a manipulation and analysis tool for reconstruction past sedimentary environments and fluxes (Berendsen and Volleberg, 2007.
3.3. Sub-surface remote sensing
Several geophysical approaches have been taken for investigating the stratigraphy of alluvial floodplains. The earliest was shallow seismic survey which was used particularly in the 1970s–80s to investigate buried valleys in the coastal reaches of floodplains (e.g. Williams, 1968). For example, from these studies we know that almost all the valleys in SW England have buried valleys under their estuaries trending to base-levels between 30 and 120 m below the present sea level ( [Durrance, 1980] and [Lenham et al., in press]). It remains a powerful technique for the larger alluvial systems and is currently being used in the engineering prospection of large floodplains (Hayward and Goforth, 1997).
In the 1990s new geophysical techniques were explored, largely stimulated by their use in archaeological prospecting. The most common use was for soil related features (e.g.,
cropmarks), utilising techniques such as magnetometry and electrical resistance or its inverse, electrical conductivity ( [Clarke, 1990] and [Gaffney and Gater, 2003]). All geophysical techniques have their peculiarities in relation to natural variations in sediment composition, salt content and moisture variation (Linford, 2006). There is also normally a trade-off between resolution and depth of penetration. For the delimitation of alluvial units (budget stores) a penetration depth of 1–30 m is required which in most cases will intersect with the local groundwater table.
Probably the most geomorphologically useful geophysical technique has been the use of ground penetrating radar (GPR) generally operating at between 200 and 1000 MHz (Heinz and Aigner, 2003). This is particularly useful for mid-range depths (1–10 m) in coarse- to medium-grained substratum and where there are strong dielectrical variations in the subsurface. Boundaries between geomorphological units are seen as discontinuities, due to different sediment properties. The identification of radar terminations allows a relative chronology for a sequence of sediment units to be constructed (Bristow et al., 2005). Estimating the depth of discontinuities within floodplain sediments by GPR is complicated,
due to different dielectric constants found within different geomorphological units. Within an alluvial context the relative dielectric permittivity (RDP) of different sediment units is critical (the ability of sediment to absorb, reflect and be permeated by the radar pulse). To calibrate the electric depth model created by the GPR the dielectric properties of the soil profile needs to be accurately estimated. Within alluvial environments this is difficult as any GPR transect may cross a series of contrasting geomorphological units, each having a different RDP. The two most common methods of GPR depth calibration within geomorphological studies through comparison with gouge core data (Bridge et al., 1998) or through common mid point analysis through using multiple radar antennas (Bristow et al., 2005).
GPR data can be collected in two or three dimensional survey. A two dimensional survey is effectively a single transect of data shown as a depth section. Three dimensional surveys use multiple transects collected either in zig-zag or parallel traverses. Whilst three dimensional data surveys are more costly in terms of time of data collection they have the advantage of showing geomorphological features in plan view as well as in section. Such planar time sliced data can be readily imported into conventional GIS systems for display and further query. In a study on the floodplain of the River Trent in Central England (Carey et al., 2006), GPR survey was adequate for resolving the terrace sediment stratigraphies but was poor at resolving either the depth or internal stratigraphy of channels and backswamp areas. The presence of either significant clay deposits or high water tables caused rapid attenuation of the radar signal, drastically reducing its effective depth of penetration.
In order to overcome to the problem of limited GPR prospection within clay rich and water saturated environments, Electrical Resistivity Ground Imaging (ERGI) can be used. Electrical resistivity surveys determine the subsurface resistivity distribution by making measurements at the ground surface, allowing gross horizontal and vertical changes in subsurface sediment architecture to be seen. The definition of alluvial sediment units such as gravel and sand units are not defined as well as GPR, due to a lower level of data resolution. However, ERGI has the potential to penetrate to greater depths than GPR and can be used to investigate alluvial stratigraphies that have clay dominated matrices. ERGI sections in alluvial environments suffer from the problem of non-uniqueness, with different inversion methods producing different outputs from the same data sets. The inversion method used in Fig. 3 was a least squares inversion with a robust constraint, which attempts to minimise the square of difference between the observed and calculated apparent resistivity values. The robust constraint is less sensitive to noisy data and is suitable for analysing data sets that contain discrete geomorphological units with sharp boundaries, e.g. the change between a gravel terrace and clay filled palaeochannel. The ERGI section clearly identifies the palaeochannel and the terrace. The definition of the terrace stratigraphy is not clear and the gravel/alluvium interface is not definable. In contrast the GPR profile reveals no information about the sediment architecture of the palaeochannel, but the definition of the terrace alluvium and the edge of the terrace gravels is clear.
Fig. 3. Combined GPR and ER of transects within the floodplain of the Trent–Soar junction, East Midlands, UK.
There is a high potential for the application of combined ERGI and GPR in alluvial environments. Together they provide complementary data on sediment stratigraphies,
allowing more robust interpretations and will probably play an increasingly important role in the quantification of both alluvial and colluvial sediment stores. Key baseline data such as the depth of above gravel alluvium and depths of gravel bedrock interfaces can be readily defined using these techniques, as well as revealing subtlety in the sediment architecture of larger geomorphological units. Research is also underway on using these techniques in an even more remote manner. In particular it is theoretically feasible to use GPR from an airborne platform giving both a radar DTM and sub-surface information (Sen et al., 2003).
4. Chronostratigraphy of sediment flux: advances and ongoing challenges in sediment budgeting
Following Eq. (1), the quantitative investigation of sediment budgets presupposes an age determination of the stored sediments (colluvium, alluvium, soils) in order to determine ∂z/∂t. To achieve the temporal information, next to the direct observation and monitoring of the erosional process, the sediments have to be dated. Due to methodological and technical developments of the last few years, there are now several chronometric dating techniques available. The applicability of a certain dating technique to sediments depends on (i) the existence of suitable dating material, (ii) the age range and (iii) the precision and accuracy of the technique. Additionally, the question (iv) of which process and event can be dated with a certain dating technique also has to be considered (Wagner, 1998).
4.1. Radiocarbon dating
Due to a steady flux of cosmic rays, cosmogenic nuclides are formed within the Earth's atmosphere and surface. One of the most important atmospherically formed cosmogenic nuclides is 14C, which can be found in any organic material. As with other cosmogenic radionuclides the estimation of the production rate is critical. Fortunately from the matching of long tree-ring chronologies and most recently long varve sequences from Lake Suigetsu which is located near the coast of the Sea of Japan a calibration curve now exists back well beyond 10,000 BP ( [Kitagawa and von der Plicht, 1998] and [Kitagawa and von der Plicht, 2000]). Due to its establishment as a method over 40 years ago and its universal use there is a vast literature on it including recent developments of accelerator–mass spectrometry,
improved processing to remove contaminants (e.g. the A-box method—Higham et al., 2006) which have led to a dramatic reduction in the size of sample required (by a factor of 100) and extension of maximum reliable dating (but cf. Reimer et al., 2006). Radiocarbon can be used on different fluvial sediments in different ways—to give maximum ages for example from soils, to give activity such as fragile organic matter (e.g. a leaf) incorporated into a single-episode deposit or minimum ages such as a peat developed over a flood deposit ( [Brown, 1997], [Lewin et al., 2005] and [Chiverrell et al., 2008a]). When non-fragile organic matter, such as peat or wood, is incorporated into sediments, a maximum sedimentation age can be determined, due to the fact that an unknown time elapse developed between the formation of the organic matter and its incorporation into the sediment. This is a particular problem with colluvial sedimentation and can cause unavoidable uncertainty in the depositional time-frame but which can be resolved using frequency analyses (Lang, 2003). Soils also present
considerable problems due to the potentially long and variable residence-time of the different forms of C compounds in soils, which is related to the soil forming environment and which can change over time. Several alluvial studies have shown a systematic variation with the humin and humic fraction in alluvial sediments ( [Brown et al., 2005] and [Brown et al., 2007]). One approach to these problems in fluvial sequences has been to mass the dates and plot them as probability density functions (Johnstone et al., 2006; Panin et al., 2009-this issue)
after removal of the artefacts of calibration. This implicitly accepts that there is considerable noise in the system, is biased to sequences with high amounts of organic materials and since it is based upon correlation with other proxy series may suggest rather than imply causality.
4.2. Long-lived cosmogenic nuclides
In addition to 14C, the analysis of cosmogenic nuclides 10Be, 26Al and 36Cl became an important tool for calculating catchment based erosion rates. There are two principal approaches, surface exposure dating and concentration profiles. Surface exposure dating assumes that either there has been no erosion of the rock surface over the time period in question or that it can be reliably estimated. The concentration profile has to consider depth attenuation but in theory is itself a proxy of the localized sediment budget. However, in order to use these methods in catchment sediment budgeting several fundamental assumptions have to be made. In particular the assumption of a steady state erosion rate, referring to the
timescale of cosmogenic production in the parent rock material, is a potential drawback of the approach (Vance et al., 2003).
The use of longer-lived cosmogenic isotopes, particularly 10Be and 26Al for the estimation of medium–long term erosion rates is a relatively new methodology in research concerning the feedbacks between tectonics, erosion and climate ( [Bierman and Steig, 1996], [Granger et al., 1996], [Vance et al., 2003] and [von Blanckenburg, 2005]). The technique will be introduced only briefly here, more details are given in reviews by Gosse and Phillips (2001), Bierman and Nichols (2004) and by Cockburn and Summerfield (2004). Depending on the sampling strategy the measurement of cosmogenic nuclides allows the estimation of i) mean erosion rates of catchments from fluvial sediment, ii) hillslope erosion rates from bedrock outcrops or iii) bedrock exposure ages (if erosion rate is zero). However, using cosmogenic inventories of river sediments to estimate mean erosion rates of catchments all studies make the assumption that the erosion rate is at steady state for the timescale of cosmogenic production in
soil/bedrock, and sediment storage is minor/short in comparison to cosmogenic nuclide decay times.
In theory the surface nuclide concentration C of river sediments is inversely proportional to the erosion rate ε:
C=P0/(λ+ρɛ/Λ)
where λ is the decay constant of the nuclide, ρ the density of material and Λ the 1/e attenuation length (von Blanckenburg, 2005). The surface production rate P0 depends on the intensity of secondary
cosmic rays (nucleos and muons) and therefore is scaled for altitude, magnetic inclination and latitude (Eq. (3)). Because production rates are still not well constrained it is estimated that cosmogenic production decreases with depth with an exponential length scale of approximately 0.6 m. This includes some impreciseness and yet the effects of i) non steady state of erosion rates, ii) longterm sediment storage iii) landslides, iv) progressive concentration of quartz in soil through weathering and soil erosion and v) processes on grain size selection are rarely known. However, major advances to solve some of these uncertainties have been achieved by numerical modelling studies ( [Niemi et al., 2005], [Schaller and Ehlers, 2006] and [Reinhardt et al., 2007]). One of the most exciting future applications of terrestrial nuclides in combination with other dating evidence (e.g. optically stimulated luminescence (OSL) dating), is the estimation of palaeo-erosion histories as shown by Schaller et al. (2002) in the case of the Meuse river. New developments to measure cosmogenic nuclides in
needs to be tested in an integrated study of a medium sized catchment budget with independent dating controls.
4.3. Radiation dosimetry
The principle of this dating method is the time dependent accumulation of energy in minerals, primarily quartz and feldspar, resulting from omnipresent low level radiation from natural radioactivity and cosmic radiation. An excellent summary of the method with information on sampling methodology can be found in Duller (2008) but basically the resetting of the
accumulated energy is caused by heat or daylight, the latter of which is of crucial importance for the dating of sediments. Consequently, the last exposure of the mineral grains to daylight is determined, and thus the age of sediment deposition. Insufficient resetting of the
accumulated energy would result in an age overestimation. Currently, three different dosimetric dating techniques, thermoluminescence (TL), optically stimulated luminescence (OSL) and electron spin resonance (ESR) dating prevail. The basic difference between these methods is the way the accumulated energy is exploited and detected. Furthermore, their sensitivity to the resetting process by daylight is different. OSL shows the fastest bleaching characteristics by daylight, making this method the most important for dating fluvial
sediments (Jain et al., 2004) although there are problems. These include when some quartz is frequently not fully bleached or zeroed, feldspar contamination and dose-rate disequilibrium caused by high uranium levels. Even colluvial sediments with a short transport distance may successfully be dated by OSL (Fig. 4; Fuchs et al., 2004). In the case of TL, bleaching behaviour is less reliable, and even less reliable again for ESR. Nevertheless, recent developments in single quartz grain analysis allow the selective extraction of only well bleached grains (Beerten and Stesmans, 2005).
Fig. 4. OSL dating results from a colluvial profile in Greece (after Fuchs et al., 2004). OSL ages are plotted according to the depth of sampling. Additionally, sediment columns and Munsell color is plotted. Ages given in italics are interpreted as maximum ages due to insufficient bleaching.
Due to the advantages of direct sediment dating, luminescence plays an increasingly important role in sediment budget studies. Dating fluvial-transported sediments, optical stimulated luminescence (OSL) is the preferred technique, with faster bleaching
characteristics than thermoluminescence (TL). However, when dealing with fluvial sediments the total resetting of the former luminescence signal often does not occur, resulting in an age overestimation, which has a stronger impact on young samples than on older ones (Jain et al., 2004). To deal with the problem of insufficient bleaching, various approaches are being followed in ongoing research studies ( [Arnold et al., 2007] and [Fuchs et al., 2007]).
Depending on the fluvial process of sediment transportation, certain mineral grain sizes are prone to be better bleached than others. In a case study on recent river flood sediments from the Elbe River (Germany), Fuchs et al. (2005) showed that fine-grained quartz seems to be better bleached than fine-grained feldspar. The residual luminescence signal from fine-grain quartz resulted in an estimated residual age of ca. 0.1 ka, which would be problematic only for very young samples. Another approach is the reduction of the analyzed sample material to small aliquots or even single grains (e.g., [Fuchs and Wagner, 2005] and [Thomas et al., 2005]). Based on the assumption that insufficiently bleached samples consist of a mixture of well and incomplete bleached mineral grains, the measurement of several subsamples would result in a specific distribution. The part of the distribution with the lowest values represents
the subsamples with the best bleaching characteristics, thus supposed to be closest to the true deposition age (Olley et al., 1999). A very promising approach to dating insufficiently bleached samples is the analyses of specific OSL components, each with certain bleaching characteristics. Analyzing only the fast bleaching component, Singarayer et al. (2005) achieved promising results for insufficiently bleached samples from various environments, applying the linear modulation technique.
4.4. Uranium series
This series of dating methods comprises the radioactive decay series of the uranium isotopes 238
U and 235U (e.g. 230Th–234U) as based on the measurement of radiometric disequilibria. The event which can be dated with these dating methods is the closing of a geochemical system, which was previously disturbed by chemical fractionation. For sediment dating, uranium series can be applied to pedogenic carbonates of sediment bodies (Sharp et al., 2003).
However, the interpretation of these ages would result in minimum ages, due to the unknown time elapsed between the sediment formation and carbonate precipitation which can be at least as long as c. 40,000 years (Birkeland, 1974). Another challenging problem is the
polycyclic formation of pedogenic carbonates and the possible reopening of the system which may result in recrystallisation. Micro-sampling techniques may be used to solve this problem (Mallick and Frank, 2002).
4.5. Varve chronology and sediment budgets from lake sediments
Seasonal variation of environmental conditions (e.g., temperature, vegetation cover) result in annually laminated lake sediments. These layers show a characteristic succession of
sedimentary features such as variable laminae thickness, organic carbon content or grain size distribution. The varved sediments can be dated by counting, thus sediment yield from the catchment can be deduced with a potentially high or even annual resolution ( [Zolitschka, 1998] and [Slaymaker et al., 2003]). There are problems and frequently the chronology has to be left floating within a time-frame established by another method such as 14C. However, long chronologies such as that of Lake Suigetsu are now, as previously described, being used to provide improved radiocarbon chronologies ( [Kitagawa and von der Plicht,
1998] and [Kitagawa and von der Plicht, 2000]).
4.6. Short-lived fallout radionuclides
Recent advances in the use of the short-lived fallout radionuclides 137Cs, excess 210Pb and 7Be in contemporary (i.e. < 100 years) sediment budget investigations (Walling, 2003) have provided a valuable complement to more traditional plot and laboratory experiments,
catchment monitoring and direct observations. 137Cs and excess 210Pb have been successfully used for many years to provide chronologies for recent sediments in lakes, marshes and river floodplains (e.g., Stokes and Walling, 2003), and such measurements have provided a
valuable means of assessing rates of sediment accumulation in sediment sinks. However, it is the use of these short-lived fallout radionuclides as sediment tracers that has provided new opportunities (Walling, 2006). In this context, the input of the fallout radionuclide tracers can be likened to the application of a tracer to the entire surface of a catchment. Since the fallout input is rapidly and strongly fixed by the surface soil of the catchment, measurements of the redistribution of the radionuclide across the catchment surface provide a means of
documenting rates of soil and sediment redistribution. The basis of the approach is to compare the areal activity density measured at a sampling point with a reference value or inventory,
representing the areal activity density to be expected where no net loss or gain of soil or sediment has occurred. A wide range of ‘conversion models’ have been developed to derive estimates of erosion and deposition rates from the increase or decrease in the radionuclide inventory (see Walling et al., 2002a).
In the case of 137Cs, a man-made radionuclide with a half-life of 30.2 years that originated primarily from weapons testing in the late 1950s and in some parts of the world also from the Chernobyl accident in 1986, the radionuclide affords a means of tracing soil and sediment redistribution over the past ca. 50 years. With, excess 210Pb, a natural geogenic radionuclide, the timescales are somewhat longer, but necessarily limited by the relatively short half-life of the radionuclide (22.2 years) to ca. 100 years. In contrast, the very short half-life of 7Be (53 days), provides a basis for documenting soil and sediment redistribution during individual events (Blake et al., 2002). Zapata (2002) provides a useful explanation of the basis for using these short-lived radionuclides for establishing soil erosion rates and net rates of sediment transfer from the slopes of a catchment to the stream system. Zhang and Walling (2005) discuss how information on the depth distribution of 137Cs in lake sediments can be used to derive information on rates of surface lowering within a catchment and the dominant sediment sources. Similarly, He and Walling (1996), Walling and He (1997) and Walling and Owens (2003) discuss their application to documenting sediment accretion on river floodplains and sediment storage within floodplain systems. Since the same radionuclide can be used to trace sediment transfer and storage through the different compartments of the sediment budget they can provide a basis for establishing the overall sediment budget for a catchment, although this is usually achieved by combining the radionuclide measurements with more traditional
measurements of the sediment flux at the catchment outlet and with sediment source fingerprinting techniques (Walling, 2005). Useful examples of the application of this catchment-wide approach are provided by [Walling et al., 2001], [Walling et al., 2002b], [Walling et al., 2003] and [Walling et al., 2006] and Blake et al. (2002).
4.7. Age-sample context and age-depth modelling
The various sediment dating methods can also be divided into direct and indirect dating methods. For direct methods like luminescence, the sediment itself will be dated, whereas for indirect methods, datable material which is stratigraphically related to the sediment is used for dating. An example for indirect dating is the widely used 14C dating of organic matter within floodplain sequences in order to establish fluctuations in erosion and deposition and their relationship to proxy measures of climate change (Johnstone et al., 2006). One drawback of this method is the possible incorporation of old organic matter into the sediment which results in an overestimation of the real sedimentation age. This phenomenon in well known and described by Lang and Höhnscheidt (1999) from a case study in southwest Germany, where a colluvial chronostratigraphy was established by both 14C datings of charcoal and
luminescence dating of feldspar. In summary, the 14C datings show a rather chaotic pattern of ages, whereas the luminescence dating results represent a consistent chronostratigraphy with increasing ages with depth. For this reason, incorporated material-based dating of the
sedimentation process can only be successfully achieved if there is no significant time gap between sedimentation and the age of the incorporated material. This has been be shown by Fuchs et al. (2004) whilst investigating an alluvial archive in Greece, where ‘in situ’ charcoal was identified and 14C dated. In this case, additional luminescence dating confirms the
correctness of the 14C ages interpreted as sedimentation ages. An additional problem with 14C and of course generally true for all sediments is selective bias, generally in favour of more recent sediments caused by the preservation of organic material in alluvial sequences. This
has led recent studies of Mediterranean alluviation to favour luminescence methods (Fuchs et al., 2004).
The age-depth model can be taken as a proxy for the sediment budget (Eq. (4)) and to estimate catchment erosion during the Holocene ( [Dearing and Foster, 1986], [Foster et al., 1998], [Dearing and Zolitschka, 1999] and [Jenkins et al., 2005]).
∇.qs∝∂d/∂t
where d is the sediment depth in a dated core. However, there are major assumptions and inaccuracies in both the dating, which is notoriously problematic in lakes, and in the volumetric estimates of sediment as the visual correlation of strata across the lake bed is rarely possible. An alternative is the correlation of cores using sediment magnetic properties (Dearing, 1986). However, this assumes that the magnetic properties are sediment dependant and there has been little or no lateral sorting of sediments across the lake bed. In reservoirs the sediment budget approach is routinely used in order to estimate the life expectancy and capacity of dams (Small et al., 2005). In general, either a total sediment depth to the pre-existing land surface is used as a mean erosion rate for the period since the dam was constructed or depths derived from sequential bathymetric surveys are used. Future
investigations of sediment budgets from lake sediments urgently need to incorporate catchment-wide sediment dynamics to explore the complex and nonlinear system dynamics in sedimentary systems ( [Dearing and Zolitschka, 1999] and [Coulthard and von De Wiel, 2007]).
A major approach to improving the precision and accuracy of chronologies using both 14C and other sources has been through the use of Bayesian modelling of age-depth profiles ( [Sahu, 2004] and [Chiverrell et al., 2008b]) and wiggle-matching both of which are now included in calibration packages such as OxCal (v4.0) and Calib5 ( [Buck et al., 1996] and [Bronk Ramsey et al., 2001]). Such modelling is proving particularly important in dating lake sediments which are notorious for age inversions, hiatuses and a spread of dates from different fractions. In a study of Lake Wigry in Poland, Piotrowska et al. (2006) used both Bayesian analysis and a non-linear regression method, called generalized additive models (GAMs; Birks and Heegaard, 2003).
5. New approaches to calculate long term sediment fluxes
Probably the most common sedimentary records relating to the medium–long term development of present landscapes in former glaciated and periglaciated zones are fluvial terrace sequences, at least in areas of regional uplift. Traditionally the approach to terraces has either been through the morphometric analysis of longitudinal profiles (typical in the 1950s– 1980s) or more recently through paleoenvironmental studies and dating using luminescence, amino acid racemisation (AAR) or biological correlation such as the ‘vole clock’ (Bridgland et al., 2004). Recently, the continuity equation has been used by Hancock and Anderson (2002) in the modelling of strath terrace formation. However, alluvial terraces are units of mass derived from erosion, deposited and preserved due to river incision with restricted lateral erosion. In many cases it is known that the catchment has changed dramatically making a sediment budget approach inappropriate, but in areas beyond glacial limits a basic
assumption that catchments have remained fixed and constant in area during the Later
Pleistocene, with exceptions caused by processes such as rapid incision rates or neotectonics, can be conceded as true in many cases. Fig. 5 shows a simplified valley reach with three paired terraces where the incision depth equals the terrace thickness. If the time periods are
known this allows the calculation in Eq. (5) of the total deposited mass in t1, the eroded mass from the reach only in t1 − t2, the deposited mass in t2 and so on.
∇.qs=w.h.x
where w is alluvial plain width, h is terrace thickness and x is the reach length. After incision into this highest (original or palaeo) terrace (PT1qs) the upstream and terrace continuity situation (when ▿
.qs = 0) can be defined as:
PT1qs=T1qs+T2qs+T3qs+T4qs
and in the case of a valley where scour had been equal to terrace thickness then bedrock erosion in the reach (Bqs) is:
Fig. 5. A schematic model of paired terraces with a scour depth equal to terrace thickness and a zero balance of erosion/deposition.
For the Hancock and Anderson (2002) model x becomes downstream distance:
(8)
∂h/∂t=1/w.∂qs/∂x
As a preliminary test of comparable mass and in the absence of sufficiently reliable dating, a modified version of Eq. (6) has been applied to a well developed terrace reach on the River Exe in SW England. The Exe catchment (4500 km2) lies entirely outside the maximum Pleistocene glacial limit and is assumed not to have suffered change to its catchment
boundaries. The results (Fig. 6) show an interesting constancy in terrace fragment mass, with the decreasing width of alluvial terrace being offset by an increase in thickness.
Fig. 6. A histogram of the terrace volume estimates along the lower River Exe, in SW England.
The uniform underlying geology of this reach is a relatively erodible sandstone which is not found as a significant clast component in any of the terraces except as matrix. Fig. 6 shows the estimated sediment volumes for the 18 km reach that existed within each terrace when it had just been formed. From this the volume associated with each terrace fragment has been calculated by subtraction. As can be seen from Fig. 6 the volumes, which are in effect a flux rate, are approximately constant with the exception of terrace 4. The reason for this is that whilst the reduction in width from terrace 5 to 4 is minimal (300 m reduction) the mean depth of terrace 4 (1.8 m) is far less than that of all the other terraces so there is less mass in terrace 4 than is predicted by the erosion of terrace 5 suggesting that at this point in the evolution of the terraces there was a net loss of terrace gravel. However, in general there is a constancy suggesting that bedrock erosion creates sand-sized sediment which is largely lost from the reach with the vast bulk of the terrace mass being simply reworked from the previous terrace gravels. Of course, many recent studies of terrace sequences have shown how common composite terraces are but the approach could still be used to demarcate between periods of net aggradation and periods of net erosion. Although this is a very crude and preliminary approach it is a first approximation. Luminescence dating on the Exe terraces is underway and increased precision in the measurement of terrace volumes (using remote sensing) combined sediment budget modelling could provide us with long-term sediment budgets linked to landscape evolution, climate and uplift.
This preliminary approach exemplifies one of the future challenges in converting sedimentary records to calculation of catchment sediment fluxes. To temporally resolve sediment budgets, multiple sediment bodies have to be dated in one catchment; for upstream terrace reaches using the approach described above, for downstream alluvial plains and deltas by working with time lines enveloping a certain sediment body (e.g., the approach used by Erkens et al., 2006). Combining these two approaches would allow catchment-wide sediment budgets studies on a larger spatial scale. These temporally resolved sediment budgets would induce an important step towards calculating catchment-scale sediment fluxes and residence time of sediment in catchments (see also Section 2), both of which are crucial elements in the understanding of the landscape and its formation.
6. Conclusions
All the constraints inherent in the sediment budget approach seem amenable to technological advancements. Our ability to remote sense topography and near-surface sediments offers the potential to overcome the present constraints of time and space. The ever expanding
possibilities of GIS help us to manage data in large databases and enable statistical analyses of data therein. Simultaneously the development of improved, largely clastic sediment-based dating techniques have the potential to enable accurate multi-period budgeting that will allow the correlation of sediment flux with forcing factors including climate and human activity. These developments all make calculation of sediment budgets for (sub)catchment-wide systems much more feasible. This also evokes new questions and challenges, such as through-flow rates, residence time of sediment and erosion quantification. The development of
cosmogenic nuclide based estimation of erosion rates is important and must be reconciled with studies of the short to medium radionuclide erosion rate estimates and the short-term storage response of basins and apparent non-steady state behaviour. Two under-researched areas are highlighted; firstly the pedogenetic approach to hillslope erosion and secondly the use of lakes in the estimation of catchment erosion rates. Lastly the application of the
sediment budget approach to river terrace deposits from unglaciated catchments is explored as a future avenue in the modelling of landform evolution. All recent developments and new approaches in sediment budgeting mentioned in this paper contribute to the process of translating sedimentary records into sediment budgets. This review concludes that due to a combination of technological advances the true potential of the sediment budget approach can only now be realized and will make a significant contribution to geomorphology.
Acknowledgements
The authors must acknowledge Sue Rouillard for cartographic assistance, Keith Challis and Andy Howard for collaboration on LIDAR acquisition and processing, Peter Houben for organizing the LUCIFS workshop and his editing of the paper and Peter Gell for chairing the discussions that stimulated this paper. This paper has also benefited from contributions by many others including Laura Basell, Adrian Harvey, Mark Macklin and Geog Duller. The LIDAR and GPR studies used in this paper were funded through the Aggregate Levy Sustainability Fund through English Heritage. This paper is a contribution by the LUCIFS Research Programme.
References
Arnaud et al., 2005 F. Arnaud, M. Revel, E. Chapron, M. Desmet, N. Tribovillard
7200 years of Rhone river flooding activity in Lake Le Bourget, France: a high-resolution sediment record of NW Alps hydrology Holocene, 15 (2005), pp. 420–428
Arnold et al., 2007 L.J. Arnold, R.M. Bailey, G.E. Tucker Statistical treatment of fluvial dose distributions from southern Colorado arroyo deposits Quaternary Geochronology, 2 (2007), pp. 162–167
Asselman et al., 2003 N.E.M. Asselman, H. Middelkoop, P.M. van Dijk The impact of changes in climate and land use on soil erosion, transport and deposition of suspended sediment in the River Rhine Hydrological Processes, 17 (2003), pp. 3225–3244
Beerten and Stesmans, 2005 K. Beerten, A. Stesmans Single quartz grain electron spin resonance (ESR) dating of a contemporary desert surface deposit, Eastern Desert, Egypt Quaternary Science Reviews, 24 (2005), pp. 223–231
Berendsen and Stouthamer, 2000 H.J.A. Berendsen, E. StouthamerLate Weichselian and Holocene palaeogeography of the Rhine–Meuse delta, The Netherlands
Palaeogeography, Palaeoclimatology, Palaeoecology, 161 (2000), pp. 311–335 Berendsen and Stouthamer, 2001 H.J.A. Berendsen, E. Stouthamer (Eds.),
Palaeogeographic development of the Rhine–Meuse delta, The Netherlands, Van Gorcum, Assen, The Netherlands (2001) 270 pp.
Berendsen and Volleberg, 2007 H.J.A. Berendsen, K.P. Volleberg New prospects in geomorphological and geological mapping of the Rhine–Meuse Delta—application of detailed digital elevation maps based on laser altimetry Netherlands Journal of Geosciences, 86 (2007), pp. 15–22
Berendsen et al., 2001 H.J.A. Berendsen, K.M. Cohen, E. Stouthamer The geological– geomorphological map and palaeogeographic maps of the Rhine–Meuse delta H.J.A. Berendsen, E. Stouthamer (Eds.), Palaeogeographic development of the Rhine–Meuse delta, The Netherlands, Van Gorcum, Assen, The Netherlands (2001), pp. 183–258 Berendsen et al., 2007 H.J.A. Berendsen, K.M. Cohen, E. Stouthamer The use of GIS in reconstructing the Holocene palaeogeography of the Rhine–Meuse delta, The
Netherlands International Journal of Geographical Information Science, 21 (2007), pp. 589–602
Bierman and Steig, 1996 P. Bierman, E.J. Steig Estimating rates of denudation using cosmogenic isotope abundances in sediment Earth Surface Processes and Landforms, 21 (1996), pp. 125–139
Bierman and Nichols, 2004 P.R. Bierman, K.K. Nichols Rock to sediment–slope to sea with Be-10–rates of landscape change Annual Review of Earth and Planetary Sciences, 32 (2004), pp. 215–255
Birkeland, 1974 P.W. Birkeland Pedology, Weathering and Geomorphological Research Oxford University Press, New York (1974)
Birks and Heegaard, 2003 H.J.B. Birks, E. Heegaard Developments in age-depth modelling of Holocene stratigraphical sequences PAGES News, vol. 11 (2003), pp. 7–8 Blake et al., 2002 W.H. Blake, D.E. Walling, Q. He Using cosmogenic beryllium-7 as a tracer in sediment budget investigations Geografiska Annaler, 84A (2002), pp. 89–102 Bréhéret et al., in press Bréhéret, J.G., Fourmont, A., Macaire, J.-J., Négrel, P., in press. Microbially mediated carbonates in the Holocene deposits from Sarliève, a small ancient lake of the French Massif Central, testify to the evolution of a restricted environment. Sedimentology.doi: 10.1111/j.1365-3091.2007.00912.x.
Bridge et al., 1998 J. Bridge, R. Collier, J. Alexander Large-scale structure of structure of Calamas River deposits (Nebraska, USA) revealed using ground penetrating radar Sedimentology, 45 (1998), pp. 977–986
Bridgland et al., 2004 D.R. Bridgland, D. Schreve, D.H. Keen, R. Meyrick, R. Westaway Biostratigraphic correlation between the late Quaternary sequence of the Thames and key fluvial localities in Central Germany Proceedings of the Geologists Association, 115 (2004), pp. 125–140
Bristow et al., 2005 C.S. Bristow, N. Lancaster, G.A.T. Duller Combining ground penetrating radar surveys and optical dating to determine dune migration in Namibia Journal of the Geological Society, 162 (2005), pp. 315–321
Bronk Ramsey et al., 2001 C.J. Bronk Ramsey, J. van der Plicht, B. Weninger Wiggle matching’ radiocarbon dates Radiocarbon, 43 (2001), pp. 381–389
Brown, 1997 A.G. Brown Alluvial Environments: Geoarchaeology and Environmental Change Cambridge University Press, Cambridge (1997)
Brown et al., 2005 A.G. Brown, J. Hatton, L. Pearson, R. Roseff, R. Jackson The Severn– Wye revisited: Late Glacial–Holocene floodplain palaeoenvironments in the Lugg Valley ,in: D.N. Smith, M.B. Brickley, W. Smith (Eds.), Fertile Ground. Papers in Honour of Susan Limbrey, Symposia for the Association of Environmental Archaeology, vol. 22, Oxbow Books, Oxford (2005), pp. 16–29
Brown et al., 2007 A.G. Brown, C. Carey, K. Challis, A.M. Howard, M. Kincey, E. Tetlow, L. Cooper Predictive modelling of multi-period geoarchaeological resources at a river confluence Phase II Report (PNUM 3357), ALSF Report, English Heritage, London (2007) Buck et al., 1996 C.E. Buck, W.G. Cavanagh, C.D. Litton Bayesian approach to interpreting archaeological data Wiley, Chichester (1996)
Carey et al., 2006 C.J. Carey, A.G. Brown, K.C. Challis, A.J. Howard, L. Cooper Predictive modelling of multiperiod geoarchaeological resources at a river confluence: a case study from the Trent–Soar, UK Archaeological Prospection, 13 (2006), pp. 241–250
Chiverrell et al., 2008a R.C. Chiverrell, A.M. Harvey, S.Y. Hunter (nee Miller), J. Millington, N.J. Richardson Late Holocene environmental change in the Howgill Fells, Northwest England Geomorphology, 100 (2008), pp. 41–69
Chiverrell et al., 2008b R.C. Chiverrell, G.C. Foster, G.S.P. Thomas, P. Marshall, D. Hamilton Robust chronologies for landform development Earth Surface Processes and Landforms, 34 (2008), pp. 319–328 http://dx.doi.org/10.1002/esp.1720
Clarke, 1990 A. Clarke Seeing beneath the soil Batsford, London (1990)
Cockburn and Summerfield, 2004 H.A.P. Cockburn, M.A. Summerfield Geomorphological applications of cosmogenic isotope analysis Progress in Physical Geography, 28 (2004), pp. 1–42