HAL Id: hal-00304898
https://hal.archives-ouvertes.fr/hal-00304898
Submitted on 1 Jan 2003HAL is a multi-disciplinary open access archive for the deposit and dissemination of sci-entific research documents, whether they are pub-lished or not. The documents may come from teaching and research institutions in France or abroad, or from public or private research centers.
L’archive ouverte pluridisciplinaire HAL, est destinée au dépôt et à la diffusion de documents scientifiques de niveau recherche, publiés ou non, émanant des établissements d’enseignement et de recherche français ou étrangers, des laboratoires publics ou privés.
nitrogen deposition on selected lakes and streams of the
Central Alps (Italy)
M. Rogora, A. Marchetto, R. Mosello
To cite this version:
M. Rogora, A. Marchetto, R. Mosello. Modelling the effects of atmospheric sulphur and nitrogen deposition on selected lakes and streams of the Central Alps (Italy). Hydrology and Earth System Sciences Discussions, European Geosciences Union, 2003, 7 (4), pp.540-551. �hal-00304898�
Modelling the effects of atmospheric sulphur and nitrogen
deposition on selected lakes and streams of the Central Alps
(Italy)
M. Rogora, A. Marchetto and R. Mosello
CNR Institute of Ecosystem Study, Section of Hydrobiology and Ecology of Inland Waters, L.go Tonolli 50, I-28922 Verbania Pallanza, Italy E-mail for corresponding author: [email protected]
Abstract
The dynamic model MAGIC was calibrated and applied to selected sites in north-western Italy (3 rivers, 10 alpine lakes) to predict the future response of surface water to different scenarios of atmospheric deposition of S and N compounds. Results at the study sites suggest that several factors other than atmospheric deposition may influence the long-term changes in surface water chemistry. At present the lumped approach of dynamic models such as MAGIC cannot represent all the processes occurring at the catchment scale. Climate warming in particular and its effects on surface water chemistry proved to be important in the study area. Furthermore the river catchments considered here showed clear signs of N saturation. This condition and the increasing concentrations of NO3 in river water were simulated using N dynamics recently included in MAGIC. The modelling performed in this study represents the first application of MAGIC to Italian sites. The results show that inclusion of other factors specific to the Mediterranean area, such as dust deposition and climate change, may improve the fit to observed data and the reliability of the model forecast. Despite these limitations, the model captured well the main trends in chemical data in both rivers and lakes. The outputs clearly demonstrate the benefits of achieving the emission reductions in both S and N compounds as agreed under the Gothenburg Protocol rather than making no further emission reductions. It was also clear that, besides the substantial reduction of SO4 deposition from the peak levels of the 1980s, N deposition must also be reduced in the near future to protect freshwaters from further acidification.
Keywords: MAGIC, northern Italy, acidification, recovery, nitrogen saturation.
Introduction
MAGIC (Model of Acidification of Groundwater In Catchments) is a process-oriented dynamic model, of intermediate-complexity, for the long term reconstruction and future prediction of soil and surface water acidification at the catchment scale (Cosby et al., 1985a, b). It has been in use for more than 15 years and extensively tested on catchments in North America (Cosby et al., 1986) and Europe (Wright et al., 1994; Jenkins et al., 1997). An exhaustive description of the model including the most recent refinements is given in Cosby et al. (2001). MAGIC has been widely applied to several catchments and the refinements regarding aluminium (Al) solubility and organic acids have resulted in improved performance of the model in simulating soil and surface water chemistry. The recent
inclusion of nitrogen (N) dynamics represents an attempt to simulate processes controlling ammonium (NH4) and nitrate (NO3) concentrations in soil solution and surface waters. The refined version of the model, MAGIC 7, has already been applied to experimentally manipulated catchments to test the efficiency of N dynamics to reproduce the response of surface water to change in N deposition (Wright et al., 1998; Jenkins and Cullen, 2001).
The calibration and application of MAGIC 7 presented here is one of the first attempts to use dynamic modelling to simulate soil and surface water chemistry at Italian sites. The model has been successfully applied in several cases at a European level proving to be a suitable method to assess the surface water response to change in acid deposition; nevertheless each new modelling exercise has to consider
the main characteristics of the study area, both from the point of view of soil and surface waters and of atmospheric deposition pattern. The main peculiarities in the Lake Maggiore catchment area, where the study sites are located, are:
1. the meteorological pattern, with high deposition due to the orographic effect and high loads of N and sulphur (S) compounds due to the location of the area north of the Po plain (Della Lucia et al., 1996);
2. the geological complexity of the area, with many different lithologies and soil types;
3. the heterogeneity of the vegetation cover, mainly due to the presence of a pronounced altitudinal gradient. In common with other European sites, the Lake Maggiore catchment area has undergone a strong decrease in sulphate (SO4) deposition (Evans et al., 2001), due to the effect of reduced emissions of S oxides. On the other hand, N oxides (NOx) and ammonia (NH3) emissions and the atmospheric deposition of N compounds have not changed significantly in the last two decades (Rogora et al., 2001). Previous studies provided evidence of the critical situation of this area with regard to N both in atmospheric deposition and surface
waters. NO3 concentrations in Lake Maggiore, recorded since the 1950s, clearly indicate a gradual increase, which was steepest in the 1960s and 1970s. Recent studies pointed out the prominent role of atmospheric deposition as a N source in the Lake Maggiore catchment (Mosello et al., 2001).
Study sites and methods
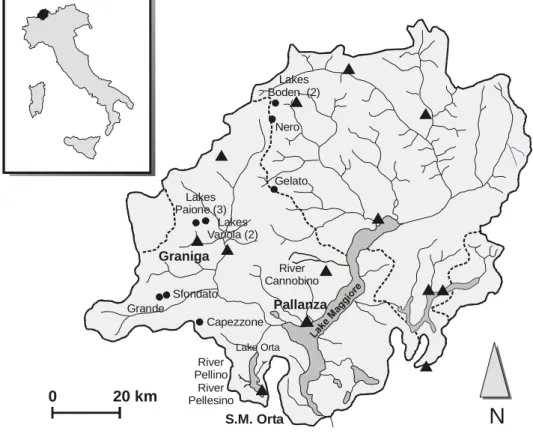
All the sites considered in this study are located in the Lake Maggiore catchment area, north-western Italy (Fig. 1). This area (6600 km2) lies half in Italy (Piedmont and Lombardy) and half in Switzerland (Canton Ticino). It borders on the most densely inhabited part of the Po plain to the north, and it is the area which receives the highest S and N loads in Italy (Mosello and Marchetto, 1996). Studies on the chemistry of atmospheric deposition in this area are performed continuously through collaboration between the CNR Institute of the Ecosystem Study and the Department of Cantonal Agency for Water Protection of Canton Ticino, which run the sampling stations in the Italian and Swiss parts of the region, respectively. The distribution of the atmospheric deposition sampling stations throughout the area (Fig. 1) and the availability of long-term series of
0 20 km
N
Graniga Lakes Paione (3) Sfondato Grande Capezzone Lakes Variola (2) Gelato River Cannobino River Pellino River Pellesino Nero Lakes Boden (2) Pallanza S.M. Orta Lake OrtaFig. 1. The study area (Lake Maggiore catchment, north-western Italy) with the location of the sites used for
chemical data (since the mid 1980s for most stations) allow a reliable estimation of the atmospheric loads of the major pollutants affecting the study sites.
MAGIC was calibrated and applied to a total of 13 sites (3 subalpine rivers and 10 alpine lakes). Two rivers (Pellino and Pellesino), tributaries of Lake Orta located in the southern part of the study area (Fig. 1) are subject to the highest deposition of pollutants (Della Lucia et al., 1996). The River Cannobino, further north than the others, is a tributary of Lake Maggiore (Fig. 1). The other sites are small lakes (< 0.06 km2) located in the highest part of the area, all above the timberline (> 2000 m a.s.l.) (Fig. 1). A detailed description of the study area and of the sites selected for the modelling can be found in Rogora et al. (2001).
For all the sites, the target year chosen for the calibration was 2000; however, this year was characterised by very high precipitation (2263 mm on the whole Lake Maggiore catchment compared to the mean values for the period 1978 99 of 1689 mm) and consequently by an altered hydrological pattern both in river and lake catchments. To reduce the influence of interannual variability on the modelling results, the calibration was performed to reproduce the mean water chemistry of the period 19982000. The same approach was used for input data: atmospheric deposition concentrations used in MAGIC were mean values of the last three to four years, precipitation volume and runoff were obtained by averaging the data of quite long periods (not less than five years).
MAGIC requires as input the contribution of dry to total deposition, expressed as Dry Deposition Factors (DDF) values. Dry deposition was not measured directly at any sampling site in the study area, and so a fixed ratio between dry and wet deposition was calculated on the basis of deposition velocities for S and N compounds found in the literature and the percentage of the total area covered by forest, agricultural land and lakes, rocks and settlements in each catchment (Rogora et al., 2001).
A hindcast period of 140 years (18602000) was used in the modelling. The forecast target years were 2016 (in line with the implementation of the Water Framework Directive), and 20 years thereafter, 2036.
RIVERS
Some information about land cover in the study catchments was already available before this study began (Boggero et
al., 1996), but data about soil distribution and characteristics
were lacking. A soil survey was started in 2000 with the aim of collecting information about soil in the catchments of the Rivers Pellino and Pellesino. The River Cannobino was also included in the modelling exercise; some hypotheses about the main soil types in this catchment were derived from a detailed map of the main lithological types. In addition, some results of soil sampling and analysis were available for the Centovalli area, located in the Swiss part of the Lake Maggiore catchment and with a similar geological composition to the River Cannobino catchment. These data were provided by the Swiss Agency for the Environment, Forests and Landscape (SAEFL); while not directly applicable in the calibration procedure, they were used to make some assumptions about soil depth and composition in the River Cannobino area. The average runoff values and the main soil characteristics of the three catchments are shown in Table 1.
For the River Cannobino catchment, the atmospheric deposition concentrations used as input to MAGIC were those of Pallanza; data collected at the sampling station of S.M. Orta were used for the other rivers (Fig. 1).
ALPINE LAKES
The soil cover in alpine catchments is generally considered negligible. Furthermore, information about soil cover in mountainous areas is generally scarce. No soil maps, nor any data regarding soil characteristics, were found for the alpine area in north-western Italy. To collect the basic information required for the modelling, some sampling and analysis were performed on nine selected catchments in the summer of 2000 and 2001 (Table 2). A previous soil survey had been performed in 1998 in the Lake Paione Superiore (LPS) catchment, so that detailed information about soil cover was already available. LPS has been sampled more or less continuously since the end of the 1970s, even though the sampling frequency had differed from one year to
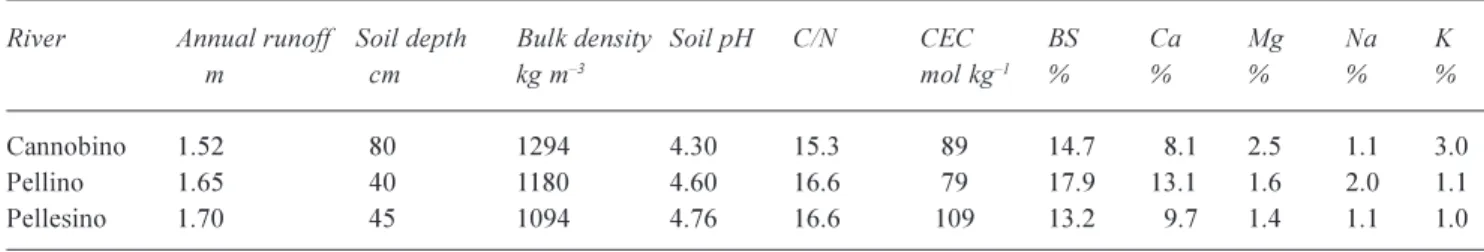
Table 1. Average runoff values and soil characteristics of the river catchments. CEC: cation exchange capacity. BS: base saturation. River Annual runoff Soil depth Bulk density Soil pH C/N CEC BS Ca Mg Na K
m cm kg m3 mol kg1 % % % % %
Cannobino 1.52 80 1294 4.30 15.3 89 14.7 8.1 2.5 1.1 3.0 Pellino 1.65 40 1180 4.60 16.6 79 17.9 13.1 1.6 2.0 1.1 Pellesino 1.70 45 1094 4.76 16.6 109 13.2 9.7 1.4 1.1 1.0
another (Mosello et al., 1999). Hence the model was calibrated using the whole data series, in an attempt to reproduce both the water chemistry of the target year (2000) and the long-term trend of the main chemical variables. No long-term series of chemical data were available for the other lakes, and so the calibration was performed taking into account merely the chemistry of the target year (the mean values of 200001 were used). Multiple samplings and analyses of lake water had been performed since the mid 1980s only in a few lakes (e.g. Variola, Boden); these results were used to drive the calibration with the aim of reproducing the trends in chemical data such as the decrease in SO4 concentration.
The atmospheric deposition sampling station of Graniga, in operation since 1994, is located quite close to LPS, about 800 m lower (Fig. 1). Data collected at this station were used as input to MAGIC to describe the chemistry of atmospheric deposition affecting the LPS catchment. For the other lakes, the atmospheric inputs to be used in MAGIC were derived from the deposition maps obtained by interpolating precipitation and concentration data.
SCALE FACTORS FOR ATMOSPHERIC DEPOSITION
In the framework of the RECOVER:2010 project, the scale factors (SFs) for atmospheric deposition sequences were calculated for each cell of the EMEP grid (150 km × 150 km) using the RAINS model versions 6.1 and 7.5 (Alcamo et
al., 1990; Ferrier et al., 2001).
For the hindcast data measured at the station of Pallanza were also available, albeit only from 1975, but in some cases these do not match the modelled data; for example, SO4 deposition at Pallanza reached maximum values in the 1980s, but not to the same extent as was predicted by the
RAINS model; subsequently, according to the model, N deposition should have started to decrease in the 1990s, but this prediction is not borne out by the measured data. For this reason, the measured data available were used to drive the deposition sequence for the most recent period, and modelled data were used for future scenarios. Two different scenarios were considered: CONST (worst case), and CLE (Current Legislation Protocol or best case). In the former scenario the depositions of SO4, NO3 and NH4 were held at the present level for the next 50 years. In the latter scenario it was assumed that depositions change as a consequence of the present protocol application including implementation of the Gothenburg Protocol (UN-ECE, 1999). The CLE scenario predicts a further reduction of SO4 deposition, though less pronounced than the reduction observed in the last 20 years. In Northern Italy NO3 deposition is supposed to decrease by 40% (compared to 2000 levels) by 2015, and then remain constant. SFs for NH4 are available only up to 2010, but no variations are envisaged for this period.
CALIBRATION PROCEDURE
The physico-chemical soil and surface water characteristics measured directly are regarded as fixed parameters in MAGIC, and the measured data are used as input in the calibration procedure. Those parameters which are not directly measurable must be calibrated at each site to match the observed soil and surface water chemistry (target variables).
The calibration at all the sites was processed in a sequential manner:
1. firstly, the surface water concentration of chloride (Cl) was simulated by assuming steady-state with respect to
Table 2. Main characteristics of alpine lakes and their catchments. CEC: cation exchange capacity. BS: base saturation. Lake Lake Catchment Rocks Soil Soil Bulk C/N CEC BS Ca Mg Na K
area area depth density
ha ha % % cm kg m3 mol kg1 % % % % % Grande 0.8 826238 18 1140 13.6 148 8.1 6.5 0.7 0.6 0.2 Sfondato 0.5 23 58 42 28 1091 12.7 171 8.7 7.1 1.0 0.5 0.1 Capezzone 0.9 29 57 43 29 950 12.9 187 8.5 7.0 0.7 0.5 0.3 Variola Superiore 0.9 64 51 49 321105 15.9 191 8.5 7.1 0.7 0.5 0.2 Variola Medio 0.7 9251 49 321105 15.9 191 8.5 7.1 0.7 0.5 0.2 Nero 6.1 110 85 15 27 1110 19.1 11220.217.4 1.6 0.7 0.4 Boden Inferiore 5.9 85 70 30 23 1116 17.5 179 20.3 17.6 1.9 0.6 0.3 Boden Superiore 2.8 28 70 30 23 1116 17.5 179 20.3 17.6 1.9 0.6 0.3 Gelato 0.8 14 75 25 21 1095 12.5 106 16.0 13.5 1.5 0.7 0.4 Paione Superiore 1.6 57 7228 37 1294 16.5 133 10.0 7.3 3.7 0.7 0.6
atmospheric inputs, since Cl in the model has no adsorbed phase;
2. next, the SO4 adsorption parameters were adjusted so as to reproduce the measured concentration of SO4 in surface waters; the contribution of weathering was also taken into account and calibrated at each site;
3. the calibration of base cations (BC) required comparison of the results of model simulation to observed soil and surface water BC data. The target variables consist of surface water concentrations and soil exchangeable fractions of Ca, Mg, Na and K. Weathering rates and selectivity coefficients for the soils were adjusted to match soil and surface water BC targets.
The calibration was performed as follows: after each historical simulation the outputs were compared to the measured data, the adjustable parameters modified as necessary to improve the fit, and the simulation re-run. This procedure was repeated until no further improvement in the fit could be achieved. The calibration was performed firstly so as to match the observed data of the target year (mean values for the last three to four years). pH values and the concentrations of SO4, NO3, BC and ANC (Acid Neutralising Capacity) were considered as target variables. ANC was calculated as the difference between the sum of base cations (Ca, Mg, Na, K) and the sum of acid anions (SO4, NO3, Cl).
The procedure was subsequently repeated for the rivers and for LPS so as to obtain the best possible fit to the whole trend of measured data. Model outputs and observed water chemistry were compared after each run for the period covered by the measured data. This gave more reliable calibration results than those obtained using only a mean target value.
Results and discussion
CALIBRATION
A successful calibration of the MAGIC model was achieved for the rivers Cannobino, Pellino and Pellesino and for 10 alpine lakes. Reconstructed trends of the major chemical variables in surface waters were in good agreement with the measured data at the sites for which long-term data series were available (the rivers and LPS). As an example, Fig. 2 compares the monthly mean values of selected variables at two sites and those resulting from the calibration. The results of the calibration for the alpine lakes (LPS included) are summarised in Table 3, where the measured values for some variables are compared with the modelled data.
A good agreement between modelled and measured
concentrations of SO4 was achieved at all sites. S dynamics are simulated in MAGIC through parameters regulating the SO4 retention capacity of soils. In the LPS watershed the input/output budget of SO4 is towards steady state. This situation can be reproduced easily by assuming that soils have a limited SO4 retention capacity. The more developed soils in river catchments play a major role in SO4 adsorption and release, as emerged from the calculation of input/output budgets: all the river catchments showed a negative trend in the percent retention of SO4 (i.e. net loss of SO4) during the 1990s (Rogora et al., 2001). The mismatch between input and output fluxes could be related also to uncertainty in the estimation of dry deposition (as percentage of the total atmospheric input) and to the weathering of S-containing minerals (Prechtel et al., 2001). Both these sources of uncertainty were assumed to be constant in time. Basing on the information on lithology in river catchments (Boggero
et al., 1996), the contribution from weathering was calibrated
at each site and resulted in the range of 3050 meq m2 y1. A good correspondence between the pH trend observed in the River Pellino and the modelled pH was achieved. Results of the calibration of pH values for the River Cannobino were less satisfactory (Fig. 2). pH values were under-estimated by the model compared to the measured data in the most acid sensitive lakes as well (Table 3). pH is well-known to be a critical variable, sensitive to several environmental factors besides the effects of acidifying compounds. Moreover, recent climate changes have affected the chemistry of streams and alpine lakes, in particular as regards pH, alkalinity and BC trends (Rogora et al., 2002). NO3 trends were simulated by applying a N model in MAGIC dealing with N dynamics (Cosby et al., 2001). All the three rivers showed significant positive trends of NO3 concentrations since the late 1970s. River Cannobino received a distinctly lower N input than the other catchments. This difference is reflected in the output fluxes, which indicate that the southernmost basins have reached a higher stage of N saturation than the Cannobino catchment (Rogora
et al., 2001). To simulate these trends in measured data, N
dynamics in the model were used. Both the upper (CNUP) and the lower (CNLO) threshold values of the C/N ratio in the soil were calibrated at each site. The percentage of inorganic N immobilised in the soil varies linearly from 100% to 0% as the C/N ratio of the organic matter declines from CNUP to CNLO during the simulation (Cosby et al., 2001).
Some problems were encountered in the calibration procedure applied to the Italian sites. Considerable uncertainty was observed in the vertical spatial aggregation procedure of soil data, which is required for producing inputs to the model. This proved to be a major problem in the case
6.4 6.6 6.8 7.0 7.2 7.4 7.6 7.8 8.0 1970 1974 1978 1982 1986 1990 1994 1998 2002 pH modelled measured 6.5 7.0 7.5 8.0 8.5 9.0 9.5 1970 1974 1978 1982 1986 1990 1994 1998 2002 pH modelled measured 0 50 100 150 200 250 1970 1974 1978 1982 1986 1990 1994 1998 2002 SO 4 = (µ eq l -1) 0 50 100 150 200 250 300 1970 1974 1978 1982 1986 1990 1994 1998 2002 SO 4 = (µ e q l -1) 0 20 40 60 80 100 120 140 160 180 200 1970 1974 1978 1982 1986 1990 1994 1998 2002 NO 3 - (µ eq l -1) 0 20 40 60 80 100 120 1970 1974 1978 1982 1986 1990 1994 1998 2002 NO 3 - (µ eq l -1)
Fig. 2. Comparison between the hindcast simulation by MAGIC and the measured data (monthly mean values and regression line) of some
variables in River Pellino (left) and River Cannobino (right).
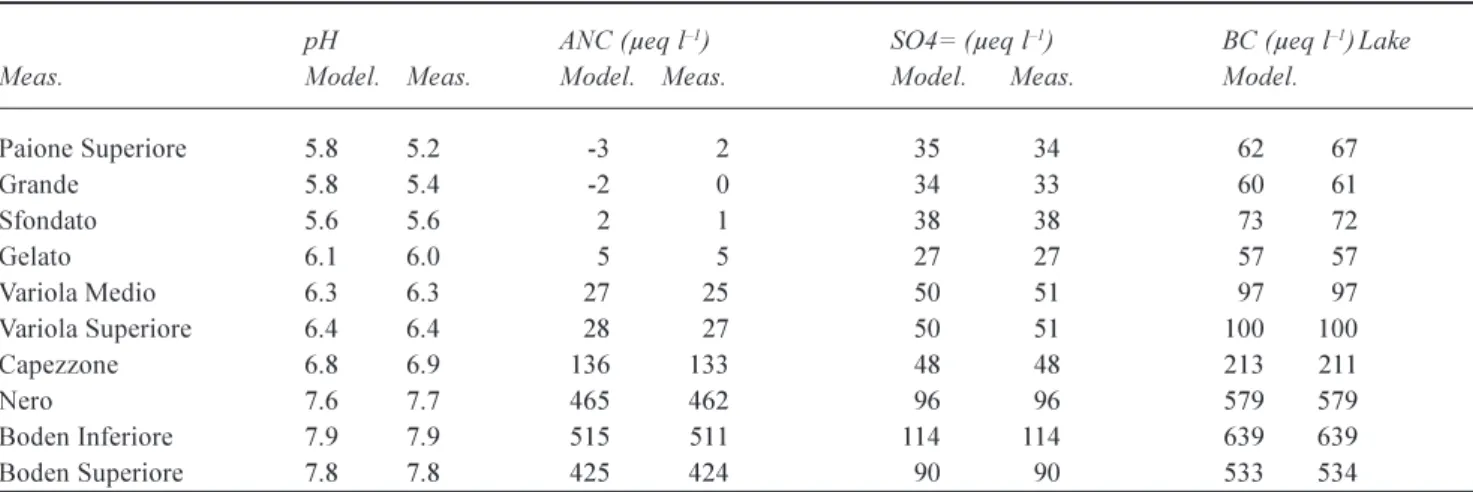
Table 3. Comparison between measured (mean values of 2000-2001) and simulated values of some chemical variables in alpine lakes pH ANC (µeq l1) SO4= (µeq l1) BC (µeq l1)Lake
Meas. Model. Meas. Model. Meas. Model. Meas. Model.
Paione Superiore 5.8 5.2-3 2 35 34 6267 Grande 5.8 5.4 -20 34 33 60 61 Sfondato 5.6 5.6 21 38 38 73 72 Gelato 6.1 6.0 5 5 27 27 57 57 Variola Medio 6.3 6.3 27 25 50 51 97 97 Variola Superiore 6.4 6.4 28 27 50 51 100 100 Capezzone 6.8 6.9 136 133 48 48 213 211 Nero 7.6 7.7 465 46296 96 579 579 Boden Inferiore 7.9 7.9 515 511 114 114 639 639 Boden Superiore 7.8 7.8 425 424 90 90 533 534
of the large catchment of the River Cannobino (110 km2) for which no measured soil data were available.
Historical NO3 concentrations in stream waters, particularly in the Rivers Pellino and Pellesino, increased steeply (Rogora et al., 2001; Wright et al., 2001). The parameters driving N dynamics in the model were adjusted to simulate the sharp increase of NO3 in stream waters. N dynamics in the model are highly simplified, so that they could be simulated with a limited number of parameters, which are easily measurable at most of the sites. At the same time this simplification leads to greater sensitivity of the model outputs. Further information on the pool of organic matter in the soil, particularly as regards its C and N content, would be useful to improve modelling at Italian sites.
The contribution of weathered SO4 to the total SO4 input to stream waters is a further source of uncertainty in the model calibration. In all of the river catchments, particularly that of the River Cannobino, the presence of rocks with gypsum or other S minerals cannot be ignored. It is difficult to estimate this input in terms of mean yearly value, as the observed data are inadequate. A further complication is the strong influence that meteorological conditions have on these processes (Mitchell et al., 2001).
APPLICATION
The results of the application of the model to rivers and lakes in Northern Italy are summarised in Figs. 35. Reconstructed surface water chemistry for the rivers and for LPS is shown starting from 1860, after which the two different scenarios CONST and CLE were applied. As results for the Rivers Pellino and Pellesino were very similar, the River Pellino results only are shown.
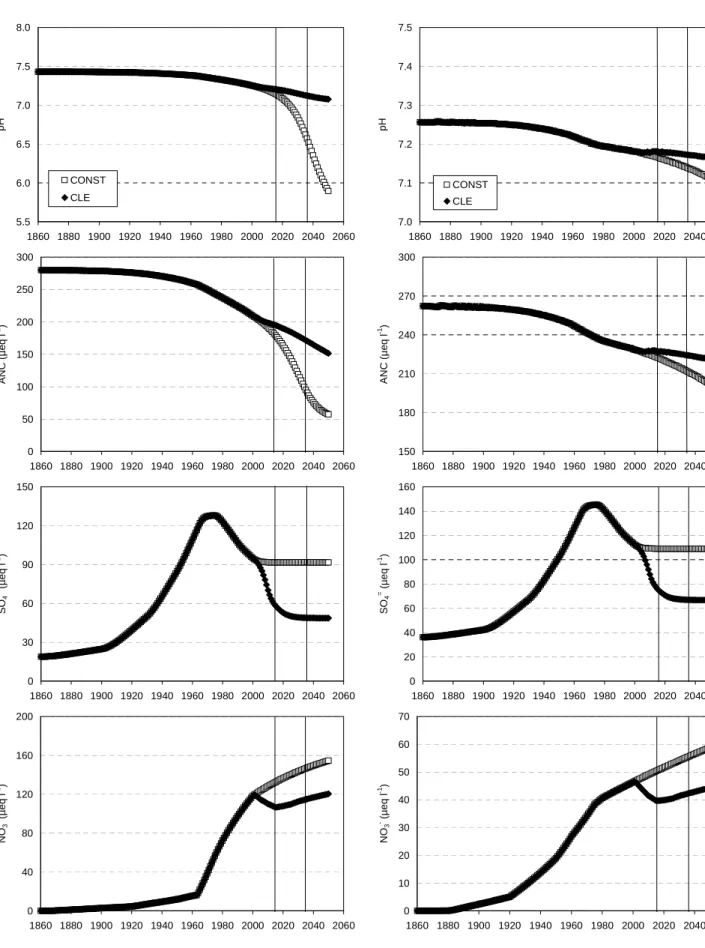
In both River Cannobino and River Pellino peaks of SO4 concentrations (about 145 and 130 µeq l1, respectively) were reached in the 1970s, when the atmospheric deposition of S compounds was also at its maximum. The SO4 content in river waters then started to decrease, reaching its present values of 110 and 95 µeq l1 in River Cannobino and River Pellino, respectively. According to the model forecast, SO4 concentrations will continue to decrease in the next 20 years, after which they will level off (Fig. 3).
Following the sharp decline in surface water SO4 concentrations during the last 1520 years, a recovery of pH and ANC might be expected. According to the model outputs, however, this recovery will not take place for a couple of decades, even under the CLE scenario, due to increasing NO3 concentrations. The model hindcast simulated very low levels of NO3 in river waters at the beginning of the 20th century. Then, when the N deposition began to increase in the 1930s, the NO3 concentrations in
river waters also started a positive steep trend, which was more regular in the River Cannobino (Fig. 3). Measured data have already shown how these river catchments are totally or partially affected by N saturation (Rogora et al., 2001). In the future the level of N saturation will be the dominant driving factor determining the response of surface waters to changes in atmospheric deposition. Leaching of NO3 to surface waters would lead to its increasing concentration in these waters, as predicted by the model. This process will occur whether N deposition remains constant or decreases. In the former case (CONST scenario), NO3 concentrations in the River Pellino could reach 150 160 µeq l1 before the middle of the century; in the latter case (CLE scenario) concentrations will initially decrease (until 2016). Then, as the declining C/N ratio crosses the upper threshold (CNUP), leaching of inorganic N begins and then increases again as the C/N ratio declines. This will lead NO3 concentrations in River Pellino to reach about 120 µeq l1 in 2050 (Fig. 3). Consequently, under the worst case scenario, acidification will continue and pH and ANC will decline to values of approximately 6.0 and 60 µeq l1, respectively. Under the CLE scenario, pH will decrease slightly from the present value of 7.27.3 to about 7.1. The decline in ANC will be more striking, with a reduction of about 50 µeq l1 compared to present day concentrations (Fig. 3).
In the River Cannobino catchment N saturation is not so advanced as in the southern catchments. However, a similar pattern of chemical change is predicted: under the CLE scenario NO3 will initially decrease, then slowly increase from 2020 (Fig. 3). The range of NO3 concentrations is considerably lower than in the River Pellino, and the trend slope is less steep as a result of lower level of N inputs. In addition, the current status of surface water acidification at this site is highly dependent on the present N status of the catchment soil.
The pattern of change of surface water pH was studied in detail for the alpine lake Paione Superiore. pH in this lake in pristine condition, before the onset of acidification, was above 6.5. It started to decrease in 192030 with the lowest values reached in the 1980s, in correspondence with the highest levels of SO4 in the lake water. The same pattern can be observed for ANC concentrations, which decreased from the original values of 4550 µeq l1 to values close to zero (Fig. 4). A recovery process started in the 1980s, as a consequence of the decrease of acidifying inputs from the atmosphere.
The reconstruction of pH values in LPS since 1860 provided by the model was compared with the pH inferred during a paleoecological study of the same lake based on paleolimnological analyses: diatom frustules,
chryso-5.5 6.0 6.5 7.0 7.5 8.0 1860 1880 1900 1920 1940 1960 1980 2000 2020 2040 2060 pH CONST CLE 7.0 7.1 7.2 7.3 7.4 7.5 1860 1880 1900 1920 1940 1960 1980 2000 2020 2040 2060 pH CONST CLE 0 50 100 150 200 250 300 1860 1880 1900 1920 1940 1960 1980 2000 2020 2040 2060 ANC (µ e q l -1) 150 180 210 240 270 300 1860 1880 1900 1920 1940 1960 1980 2000 2020 2040 2060 ANC (µ e q l -1) 0 30 60 90 120 150 1860 1880 1900 1920 1940 1960 1980 2000 2020 2040 2060 SO 4 = ( µeq l -1) 0 20 40 60 80 100 120 140 160 1860 1880 1900 1920 1940 1960 1980 2000 2020 2040 2060 SO 4 = ( µeq l -1) 0 40 80 120 160 200 1860 1880 1900 1920 1940 1960 1980 2000 2020 2040 2060 NO 3 - ( µeq l -1) 0 10 20 30 40 50 60 70 1860 1880 1900 1920 1940 1960 1980 2000 2020 2040 2060 NO 3 - ( µeq l -1)
Fig. 3. Hindcast (18602000) and forecast (20002036) simulation for some variables in River Pellino (left) and River Cannobino (right)
5.0 5.5 6.0 6.5 7.0 7.5 8.0 8.5 5.0 5.5 6.0 6.5 7.0 7.5 8.0 8.5 2000 2016 CONST CLE pH 5.0 5.5 6.0 6.5 7.0 5.0 5.5 6.0 6.5 7.0 2000 2016 pH
Lakes with alkalinity < 50 µeq l-1
-50 50 150 250 350 450 550 -50 50 150 250 350 450 550 2000 2016 CONST CLE ANC (µeq l-1) -10 0 10 20 30 40 -10 0 10 20 30 40 2000 2016 ANC (µeq l-1)
Lakes with alkalinity < 50 µeq l-1
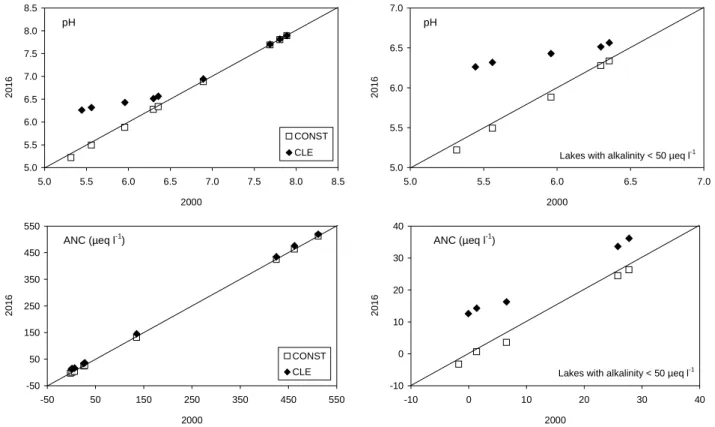
Fig. 5. Comparison between pH and alkalinity values in alpine lakes in 2000 and in 2016 as predicted by MAGIC under the CONST and CLE
scenarios. In the plots on the right only acid-sensitive lakes (alkalinity below 50 µeq l1) are considered.
4.0 4.5 5.0 5.5 6.0 6.5 7.0 1860 1880 1900 1920 1940 1960 1980 2000 2020 2040 2060 pH CONST CLE
Lake Paione Superiore
-10 0 10 20 30 40 50 60 1860 1880 1900 1920 1940 1960 1980 2000 2020 2040 2060 A N C ( µ eq l -1)
Fig. 4. Hindcast (18602000) and forecast (20002036) simulation for pH and ANC in LPS. The two lines indicate the years 2016 and 2036.
phycean scales and pigment ratios (Guilizzoni et al., 1996). These different techniques gave comparable results in terms of pH trend but differed slightly in the inferred pH values: diatom inferred pH was systematically lower than pH reconstructed with the other techniques. The results of this study indicated a recent acidification of the lake, with the starting date around the middle of the 20th century, somewhat later than indicated by the model reconstruction.
The MAGIC results fit well with the carbonaceous particle profiles for LPS, showing the start of the particle record at the beginning of the 20th century and a rapid increase in concentration from about 195060. The authors stated also a slight increase in lake productivity since the 1950s, probably related both to increased atmospheric N load and increased weathering of siliceous rocks. They also found a marked increase in N concentration in the most recent
sediments (and consequently a decrease of the C:N ratio) which could be related to the atmospheric N load (Guilizzoni
et al., 1996). These findings agree with the positive trend
of NO3 concentrations in the lake water simulated by MAGIC (Fig. 4), mainly due to the sharp increase of N deposition since the 1920s. The model also predicted a decrease of the C:N ratio in the soil organic pool, as a consequence of the progressive accumulation of N in the soil of the catchment.
In terms of recovery from acidification, under the CLE scenario, surface water quality is predicted to continue to improve at this site resulting in increasing pH and ANC levels in 20102016 compared to those modelled in the middle of the 20th century (Fig. 4). This positive trend is mainly attributable to the reduction of SO4 concentration which occurred in the last decade and is forecast to continue in the next few years: from the present value (3032 µeq l1) SO4 should decrease to about 15 µeq l1 by 2020.
SO4 deposition is not the only factor driving chemical recovery; once again N deposition will have a prominent role in the future. In LPS a slight increase of NO3 concentration has been detected in recent years. Assuming that N deposition has remained constant, it can be hypothesised that the soil in this catchment is approaching N saturation. The model was calibrated under this hypothesis, in such a way as to simulate the initial stage of N saturation. The model simulates a sharp increase of NO3 concentration under the CONST scenario, but even in the best case scenario, NO3 will start to increase in 2015. In the former case the lake will re-acidify: ANC values that are presently around 5 µeq l1 will be negative in 2040. Under the CLE scenario the model simulates a recovery until 2016, after which NO3 concentrations increase in lake water causing pH and ANC to stabilise or slightly decrease (Fig. 4). A concentration of 20 µeq l1 for ANC is commonly regarded as a critical limit for fish in alpine lakes (Henriksen
et al., 1990; Mills and Schindler, 1986). The outputs of the
model clearly show how the present and future reductions of SO4 deposition alone are not enough to produce a major chemical recovery in LPS. Sharp reductions of N deposition are required to avoid the steep increase of NO3 concentrations in lake water and to reach a satisfactory recovery of pH and alkalinity.
The CONST and CLE scenarios were applied to a group of nine alpine lakes to simulate their chemical characteristics in response to changes in atmospheric deposition. As explained above, the reliability of model outputs for these lakes is greatly reduced by the lack of a continuous series of chemical data, as well by the limited information available on the characteristics of soil and catchment. For this reason the forecast was applied to detect the chemical response of
these lakes to the different scenarios up to 2016 and not beyond (Fig. 5).
As might be expected, under the CONST scenario no further acidification, nor recovery, is predicted to occur in the lakes. pH and alkalinity values will remain constant in the next decade, reflecting the stable concentrations of the major acidifying compounds. Under the CLE scenario, an increase of both pH and alkalinity is predicted, particularly evident in the most acid-sensitive lakes (Fig. 5). As an example, in the acidic lakes Grande and Sfondato, pH will increase from the present values of 5.45.6 to 6.26.3 in 2010. In the same lakes ANC, which is presently negative or close to zero, will increase to about 10 µeq l1.
Of the selected lakes, four out of ten are characterised by high buffer capacity (alkalinity values between 150 and 500 µeq l1). For these lakes the effects of future scenarios as regards acidification will be negligible in all cases (Fig. 5). On the other hand these sites might prove to be sensitive towards other stress factors, mainly related to climate change (Rogora et al., 2002).
The possible impact of climate warming on alpine lakes has already been discussed. At present, this effect cannot be taken into account in the model simulation; nevertheless, it will act in conjunction with other driving forces such as atmospheric input to determine the chemical variations in alpine lakes in the future.
Conclusions
As SO4 deposition and SO4 concentrations in acidified surface waters continue to decline, the role of NO3 in the acidification of soils and surface waters will become more and more important. The quantification of processes governing N retention and loss in semi-natural terrestrial ecosystems is thus a scientific challenge of increasing importance. Process-oriented acidification models such as MAGIC, if correctly calibrated and implemented, can give a reliable prediction of the future response of surface waters to changes in atmospheric deposition (Cosby et al., 2001). The reliability of MAGIC has been documented by several tests of the model using data from long-term monitoring programs (Wright et al., 1994; Jenkins and Cullen, 2001), experimental manipulations (Wright et al., 1998) and paleolimnological reconstructions (Wright et al., 1986). Measured data, particularly long-term data series, such as those considered here, proved to be invaluable for a robust calibration.
The simulations performed with MAGIC for some rivers and alpine lakes in northern Italy clearly demonstrate the benefits of achieving the emission reductions in both S and N agreed under the Gothenburg Protocol. It is clear that
current levels of S and N emissions, while showing a substantial decline from their peak levels in the 1980s, must be reduced even more to protect freshwaters from further acidification. Uncertainty over the future retention of N remains, however; decreasing catchment retention could lead to NO3 becoming the dominant anion and potentially causing further acidification in the longer term.
The results presented here are in agreement with those obtained at several European sites, which have demonstrated that reductions in N deposition are likely to become increasingly important in the future (Jenkins and Cullen, 2001; Jenkins et al., 1996). This is of particular importance at sites where high NO3 concentrations in surface waters are already observed and where the NO3 contribution to the total anion load is significant, as is the case with Italian sites. The degree to which recovery can be achieved by reducing either S or N beyond the agreed requirements of the Gothenburg Protocol, is site specific and will depend on the current deposition fluxes of S and N, the accumulated historical S and N fluxes and the current status of N saturation as reflected in the level of NO3 concentration in surface water (Jenkins and Cullen, 2001).
The results emerging from this first modelling exercise on the Italian sites must be interpreted in the light of existing uncertainties regarding input data, especially for alpine lakes. Since the MAGIC model is applied at the catchment scale, many parameters are aggregated and generalisations made regarding complex processes that determine the chemistry of surface waters and its change in time. The results have clearly shown how factors other than atmospheric deposition affect the long-term changes in surface water chemistry at the study sites. Alpine lakes in particular have proved to be highly sensitive to climate change, but dynamic models such as MAGIC are presently unable to incorporate and represent climate change and its impacts on surface water chemistry. To find a way to simulate the effects of climate warming and to predict surface water chemistry (e.g. solute weathering in relation to increasing temperature) could be one of the next challenges in the development of dynamic models. Nevertheless, this study, like others performed at a European and international level (e.g. Cosby et al., 1986; Wright et al., 1994, 1998; Jenkins
et al., 1997; Jenkins and Cullen, 2001) has clearly
demonstrated the advantage of using dynamic models in the assessment of emission reduction strategies rather than steady state models or critical load calculations.
Despite the predicted recovery of surface water chemistry following the emission reductions implemented under the Gothenburg Protocol, the prospects for biological recovery remain uncertain. It is likely that there will be a time lag between chemical and biological recovery as a result of
recolonisation, but the biota is affected not so much by the mean chemical characteristics of surface water as by acidic episodes in river tributaries. In the future the frequency of these episodes, as of other extreme events such as the deposition of alkalinity related to Saharan dust, will be of increasing importance for biological recovery in lakes and streams.
As ecosystems respond to changes in acid deposition, the effects of global change will assume increasing importance. The critical load of N to terrestrial and aquatic ecosystems may depend on the climate regime to which they are subject. Concurrent long-term changes in environmental driving variables should be taken into account in the ongoing negotiations to reduce N emissions in the future decades.
Acknowledgments
This study was partially funded by the EU projects RECOVER:2010 (Project No. EVK1-CT-1999-00018) and by the Joint Commission for the Protection of Water on the border between Italy and Switzerland (Commissione
Internazionale per la Protezione delle Acque Italo-Svizzere).
Soil data for the area of Centovalli (Canton Ticino, CH) were kindly provided by the Swiss Agency for the Environment, Forests and Landscape (SAEFL).
References
Alcamo, J., Shaw, R. and Hordijk, L. (Eds.), 1990. The RAINS
model of Acidification. Kluwer, Dordrecht, The Netherlands.
Boggero, A., Belfanti, S., Brizzio, M.C., Calderoni, A. and Mosello, R., 1996. Trends in the chemistry of surface water in north-western Italy. IV. Nitrogen in subalpine rivers Pellino, Pellesino, Pescone and Cannobino (Lago Maggiore watershed).
Mem. Ist. Ital. Idrobiol., 54, 143160.
Cosby, B.J., Hornberger, G.M., Galloway, J.N. and Wright, R.F., 1985a. Modelling the effects of acid deposition: Assessment of a lumped parameter model of soil water and streamwater chemistry. Water Resour. Res., 21, 5163.
Cosby, B.J., Hornberger, G.M., Galloway, J.N. and Wright, R.F., 1985b. Time scales of acidification: A quantitative model for estimating freshwater acidification. Environ. Sci. Technol., 19, 11441149.
Cosby, B.J., Hornberger, G.M., Wright, R.F. and Galloway, J.N., 1986. Modelling the effects of acid deposition: Control of long term sulphate dynamics by soil sulphate adsorption. Water
Resour. Res., 22, 12831291.
Cosby, B.J., Ferrier, R.C., Jenkins, A. and Wright, R.F., 2001. Modelling the effects of acid deposition - fifteen years of MAGIC: refinements, adjustments and inclusion of nitrogen dynamics. Hydrol. Earth Syst. Sci., 5, 499517.
Della Lucia, M., Marchetto, A., Mosello, R. and Tartari, G.A., 1996. Studies on a chemical gradient of atmospheric deposition from the Po valley to the Alps. Water. Air Soil Pollut., 87, 171 187.
Evans, C.D., Cullen, J.M., Alewell, C., Kopácek, J., Marchetto, A., Moldan, F., Prechtel, A., Rogora, M., Veselý, J. and Wright, R.F., 2001. Recovery from acidification in European surface waters. Hydrol. Earth Syst. Sci., 5, 283297.
Ferrier, R.C., Jenkins, A., Wright, R.F., Schöpp, W. and Barth, H., 2001. Assessment of recovery of European surface waters from acidification, 1970-2000: Introduction to the Special Issue.
Hydrol. Earth Syst. Sci., 5, 274282.
Guilizzoni, P., Marchetto, A., Lami, A., Cameron, N.G., Appleby, P.G., Rose, N.L., Schnell, Ø.A., Belis, C.A., Giorgis, A. and Guzzi, L., 1996. The environmental history of a mountain lake (Lago Paione Superiore, Central Alps, Italy) for the last c. 100 years: a multidisciplinary, paleolimnological study. J.
Paleolimnol., 15, 245264.
Henriksen, A., Kämäri, J., Posch, M., Lövblad, G., Fresenius, M. and Wilander, A., 1990. Critical loads to surface waters in Fennoscandia. Nordic Council of Ministers, Copenhagen.
Environ. Rep., 17, 43pp.
Jenkins, A. and Cullen, J., 2001. An assessment of the potential impact of the Gothenburg Protocol on surface water chemistry using the dynamic MAGIC model at acid sensitive sites in the UK. Hydrol. Earth Syst. Sci., 5, 529541.
Jenkins, A., Boorman, D. and Renshaw, M., 1996. The UK Acid Waters Monitoring Network: an assessment of chemistry data, 1988-93. Freshwater Biol., 36, 169178.
Jenkins, A., Ferrier, R.C. and Cosby, B.J., 1997. A dynamic model for assessing the impact of coupled sulphur and nitrogen deposition scenarios on surface water acidification. J. Hydrol.,
197, 111127.
Mills, K.H. and Schindler, D.W., 1986. Biological indicators of lake acidification. Water Air Soil Pollut., 30, 779789. Mitchell, M.J., Mayer, B., Bailey, S.W., Hornbeck, J.W., Alewell,
C., Driscoll, C.T. and Likens, G.E., 2001. Use of stable isotope ratios for evaluating sulphur sources and losses at the Hubbard Brook Experimental Forest. Proceedings of Acid Rain 2000, Japan. Water Air Soil Pollut., 130, 7586.
Mosello, R. and Marchetto, A., 1996. Chemistry of atmospheric wet deposition in Italy. Results from a five year study. Ambio,
25, 2125.
Mosello, R., Marchetto, A., Buggero, A., Brizzio, M.C., Tartari, G.A. and Rogora, M., 1999. Pluriannual evolution of the hydrochemistry of two alpine lakes (Lake Paione Inferiore and Lake Paione Superiore, Ossola Valley) in relation to atmospheric loads. J. Limnol., 58, 4349.
Mosello, R., Calderoni, A., Marchetto, A., Brizzio, M.C., Rogora, M., Passera, S. and Tartari, G.A., 2001. Nitrogen budget of Lago Maggiore: the relative importance of atmospheric deposition and catchment sources. J. Limnol., 60, 2740. Prechtel, A., Alewell, C., Armbruster, M., Bittersohl, J., Cullen,
J.M., Evans, C.D., Helliwell, R.C., Kopacek, J., Marchetto, A., Matzner, E., Messenburg, H., Moldan, F., Moritz, K., Vesely, J. and Wright, R.F., 2001. Response of sulphur dynamics in European catchments to decreasing sulphate deposition. Hydrol.
Earth Syst. Sci., 5, 273541.
Rogora, M., Marchetto, A. and Mosello, R., 2001. Trends in the chemistry of atmospheric deposition and surface waters in the Lago Maggiore watershed. Hydrol. Earth Syst. Sci., 5, 379 390.
Rogora, M., Mosello, R., Marchetto, A., Buggero, A. and Tartari, G.A., 2002. Long-term variations in the hydrochemistry of alpine lakes in the Ossola and Sesia Valleys (Central Alps) in relation to atmospheric input and climate change. Acta Biol.,
78, 5969.
UN-ECE, 1999. Protocol to the 1979 Convention on Long-range
Transboundary Air Pollution to abate acidification, eutrophication and ground-level ozone. United Nations,
Economic Commission for Europe, Geneva, Switzerland. Wright, R.F., Cosby, B.J., Hornberger, G.M. and Galloway, J.N.,
1986. Comparison of paleolimnological with MAGIC model reconstructions of surface water acidification. Water Air Soil
Pollut., 30, 367380.
Wright, R.F., Cosby, B.J., Ferrier, R.C., Jenkins, A., Bulger, A. and Harriman, R., 1994. Changes in acidification of lochs in Galloway, southwestern Scotland, 1979-1988: The MAGIC model used to evaluate the role of afforestation, calculate critical loads and predict fish status. J. Hydrol., 161, 257285. Wright, R.F., Emmett, B.A. and Jenkins, A., 1998. Acid deposition,
land-use change and global change: MAGIC7 model applied to Risdalsheia, Norway (RAIN and CLIMEX project) and Aber, UK (NITREX project). Hydrol. Earth Syst. Sci., 2, 385397. Wright, R.F., Alewell, C., Cullen, J.M., Evans, C.D., Marchetto,
A., Moldan, F., Prechtel, A. and Rogora, M., 2001. Trends in nitrogen deposition and leaching in acid sensitive streams in Europe. Hydrol. Earth Syst. Sci., 5, 299310.