HAL Id: hal-01331784
https://hal.archives-ouvertes.fr/hal-01331784
Submitted on 4 Jul 2020
HAL is a multi-disciplinary open access
archive for the deposit and dissemination of
sci-entific research documents, whether they are
pub-lished or not. The documents may come from
teaching and research institutions in France or
abroad, or from public or private research centers.
L’archive ouverte pluridisciplinaire HAL, est
destinée au dépôt et à la diffusion de documents
scientifiques de niveau recherche, publiés ou non,
émanant des établissements d’enseignement et de
recherche français ou étrangers, des laboratoires
publics ou privés.
Air-Density and Temperature Profiles
Stéphane Marchand, Philippe Keckhut, K. H. Fricke, U. Blum, H. Schets, S.
Pal, D. Wardle, V., Cuomo, G. Pappalardo, Alain Hauchecorne
To cite this version:
Stéphane Marchand, Philippe Keckhut, K. H. Fricke, U. Blum, H. Schets, et al.. Air-Density and
Temperature Profiles. ENVISAT Validation Workshop (ESA SP-531), ESA, Dec 2003, Frascati, Italy.
pp.32.1. �hal-01331784�
GOMOS VALIDATION
AIR-DENSITY AND TEMPERATURE PROFILES
S. Marchand1, P. Keckhut1, K.H. Fricke2, U. Blum2, H. Schets3, S. Pal4, D. Wardle5, V. Cuomo6 , G. Pappalardo6, A. Hauchecorne1
(1)
Service d’Aéronomie/IPSL, Verrières-le-Buisson, France, e-mail : [email protected],
(2)
Physikalisches Institut der Universität Bonn, Nussallee, Germany,
(3)
Royal Meteorological Institute of Belgium, Brussels, Belgium,
(4)
Science And Art In novation Inc., Ontario, Canada,
(5)
Meteorological Service of Canada, Ontario, Canada
(6)
Istituto di Metodologie per l'Analisi Ambientale, Potenza, Italy
ABSTRACT
Lidar system and radio-soundings were used to validate both air-density and low and high-resolution temperature profiles of the GOMOS instrument onboard ENVISAT-1 satellite. No bias greater than 7% was found for the air-density comparisons with lidar and there is a very strong global agreement. The conditions of the occultations have a large impact on the comparisons concerning the temperature profile. The “dark limb” measurement conditions show great agreement between 35 and 60 km with no bias greater than 5% whereas the “bright limb” measurement conditions show poor results. The High Resolution temperature shows a very interesting potential.
1. INTRODUCTION
With the limited and late availability of Envisat data, only four teams of the groundbased subgroup have begun to validate the GOMOS air-density and temperature products. The locations of the stations cover the North hemisphere from mid latitudes (40°N with radio-soundings in Italy) to high latitudes (68°N with Lidar in Norway). The instruments used in this validation are Lidars (at Toronto, Observatoire de Haute Provence and Esrange) and radio-soundings (at Uccle station in Belgium and Tito Scalo in Italy) (see the Tab. 1 for exhaustive comments).
The products which are validated here concerned ENVISAT level 2 files : GOM_NL__2P*. They were retrieved from the ACRI-ST server on request, and generated with GOPR_LV2_5.3.
Two temperature variables are available in the GOMOS level2 files:
• The first one is the (low-resolution) temperature (T) ; this temperature is determined from the air-density and it
is a composite of three independent sources :-
O2 concentration ;
Rayleigh scaterring ;
climatologic model ARLETTY (A. Hauchecorne SA/ACRI-ST) which is based on ancillary data from the
European meteorological model ECMWF and the atmospheric model MSIS.
• The second one is High-Resolution Temperature (HRTP) ; this product is retrieved from the scintillation
observed by the two GOMOS photometers.
TEAM PI INSTRUMENTS PRODUCTS
AOID 153 S. Pal Lidar (Toronto - Canada)
43.66°N ; 79.4°W
density, T AOID 222 K. H. Fricke lidar (Esrange - Sweden)
67.9°N ; 20.1°E
density, T, HRTP AOID 300 D. De Muer Radio -soundings (Uccle - Belgium)
50.8°N ; 4.35°E
T
AOID 360 P. Keckhut Lidar (OHP - France)
43.94°N ; 5.71°E
HRTP AOID 9083 V. Cuomo Radio -soundings (Tito Scalo – Italy) T
__________________________________________________________________________________________________________ Proc. of Envisat Validation Workshop, Frascati, Italy, 9 – 13 December 2002 (ESA SP-531, August 2003)
TEAM PI INSTRUMENTS PRODUCTS 40.36°N ; 15.44°E
Tab. 1 The AOID involved in the air-density and temperature validation. 2. AIR DENSITY
Two teams have been able to perform air-density comparisons : AOID 153 at Toronto with Dr. Pal and AOID 222 at Esrange with Dr. Fricke.
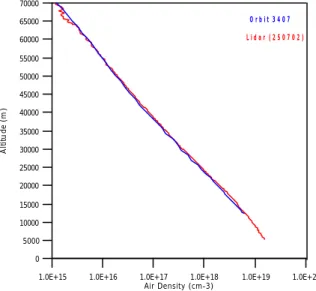
For the 25/07/2002 and 25/10/2002 at Toronto, the three GOMOS occultations (Fig. 1 and Fig. 2) shows a very good global agreement but there are still some fluctuations between the GOMOS profiles and the Lidar one's. Another site at higher latitude (Esrange, see Fig. 3) for the 15th of August with a distance between the GOMOS measurement and the Lidar position of about 184 km shows a similar result.
No significant deviations are reported according to the error bars - errors are the combined GOMOS and Lidar errors. A normalisation is done for both Lidar and GOMOS densities at the altitude of 35 km, that explain the perfect agreement between the two measurements at this altitude. At the top of the profiles the deviation is about 5%.
1.0E+15 1.0E+16 1.0E+17 1.0E+18 1.0E+19 1.0E+20 Air Density (cm-3) 0 5000 10000 15000 20000 25000 30000 35000 40000 45000 50000 55000 60000 65000 70000 Al tit ud e (m ) O r b i t 2 0 9 1 L i d a r ( 2 5 0 7 0 2 ) O r b i t 2 0 9 2
1.0E+15 1.0E+16 1.0E+17 1.0E+18 1.0E+19 1.0E+20 Air Density (cm-3) 0 5000 10000 15000 20000 25000 30000 35000 40000 45000 50000 55000 60000 65000 70000 A lti tu de ( m ) O r b i t 3 4 0 7 L i d a r ( 2 5 0 7 0 2 )
Fig. 1 density comparison for AOID 153 (star ID 18, M v=1.17, T=9700 K for orbits no. 2091 and no. 2092).
Fig. 2 density comparison for AOID 153 (star ID 84, Mv=2.40, T=4500 K for orbit no. 3407).
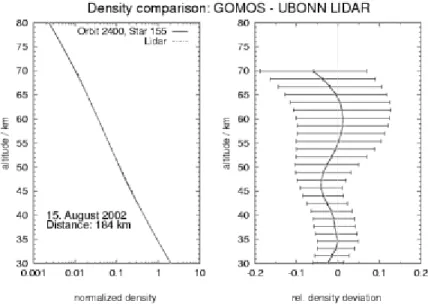
The statistical comparison performed over Esrange shows the profiles of the deviation of the differences between GOMOS and Lidar (Fig.4). These lidar data are, in contrast to those performed at Toronto, relative density profiles, which implies, that these data can not validate the absolute values, but the profile shape.
The results are summarized in histograms covering the altitudes from 30 to 70 km in altitude bands of 5 km width. 38 occultations and 18 Lidar measurements are used for these results from 18/07/2002 to 23/08/2002. For each histogram, the altitude range, the number of data points and the mean value of the deviations are given. The number of points varies because of the changing altitude grid in each GOMOS profiles and because the Lidar profile reach different maximum altitudes.
As mentioned previously, the very good agreement and small width of the histograms in the two lowest altitude range (30-35 km and 35-40 km) is artificial because of the normalization at 35 km height. Due to the large error stated for the GOMOS data in the PDS files, the general agreement can include deviations among the GOMOS and Lidar profiles up to 7%. At the higher altitudes, GOMOS density data oscillate about the Lidar data with amplitude of up to 2.6% near the stratopause. The largest random deviations among the GOMOS and Lidar data reach up to 7%.
Fig. 3 density comparison for AOID 222 (star ID 155, Mv=2.90, T=6600 K for orbit no. 2400).
3. TEMPERATURE
The five teams have been able to perform preliminary temperature validation: AOID 153 leaded by Dr. Pal, AOID 222 leaded by DR. Fricke, AOID 300 leaded by Dr. De Muer and AOID 360 leaded by Dr. Keckhut and AOID 9083 with DR. Cuomo . 2 0 0 2 1 0 2 2 0 2 3 0 2 4 0 2 5 0 2 6 0 2 7 0 2 8 0 2 9 0 3 0 0 T e m p e r a t u r e ( K ) 0 5 0 0 0 1 0 0 0 0 1 5 0 0 0 2 0 0 0 0 2 5 0 0 0 3 0 0 0 0 3 5 0 0 0 4 0 0 0 0 4 5 0 0 0 5 0 0 0 0 5 5 0 0 0 6 0 0 0 0 Al ti tu d e (m ) Orb 2091 Orb 2092 Lidar (250702)
Lidar Tropopause Height ( 14070m , 213.3K)
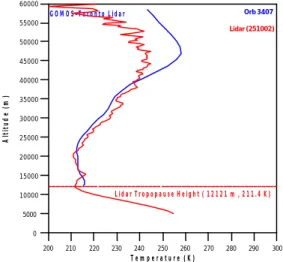
Tropopause Height (GOMOS: 17357m , 221.1K) Tropopause Height (GOMOS: 17250m , 216.9K) GOMOS-Toronto Lidar 200 210 220 230 240 250 260 270 280 290 300 T e m p e r a t u r e ( K ) 0 5000 10000 15000 20000 25000 30000 35000 40000 45000 50000 55000 60000 A lt it ud e (m ) Orb 3407 Lidar (251002)
Lidar Tropopause Height ( 12121 m , 211.4 K)
GOMOS-Toronto Lidar
Fig. 5 temperature comparison for AOID 153 (star ID, 18 Mv=1.17, T=9700 K for orbits no. 2091 and no. 2092).
Fig. 6 temperature comparison for AOID 153 (star ID 84, Mv=2.40, T=4500 K for orbit no. 3407).
For the first two occultations at Toronto in July (Fig.5), we can note a good general agreement between the low resolution temperature and the Lidar measurement. However, there is a problem concerning the calculation of the tropopause altitude. It seems to be not an altitude s hift problem because the shapes of the profiles at the top altitude are in agreement. These two occultations are in dark limb conditions. For the third occultation (Fig. 6) at Toronto in October, we can see a large difference between the profiles and again a deviation for the tropopause altitude. But this occultation is in bright limb condition so the data are certainly noisy and the model is probably the most important contribution in the retrievals data. In this period, the planetary waves activity start to increase and hence induce a large daily and inter-annual variability. The differences here are the same than the differences between Lidar and model observed during this period. So it can suggest that the Lidar measurement is valid and the GOMOS product is mainly composed by model inputs.
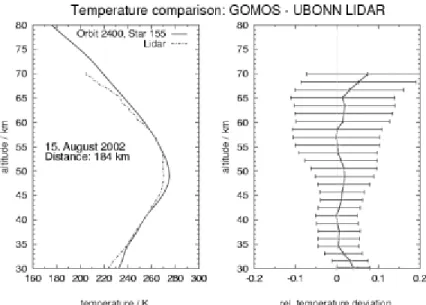
Over Esrange in August for low-resolution temperatures (Fig. 7), we can split the altitude range in four domains:
• Under 35 km :
The 10% bias may be caused by stratospheric background aerosol at higher altitude than usual. So the bias here will be incriminated to the Lidar measurement.
• Between 35 km and 40 km
There’s no bias.
• Between 40 km and 60 km
There’s no significant bias and mean bias are smaller than 5% in this domain.
• Beyond 60 km
The 10% bias cannot be solely due to initialisation of the Lidar as lidar data smaller than 5% are considered. While some other instrumental causes can be suggested such as the extraction of the noise due to background emission, the GOMOS statistical errors are approximately twice as large.
Fig. 7 temperature comparison for AOID 222 (star ID 155, Mv=2.90, T=6600 K for orbit no. 2400).
On Fig.8 are represented the relative deviations for 18 Lidar measurements and 38 GOMOS occultations in histograms covering the altitudes from 30 to 70 km in altitude bands of 5 km width. We can notice here, on a statistical basis, a similar vertical behaviour than observed on the case shown in Fig.7 with the largest deviations below 35 km and above 60 km and a good agreement with no bias larger than 5% between these two altitudes.
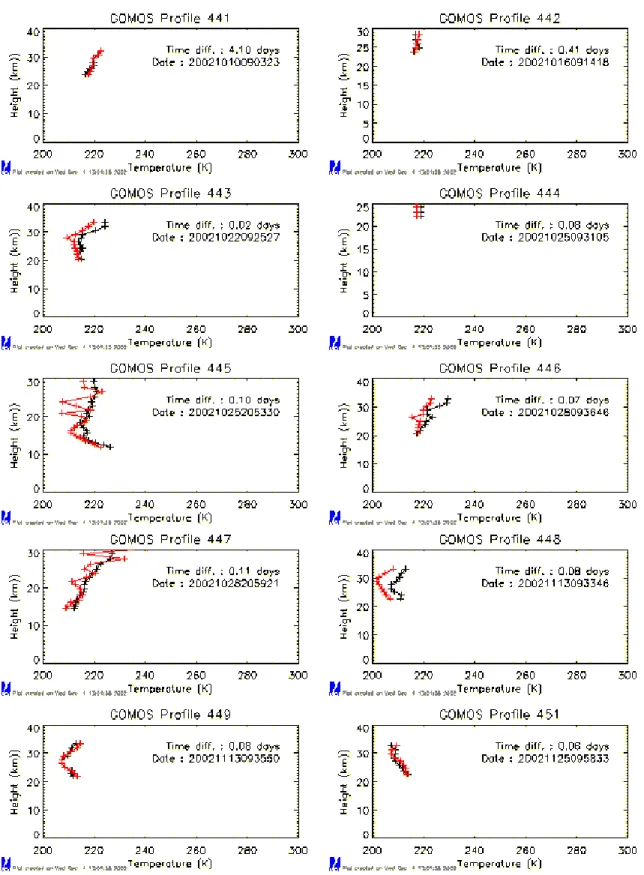
At the Uccle site (Belgium) we can notice in Fig.10 a good agreement for a few cases but we can also notice some anomalous fluctuations for others. Time delay and then dark or bright limb conditions don’t seem to be influent in these cases. On Fig.11 is represented the mean relative differences (ptu-GOMOS) between 15 km and 35 km altitude range for 10 occultations and 9 radio-soundings for the period 10/10/2002 to 25/11/2002. The bias for this altitude domain is about 0.7%. The deviation can be as large as 1.7% but the mean deviation from the bias is about 0.3%.%.This agreement is again verified at the Tito Scalo station from 20 up to 35 km of height range as we can see an example on Fig. 9 .
All these results seem to be very good but we should point out the fact that in this low altitude range, the GOMOS data are probably model data. These excellent bias and deviation could be probably due to a comparison between the radio -sounding and the model which is probably not fully independent to the radio --soundings
0 10 20 30 40 50 60 70 200 250 300 19 September 2002 Lidar Station 40.60N 15.73E - 820 m a.s.l. GOMOS 42.96N-14.12E
GOMOS (10:05 UTC) RADIOSONDE (10:17 UTC)
Temperature (K)
Height a.s.l. (km)
Fig. 9 temperature comparison for AOID 9083.
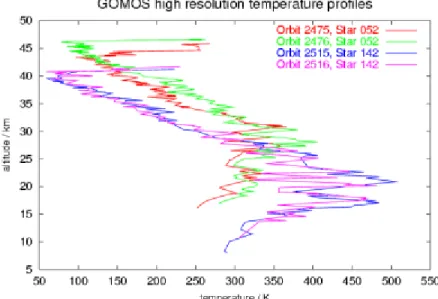
On Fig.12 are represented four profiles for two stars occultations for High-Resolution Temperature Profile (HRTP) at Esrange performed some successive orbits. It is clear from the range of temperature values that the GOMOS HRTP are incompatible with the range of temperatures encountered in the stratosphere. In this case the occultations were in bright limb conditions and may explained why the retrieval algorithm has failed. We suggest that an internal consistency check should be implemented as part of the GOMOS data processing.
Fig. 12 HRTP for AOID 222 (star ID 52, Mv=2.04, T=4500 K for orbits no. 2475 and 2476) and (star ID 142, Mv=2.85, T=8900 K for orbits no. 2515 and 2516).
For another site at lower latitude (OHP) and for the 25th August, we can see on Fig.13 that the small-scale altitude
structures are well represented. In this case the measurement is done in dark limb conditions and the process produce very good results. All the Lidar, the ECMWF and HRTP profile are in good agreement. Here the time delay between the occultation and the mean time of the LIDAR measurement is about three hours and the distance between mean tangent position and OHP is about 300 km. This single example shows that HRTP has a great potential to retrieve temperature profile as to detect the small-scale structures. We will have to smooth these retrievals to have information concerning the bias (if any) between HRTP and Lidar measurements however we will experienced some difficulties to validate the finest structures of the GOMOS profile, which will only be possible with very close collocations in time and in space registration.
Fig. 13 HRTP for AOID 360 (star ID 81, Mv=2.36, T=28000 K). 4. CONCLUSIONS
At this time, the first conclusions of the air density and temperature are:
• The difference of retrieval performance between dark and bright limb conditions are clearly observed ;
• No bias larger than 10% are reported for the low-resolution temperature and bias under 1% in the altitude range
[15-30] km have been calculated. The first bias estimated with lidar above 30 km seems to be very small but a large dispersion is observed. The climatologic values includes in the GOMOS retrieval pobably contributes to these results for a large part. The knowledge of the model contribution in the low-resolution temperature is missing. We suggest to ESA to add this information in the level 2 products and to discriminate the share of each contribution to the retrievals ;
• HRTP appears to have a great potential. An example shows a very good agreement with the other data sources
with this GOMOS products but it clearly appears that very short time and distance collocations will be required to have a real possibility to make some good validation for the finest altitude scale structures ;
• Validation must continue and we must collect more collocations to produce more statistical comparisons for a
better understanding of these products.
ACKNOWLEDGEMENTS
The entire staff of Esrange is acknowledged for providing the largest contribution to the GOMOS temperature validation data. Operations at Toronto were coordinated by Hans Fast (MSC) and the measurements were carried out by Richard Berman ( Spectral Applied Research), Richard L. Mittermeier (MSC) and Jonathan Davies ( MSC). The OHP and UCCLE Staffs are also acknowledged. The contribution from the Bonn University was supported by the DLR-Raumfahrt. The Toronto Lidar measurement program is supported by the Meteorological Service of Canada (MSC) and the financial support for the ACVT activity is provided by the Canadian Space Agency. The Service d’Aéronomie in France was supported by the French Space Agency CNES.
The OHP and Toronto lidar profiles used in this publication were obtained as part of the Network for the Detection of Stratospheric Change (NDSC) and are publicly available after their final validation (see http://www.ndsc.ncep.noaa.gov).