HAL Id: hal-00069462
https://hal-insu.archives-ouvertes.fr/hal-00069462
Submitted on 13 Nov 2006
HAL is a multi-disciplinary open access archive for the deposit and dissemination of sci-entific research documents, whether they are pub-lished or not. The documents may come from teaching and research institutions in France or abroad, or from public or private research centers.
L’archive ouverte pluridisciplinaire HAL, est destinée au dépôt et à la diffusion de documents scientifiques de niveau recherche, publiés ou non, émanant des établissements d’enseignement et de recherche français ou étrangers, des laboratoires publics ou privés.
Characterization, water transfer properties and
deterioration in tuffeau : building material in the Loire
valley-France
Kévin Beck, Muzahim Al-Mukhtar, Olivier Rozenbaum, Michel Rautureau
To cite this version:
Kévin Beck, Muzahim Al-Mukhtar, Olivier Rozenbaum, Michel Rautureau. Characterization, water transfer properties and deterioration in tuffeau : building material in the Loire valley-France. Building and Environment, Elsevier, 2003, 38, pp.1151-1162. �10.1016/S0360-1323(03)00074-X�. �hal-00069462�
Characterization, water transfer properties and
deterioration in tuffeau: building material in the Loire
valley—France
K. Becka-b, M. Al-Mukhtara, O. Rozenbaumb and M. Rautureaub
a Centre de Recherche sur la Matière Divisée, Université d'Orléans, CNRS-CRMD, 1B rue de
la Férollerie 45071, Orléans Cedex 2, France
b Institut des Sciences de la Terre d'Orléans (UMR6113), CNRS - Université d'Orléans, , 1A
rue de la Férollerie, 45071, Orléans Cedex 2, France
Abstract
Water plays a fundamental role in the phenomena of stone deterioration. A highly porous limestone called tuffeau used in the Loire castles in France is characterized. Several techniques for pore space investigation and anisotropy determination are presented and their range of application is discussed. Water retention and transfer properties related to the pore space characteristics are determined as a function of relative humidity. The experimental set-up and tests presented have been chosen for their simple execution and interesting data produced for both fresh and deteriorated stone.
Author Keywords: Tuffeau; Multi-scale characterization; Porosity; Imbibition and diffusion
1. Introduction
It is well known that porous building material absorbs and desorbs water as a function of weather conditions (temperature, relative humidity and rainwater). Furthermore, the fluxes of water within the stone affect the behaviour of the material and can be responsible for its deterioration. A typical stone was chosen for this study: the tuffeau, which is a yellowish-white porous sedimentary limestone, plentiful in the Loire Valley. The tuffeau is a siliceous limestone formed with elements resulting from the erosion of other rocks (central and armoricain massifs for the sediments of the Paris Basin) by marine sedimentation 90 million years ago. The word “tuffeau” comes from the Latin tofus meaning spongy stone. Etymology indicates clearly the main characteristic of this building material: a high permeability linked to its high porosity. Meanwhile, it is necessary to note the important variability of the different mineral proportions (for example, calcite content can vary from 40% to 70%) and physical properties (porosity 30–50%), giving evidence of the great diversity of the tuffeau family [1]. Commonly, tuffeau, which is an easily workable building material because of its high porosity, is the main building stone of the Loire castles, as well as most of the old houses of this region. Nowadays, tuffeau is mainly used for the restoration of ancient monuments.
Tuffeau seems to be very sensitive to atmospheric conditions and to water flow. Due to wetting–drying cycles, physical and chemical reactions occur in the tuffeau affecting notably the porosity within the first centimetres under the surface of the stone [2]. These cycles induce dissolutions, recrystallizations and lead to the deterioration of this stone.
This limestone is characterized by a sedimentary origin linked to its multi-phase aspect and to its pore texture. In this study, a multi-scale characterization is undertaken to study transfer properties and their effects on the deterioration processes. The characterization concerns: • the mineralogical composition, morphology and the textural arrangement of particles (pore size distribution and volume);
• the water retention curve and the different types of water (free, capillary and adsorbed water) in the stone; and
• the water flow within the stone (convection and diffusion transfer) by measuring water and vapour permeability, imbibition coefficients (absorption), and diffusion coefficient.
Different techniques used are presented and their range of application is discussed. Results are analysed in order to understand the macroscopic observations on the building stone and to identify relations between pore network and water transfer parameters.
2. Characterization of the building material
For this study, a fresh stone is used. Indeed, tests are carried out on samples of tuffeau obtained from an underground quarry at 5 m depth (Saint-Cyr-en-Bourg in Maine-et-Loire, France). The tuffeau, extracted from its geological environment, possessed a natural water content of 21.4% determined in laboratory (after 24 h at 105°C), and the greenish-grey stone once extracted becomes white-yellowish once dry.
2.1. Mineralogical characterization: X-Ray diffraction (XRD) and thermogravimetric analysis (TGA)
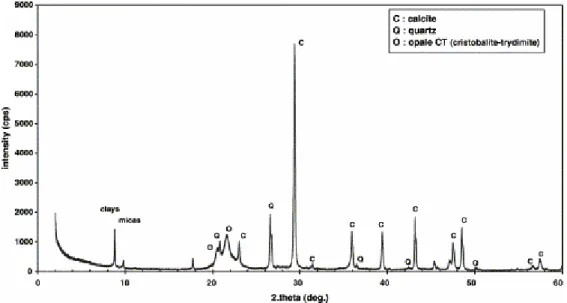
The qualitative mineralogical composition of the stone was determined using X-ray diffraction patterns recorded with a Rigaku-Kevex diffractometer (Cu-Kα). The major minerals (Fig. 1) are calcite CaCO3, silica SiO2 (in the form of opal cristobalite-tridymite and
quartz) and some minority minerals like clays or micas (glauconite) with a peak about 8.82° (corresponding to a lattice spacing of 10 Å, which is characteristic of phyllosilicates).
The calcite proportion in the tested tuffeau is quantified using TGA. In this test, the mass loss of a given sample is recorded under controlled temperature ramp. The apparatus used is a Setaram TG-DTG 92-16 electro-balance operating within the 20–1000°C range, with a heating rate of 100°C/h and under argon atmosphere. Indeed, the mass loss around 700°C results from calcite CaCO3 decomposition into lime CaO. For various tested samples, the
weight ratio of CaCO3 is 49.6±1.8%.
2.2. Determination of the porosity
2.2.1. Porosity determined from density measurements
Bulk density at dry state is determined either by measuring precisely sample dimensions and sample weight, after drying in an oven at 105°C during 24 h, or by hydrostatic weighing method which is based on the Archimedes’ principle on a sample saturated and submerged in a wetting fluid: water. In this test, samples are dried in an oven at 105°C until constant weight (Ms). Then, the samples are saturated by imbibition in a cell under vacuum during 24 h, by
complete immersion during a day in outgassed water. Then a hydrostatic weighing of the saturated samples immersed in water (Mhyd) and a weighing in air of the saturated samples
wiped with a wet rag (Msat) are carried out. Bulk dry density can then be calculated from
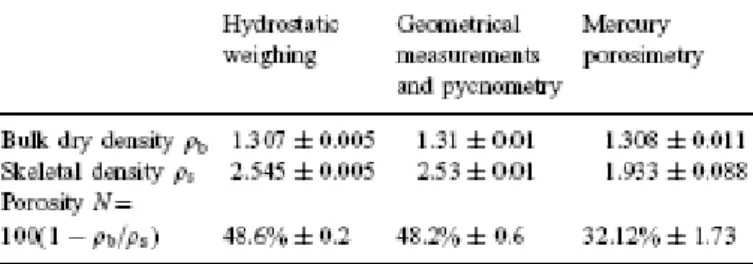
Results show that bulk dry density values are practically the same (Table 1). It is obvious that the first method is simpler if the dimensions can be measured easily (simple geometrical forms), but in the hydrostatic weighing method, the sample can have any shape.
Table 1. Densities and porosities obtained by a range of methods
Skeletal density (solid phases) is deduced directly from hydrostatic weighing by
Helium pycnometry (using a pycnometer Accupic 1330) is another method which is based on the release of a volume of helium from a cell with pressure P1 containing the porous sample
towards a second cell first filled with helium but with a lower pressure P2<P1, vacuum being
contained in the two cells, before and after the opening of the lockgate connecting them, allows us to have access to the skeletal volume, and deduced the skeletal density ρs.
Values obtained from these two methods are similar. Nevertheless, for hydrostatic weighing, the imbibition under vacuum is necessary so that all the pore space is accessible to water. Indeed, in hydrostatic weighing at atmospheric pressure test, trapped air bubbles limiting the filling up lead to underestimated results in the order of 15%.
Porosity can be then calculated using both densities from
Values are about 48%, which indicates that this tuffeau is a highly porous and particularly light building material.
2.2.2. Porosity and pores size distribution
To identify the pore space distribution and pore volume of the material, two complementary tests were carried out: BET [3] and mercury porosimetry. The BET method based on the mechanisms of physical adsorption/desorption and capillary condensation of nitrogen allows us to determine pore diameters ranging from 1 to 100 nm as well as the specific surface SBET.
Nitrogen adsorption at −196°C was performed using a Sorptomatic Carlo Erba 1900 apparatus. Samples of about 1 cm3 were dried and outgassed at 140°C during 16 h before testing. The Horvath-Kawazoe method [4] was used to determine the pore sizes and distribution. The mercury intrusion method was performed by applying pressure (up to 210 MPa) and monitoring continuously the intruded volume of mercury in the pores of the tested sample. The radii of pores were estimated using Young–Laplace equation. Theoretically, pores with a diameter between 350 μm and 4 nm can be investigated with the apparatus used: a Poresizer 9320 porosimeter. Samples of about 1 cm3 were dried at 105°C during 24 h before testing. The principle of the method is that the intruded volume of mercury at the equilibrium is equal to the pore volume investigated under the applied pressure. Pores are considered to be in the form of capillary tubes (cylinders), so from Laplace's relation the pore radius investigated (rc) by the applied pressure on mercury (P) can be easily calculated from
where σ is the superficial tension (σ=485×10−3 N/m) and θ the angle of capillary interaction solid–fluid in the pore (θ=130°).
The mercury intrusion test also gives values of bulk and skeletal densities (Table 1). It gives a correct value of the bulk density but underestimates the skeletal density revealing the limitation of this method. As shown in Table 1, the porosity determined by mercury porosimetry (32%) is far from those obtained by the other methods (about 48%). The mercury cannot invade the smallest pores, i.e. this technique does not take into account all the pore volume and thus the measured porosity is lower than the real porosity. So, the data obtained are only representative of the macro- and meso-porosity. Fig. 2 illustrates the pore size
distribution in this range of porosity. There are few large pores (around 100 μm) and a distribution presenting a maximum around 10 μm.
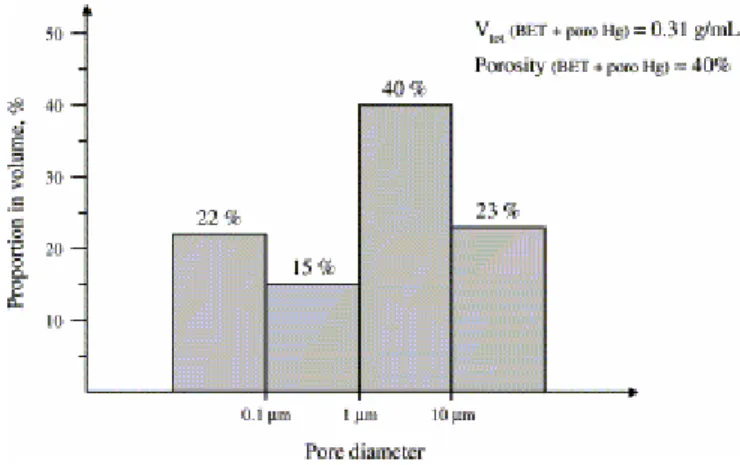
Fig. 2. Pore distribution of tuffeau from mercury porosimetry and BET method.
The microporous distribution given by the BET measurements from desorption branch (Fig. 2) and the preceding data demonstrate clearly the multi-scale nature of pore space of the tuffeau [5]. Results show that the tuffeau has an important porosity and a very wide range of pore sizes. The proportion of the different types of pores detected by BET and mercury porosimetry are presented in Fig. 3. As the micro-porosity is relatively important (about 22%), the differences in the porosity values between the porosimetry measurement and the previous techniques are explained.
Fig. 3. Pore space proportion of tuffeau from mercury porosimetry and BET method.
The difference of one order of magnitude for the specific surfaces determined by mercury porosimetry (1.9 m2/g) and BET (18 m2/g) can also be explained by the micro-porosity not assessed during mercury porosimetry tests.
One of the drawbacks of the mercury porosimetry technique is the shape hypothesis. A model of cylindrical pores is chosen in order to relate, by Laplace's equation (4), the applied pressure to the diameter of the pores. Unfortunately, as shown in the next part with SEM images, not all the pores are cylindrical: the term diameter in mercury porosimetry is then very relative as it characterizes only the entry diameter for access to pores. Moreover, a drawback should be mentioned: the “ink-bottle” effect. This phenomenon has been described by many authors [6 and 7]. The result of this effect is to reduce the volume of the large pores for the benefit of
small pores. Then the porosity distribution is modified and shifted to the small pores. Also, BET theory assumes that the surface of a particle is covered by a multilayer of multimolecular thickness of adsorbent due to vapour tension. The major assumption of this theory is that all adsorption sites are energetically identical, and there is no lateral interaction between adjacent molecules.
As a conclusion, all these techniques give useful information to characterize the porosity of porous media only if the experimenter has a good understanding of their limits and takes care about their use.
2.2.3. Texture viewing by scanning electron microscopy (SEM)
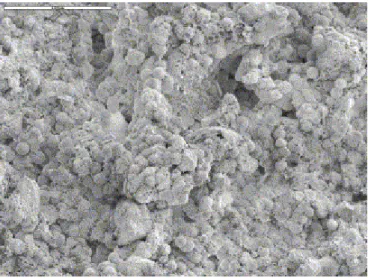
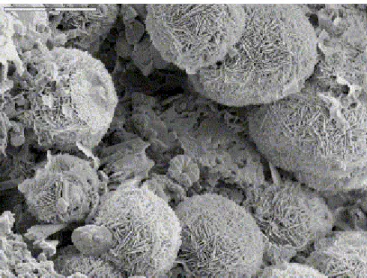
SEM images from a fresh stone illustrate the preceding discussion and reveal information about size, shape and arrangement of the grains and pores. Fig. 4 and Fig. 5 show the macro-porosity (pores larger than 1 μm) due to the arrangement of opal cristobalite-tridymite spherules (opal CT). These entities with a diameter around 10 μm create porosity in the same order (few μm up to 10 μm). The presence of some large particles (not shown here) as quartz, sparitic calcite and glauconite induce large pores (50–100 μm). A maritime fossil (coccolith) is shown in Fig. 5 and is an old trace of the stone's past. Even if this large pore represents just few percent of the total porosity, the macro-porosity represents nearly 60% of the total porosity (following the origin of the tuffeau). The meso-porosity is generally given in the 1 μm–100 nm range and is due to the arrangement of the micritic calcite (grains size varying from 0.1 to 2 μm) and to the morphology of the opal CT spherules. The micro-porosity (belonging in the 1–100 nm range) is due to the finest phases of the stone: clays, micritic calcite, colloids, etc., and represents near 20% of the total porosity.
Fig. 5. SEM photograph (scale: 10 μm) showing a pore generated by opal CT spherules with a coccolith (maritime fossil) in the centre of the image.
Thus, SEM is a perfect tool for the investigation of this kind of porous media but should be associated with other techniques to understand the images and to avoid any ambiguity. For example, optical microscopy for improving knowledge of certain size range pores (mm–μm) and transmission electron microscopy for the investigation of micro-fabric (nm–μm) can bring better understanding of present minerals, texture, etc.
3. Deterioration and water transfer
3.1. Description of tuffeau deterioration phenomena
The colour change of building stone is a typical sign of deterioration. This visual effect represents in fact a complete change in the pore network, in the transfer properties and in the mineralogical composition of the stone. Numerous external factors interact and participate in the process of tuffeau deterioration. The environmental conditions (humidity, temperature and water action) around the construction are the most important factors.
Exfoliation in sheets (Fig. 6) is the main visible alteration of the tuffeau. An interpretation of this kind of tuffeau deterioration considers that the water transfer within this porous limestone induces the dissolution of the calcite CaCO3 followed by a surface recrystallization of gypsum
CaSO4·2H2O which seals the porous network creating then a patina [8]. Water flow (mainly
by diffusion) becomes very limited from the inside towards the surface. The direction of water flow changes and becomes mainly “parallel” to the surface. In the altered stone, three zones can be found [9]:
• The deep zone of the stone, intact where water flows in all directions.
• The surface hardened zone (patina), a few millimeters thick. Crystallization of salts (mainly gypsum) in the surface zone due to absorption-drying cycles induces changes in the surface porosity and reduces water penetration and water evaporation.
• The intermediate zone, underlying the patina, of some centimetres thick, having undergone partial dissolution and then loss of material causing the weakness of the stone.
Finally, cracks and exfoliation of the surface zone (sheets of few mm) can be observed on the building.
Fig. 6. Deterioration of tuffeau in sheets (Blois Castle, France).
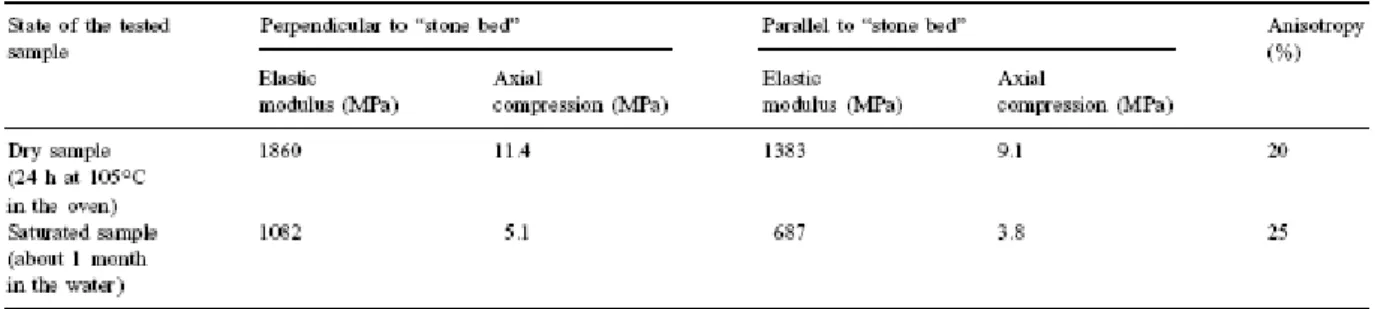
3.2. Influence of water content on the mechanical resistance of tuffeau Axial compression tests were carried out on cylindrical samples of tuffeau in two extreme water content states: completely dry or completely saturated with water. Samples of 40 mm in diameter and 80 mm height were tested. The loading rate was 0.05 mm/min.
Results presented in Table 2 are the average of three tests in each state. Tests show that this building material has an elastic behaviour over a wide range of strain. This is confirmed by tests of successive loading and unloading. Axial compression stress at rupture is about 10 MPa, which corresponds to a soft stone characteristic. This low strength is directly linked to the prevalent macro-porous area mainly due to opal CT spherules.
Table 2. Strength of tuffeau and the influence of water content and in relation to stone bedding
Results also show that the presence of water plays an important role in the building material strength. Between the dry state and the saturated state, the axial compressive strength decreases about 55%, which agrees with results published by West [10]. Moreover, these tests reveal clearly the anisotropy of the tuffeau (about 20%). For sedimentary rock, the knowledge of the stone bed direction (sedimentation action) is essential to the use of the stone: the loading should be applied in the perpendicular direction to the quarry bed.
3.3. Water transfer in the tuffeau
The mass transfer of fluids in a porous building material is mainly governed by two mechanisms which occur often simultaneously:
• in the vapour phase, diffusion and convection movements;
• in the liquid phase, capillary action, gravity and the result of external pressure gradients.
3.3.1. Water retention (adsorption–desorption) curve
Tuffeau samples previously dried in an oven at 105°C for 24 h were placed in desiccators, in atmospheres of different relative humidities maintained by saturated salt solutions. Samples were weighed at regular intervals. Elapsed time to reach equilibrium depends on the relative humidity: it needs about 10 weeks for a relative humidity of 98% and only a week for 12% of humidity. For each relative humidity the water content is acquired by measuring the sample weight at the end of the experiment. The suction equivalent to a relative humidity is obtained by applying the Kelvin's equation:
where Pc is the capillary pressure (kPa), Pw the water pressure (kPa), Pa the air pressure (kPa),
Pv(T) the vapour pressure (kPa), Pvs(T) the saturated vapour pressure (kPa), Mv the molar
mass of water=18×10−3 kgmol−1, and T the temperature (K), ρw the density of water (kgm−3),
and R the perfect gas constant=8.31 Jmol−1 K−1.
So, with relative humidity (RH) for a constant temperature of 20°C: Suction (MPa)=|Pc|=−135.022 Ln(RH).
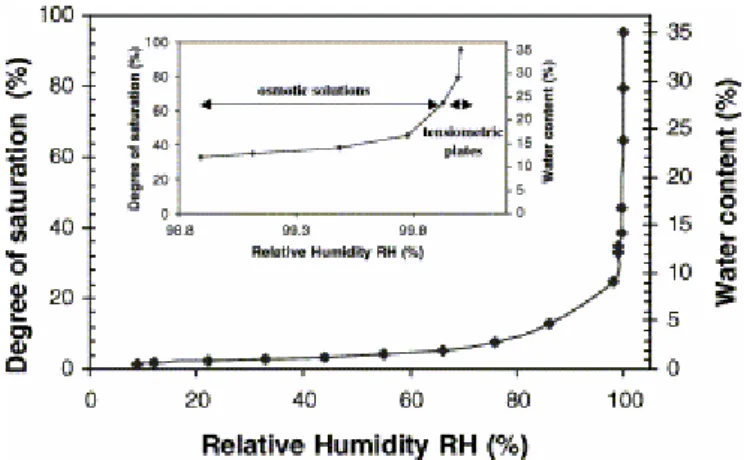
This technique is used to study the water retention curve in the range of suction 2700 kPa (corresponding to relative humidity 98%). For lower values of suction other traditional techniques are used [11]: osmotic solutions for suctions between 1500 and 100 kPa (imposed by the concentration of a polyethylene glycol macromolecules solution across a semi-permeable membrane) and tensiometric plates for suctions between 10 to 1 kPa (imposed by the height of a column of water in equilibrium with a saturated high air entry ceramic disk). The water retention curve obtained is presented, in Fig. 7 in terms of relative humidity and, in Fig. 8 in terms of suction. These figures show clearly that water adsorption increases as suction decreases for the tested material. The presence of a bend at a relative humidity about 98% is due to a change of behaviour in the phases of saturation. For high suctions (>2 MPa i.e. RH: 0–98%), water is retained by adsorption and by capillary forces in the finest pores. The degree of saturation Sr, which is defined as the ratio of the water volume to the volume of pore space, remains small and indicates that the water fills only a small part of porosity. A second phase takes place after RH=98% (which corresponds to Sr=25%) where capillary suctions become lower, the liquid water fill easily the bigger pores. That is why the degree of saturation increases so rapidly.
Fig. 7. Water retention curve versus relative humidity (RH) obtained for tuffeau.
Fig. 8. Water retention curve versus suction from tuffeau sample.
3.3.2. Water absorption by capillary action (imbibition)
Water absorbed by imbibition is capillary water. It is well known that the capillarity in a porous material is directly related to the pore network characteristics: pore sizes and pore shapes, but also the connectivity and the topology of the porous structure. When a dry porous solid is in contact with water, the non-wetting fluid (air) which filled pores is substituted by the wetting fluid (water) without applying any external pressure. This phenomenon of capillary imbibition is due to the preferential wetting of the solid. The lower surface of the sample is located in contact with water and one can measure the height of the capillary front, and the water mass uptake over time.
Theoretical capillary model is based on absorption by capillarity for a vertical cylindrical tube of limited height (allowing to neglect gravity): the pressure gradient allowing the drainage of the fluid results from the capillary pressure, governed by Laplace's equation:
Indeed, for the air–water system, the contact angle θ is considered as equal to zero. The flow of fluid in the steady laminar regime in a cylindrical tube is given by the Hagen–Poiseuille’ law:
where Q is the flow rate of water, h the capillary height, and η the water viscosity.
Using these two equations, one obtains the Washburn's equations [12] giving the capillary height (h) and the mass uptake (dm) per surface unit (S) during the time (t):
Both imbibition coefficients can be linked to porosity accessible to water during imbibition:
This imbibition model by a capillary tube is essentially qualitative and many authors discussed this model (e.g. [13 and 14]), but it allows us to understand the appearance of the capillary imbibition curves obtained experimentally and indicates clearly the influence of pore radius on the imbibition kinetics.
Tests were performed on cylindrical samples (diameter: 50 mm/height: 120 mm) placed in a sealed space on a fine plastic railing submerged in water. Samples were weighed after wiping the base with a wet rag and the height of the capillary front measured with a caliper at regular intervals. The average value of the capillary coefficient is calculated using three measurements of the height of the capillary front located on different zones on the sample to avoid the risks of local non-homogeneous pore structure.
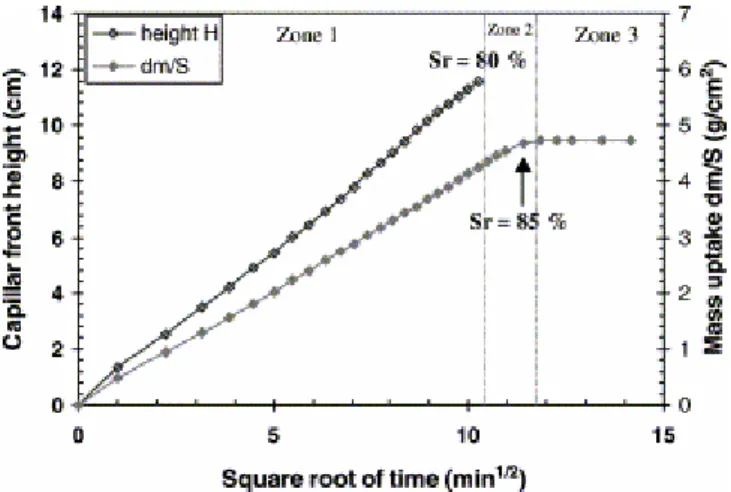
Fig. 9. Imbibition curves for a fresh sample of tuffeau.
Zone 1: in spite of the cylindrical capillary approximation, the curves of capillary ascent and
mass taking drawn according to the square root of time are linear, which indicates that the pore network is homogeneous. In the case of tuffeau, the relatively high coefficient B gives evidence of fast imbibition kinetics. The water front reaches the top of the sample (12 cm high) in about 2 h, so, liquid water can easily penetrate the tuffeau. Consequently, water can dissolve calcite deeply inside the stone.
Zone 2: the end of the mass uptake does not coincide with the arrival of the capillary front at
the top of the sample. This time lag (20 min for a test during 180 min) proves that the stone continues to saturate. After the visual saturation, there is a continuity of imbibition, by other capillary ways, and up to the mass saturation (filling of the free porosity). This phenomenon is due to textural properties and pore connections. Indeed, pore networks can be composed of different categories of pores having separate connections through the whole sample [15].
Zone 3: the curve representing mass uptake shows a linear part during the imbibition, then
after a sharp break, the water uptake continues very slowly. This second phase of low rate of saturation corresponds to the filling of trapped porosity by dissolution and diffusion of air bubbles in the water. Porosity calculated from imbibition indicates a value of about 37% (for a whole porosity of 48%), which corresponds to the porosity accessible by water during imbibition test. The proportion of trapped air bubbles represents 11% of the pore space and is directly related to the porous media morphology: air can be trapped in a macro-pore either by capillarity in meso-pores and micro-pores (water reaches the top of the sample before the macro-pores are saturated), or by a roughness of surface (pores formed with the opal CT spherules).
As shown in Table 3, an anisotropy of 14–17% is determined between samples cut parallel and perpendicular to the stone bed: imbibition is higher in the direction parallel to the bedding direction. This is due to the profile of sedimentation: because the stone was formed by successive sedimentary layers, the pore space is better connected in this direction. As samples were taken at 5 m depth, the effect of rain percolation is negligible. This effect should be correlated to the anisotropy obtained by compression test, these two effects having the same cause: an anisotropy of the pore structure due to the sedimentary past of the stone.
Table 3. Imbibition coefficients and anisotropy in relation to bedding directions
3.3.3. Water vapour diffusion
Measurements of the water vapour transfer were carried out using apparatus (Fig. 10) having two cells containing two different saturated salt solutions [16]. Tuffeau samples were placed in the diffusion set-up, the containers of saturated salt solutions were weighed quickly and the cell was rapidly assembled. The salt used in the lower cell induces a higher relative humidity than the one used in the upper cell. Moisture movement is due to water vapour concentration gradient induced by vapour pressure difference (suction difference) between the two compartments. The water that diffused from the most concentrated zone (lower cell) to the less concentrated one (upper cell) condenses in the salt solution saturated in the upper cell. The increase of the quantity of water is measured with time. All tests were carried out in a controlled temperature room (20±1°C). The upper container of each cell was weighed every 48 h over 2 weeks, then twice a week up to the end of the tests (approximately 10 weeks). The water vapour diffusion process continues until an equilibrium state is reached. The data from the experiment will yield the value for the water vapour diffusivity.
This procedure is conducted using seven diffusion apparatus with different saturated solutions, thus allowing the construction of the complete water vapour diffusivity curve for the tested relative humidity and equivalent suction (calculated using the Kelvin equation). The diffusion is described by Fick's second low [17]
where dCA/dt is the rate of change in concentration of compound A, D the diffusion
coefficient, and 2 the laplacian operator of CA (x, y and z directions).
In our case, water vapour diffusion occurs because of suction gradient and diffusion coefficient depends upon the volumetric water content of the sample and the diffusion is carried out through the sample height due to suction difference applied in the bottom and the top of the sample. Hence, Eq. (12) can be written as
where x is the distance moved by water front, t the time taken for water front movement, ψ the suction, D(θ) the water vapour diffusivity, and θ the volumetric water content (volume of water/total volume).
with θ=N×Sr,
where N and Sr are the porosity and the degree of saturation of the sample.
The surface emissions [18] occur between the sample and the overlying air as a consequence of several mechanisms, including evaporation, condensation and convection. As long as concentration gradient exists between the two phases, surface emission will occur:
E
A=K
A(C
1−C
2),
where E is the surface emission rate of compound A, K the mass transfer coefficient, C1 the
concentration of compound A at the surface of the material, and C2 the concentration of
compound A in the overlying air.
This phenomenon can be expressed for the diffusion set-up as
E
θ=K(θ)(ψ
2−ψ
1),
where Eθ is the surface emission rate of vapour (m2/h) equal to the volume of water captured
in upper cell during an elapsed time divided by (A/l), where A and l are surface area and height of the tested sample, respectively; K(θ) the water transfer coefficient called also hydraulic conductivity; and ψ1 the suction in the sample (induced by the lower cell) and ψ2 the
suction in overlying air in the upper cell. Suctions are determined in terms of equivalent height of water:
ψ=H
water×γ
waterand γwater=gρw with ρw being the density of water (kgm−3) and g the gravitational acceleration.
It must be mentioned here that samples are initially equilibrated with the relative humidity of the lower cells before diffusion testing. The humidity is supposed to be unchanged in the sample during the experiment. This was proved by water content measurements at the end of tests.
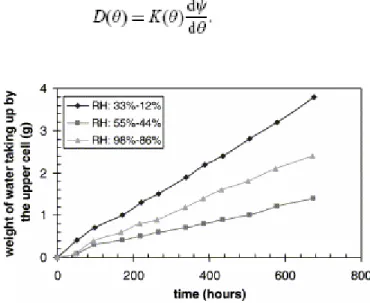
An example of weight changes of the upper cell is presented in Fig. 11. Only the linear part of the curve, where the system is in a steady state, was used to calculate the surface emission rate. The hydraulic conductivity can then be determined from Eq. (16). As the distinction between each mechanism of water flow during the test is difficult and in order to estimate the water diffusion coefficient, the following assumption was made: the diffusion coefficient is proportional to the hydraulic conductivity and to water retention behaviour.
Fig. 11. Weight changes of the upper cell during three diffusion tests.
The diffusivity coefficient measured D(θ) quantifies the diffusive transport in the tested material. It is defined as a steady-state flux in the pore water per unit surface of porous medium per unit concentration gradient. The above equation is very sensitive towards the water retention curve of the material especially at low water contents; this can be a source of error in the determination of the diffusivity.
Results obtained (Fig. 12 and Fig. 13) show that no considerable differences are found between the diffusion in both orientations, parallel and perpendicular to stone bed, the distance of diffusion (sample of thickness 1 cm) being too small to observe a possible anisotropy. But the agreement of these tests indicates the reproducibility of the phenomenon.
Fig. 13 shows that when suction decreases, i.e. humidity increases, the diffusivity decreases too. This behaviour is due to the processes of water transfer and to the accessibility of the vapour through the porous phase [19]. Decreasing suction induces an adsorbed layer or layers of certain thickness, which could be fixed within the interstitial pores. And when suction becomes sufficiently weak, the phenomenon of capillary condensation occurs which fills the finest pores and so obstructs the direct passage of the vapour. This reduces the available porosity and affected the vapour diffusion ( Fig. 14).
Fig. 12. Hydraulic conductivity versus RH from diffusion experiments.
Fig. 14. Stages in the wetting of a porous system (after Rose [19]).
The variations of hydraulic conductivity and vapour diffusivity versus relative humidity are opposite: with the increase of humidity rate, the vapour diffusivity decreases while hydraulic conductivity increases. This is due to the progressive change of behaviour during the humidity increasing: at low relative humidity most of the moisture moves by diffusion of vapour, and as relative humidity rises, the transport becomes a combination of diffusion, evaporation, condensation and convection.
Hydraulic conductivity increases strongly near high humidity (RH>90%). The variations can be several orders of magnitude until the value of permeability at saturation. Indeed, water permeability of tuffeau is important with an average of 10−13 m2, which corresponds to a
hydraulic conductivity of 10−6 m/s.
4. Discussion
Different tests show that tuffeau is a high porosity sedimentary limestone with a multi-scale pore space. This stone has a very large pore size distribution spreading from 0.001 to 350 μm, with a macro-porous component (higher than 1 μm) and a meso-porous component (between 0.1 to 1 μm). Nevertheless, mercury intrusion test gives an underestimation of the total porosity (32%). The mercury cannot invade small pores and then pore volume and the measured porosity is limited. To probe the micro-porosity (lower than 0.1 μm), the BET method is used to detect the nanoscale pores. But, taking into account pores determined by BET and the mercury measurements, the whole porosity is about 40%, value still smaller than the real porosity calculated from skeletal density measured by hydrostatic weighing (48%). This reveals clearly the limitation of these methods to measure the whole pore space mainly because of the homogenous and cylindrical shape of pores considered in the calculation. Tuffeau is also characterized by high silica content, essentially in the form of opal cristobalite-trydimite spherules, seen by SEM images (Fig. 5). The arrangement of these
solids is responsible for the major part of the macro-porosity, the meso-porosity being mainly given by their surface morphology and the micro-porosity is due to the finest phases (e.g. clays, micritic calcite, colloïds). SEM is a perfect tool for the investigation of grain sizes, shape arrangement and qualitative assessments of pore distribution. Data obtained, associated with other techniques such as X-ray diffraction and thermogravimetric analysis (mineral composition), allows a better understanding of the images.
Other tests could complete this study with 3D images obtained by X-rays tomography or by image analysis on backscattered electron scanning images. So, various complementary methods have to be used to characterize a multi-scale pore space.
Concerning the anisotropy due to sedimentation action (stone bed) of the tuffeau, two dissimilar tests were used: imbibition tests and axial compression tests which give values from 14 to 25%. In fact, these two methods measure substantially different parameters, i.e. two anisotropies: a mechanical one depending on elastic properties of present rock-forming minerals, on their mutual relationships and on the presence of voids; and a textural one influenced by pores and their interconnection.
The pore space characterization is the first step for the stone deterioration study. With such a high porosity, the behaviour of the tuffeau depends highly on the water content [20]. Indeed, between the dry state and the saturated state, the difference in the axial compression stress reaches about 55%, which agrees with West's results [10] who studied mechanical behaviour of several stones according to relative humidity. Water inside pore network leads to a high reduction of strength which could be explained by a decrease of contact energy between the grains. In all the range of humidity, uniaxial compressive strength strongly decreases as water content increases up to a critical water content then stabilizes near to its lower value, i.e. the value at saturation.
Results from saturated salt solutions, osmotic solutions (PEG) and tensiometric plates are combined to evaluate the wide range of the water retention curve (Fig. 7). Data reveal that this curve is composed of two parts separated at a degree of saturation about 25–30%:
• below this value, water flow in vapour phase investigated by diffusion tests;
• for a higher degree of saturation, water flow in liquid phase examined by capillary imbibition tests.
High values of capillary coefficients and of hydraulic conductivity at saturation obtained for the tuffeau (10−6 m/s) reveal the high capacity of water flow in this building stone. It is well
known that the contribution of each mechanism cannot be easily identified; however, diffusion tests show that the hydraulic conductivity of water vapour increases while the diffusion coefficient decreases with relative humidity. This behaviour is directly related to the pore space accessible to liquid water and to water vapour. As relative humidity increases, the hydraulic conductivity rises because condensation permits the formation of film of liquid. It shows the progressive changes in the water transfer assessment with relative humidity changes within this building stone: a change in water transfer mechanism from diffusion of vapour to flow of liquid as RH increases.
Moreover, it must be mentioned that imbibition tests allow also quick and easy qualitative assessment of the homogeneity of the porous network and the thickness of different deteriorated zones in the stone. According to imbibition curves (Fig. 9), the pore size
distribution and the connection between small and big pores are complex as revealed by the time lag between visual and mass saturation. This corroborates with the pore distribution ( Fig. 2) showing a very large distribution with a high pore diameter proportion near 10 μm and a large range of smaller pores. Changes in the slope of imbibition curve show the different zone of deteriorated stone on a sample of tuffeau extracted from Chambord's Castle (Fig. 15, [21]). The sample patina (surface hardened zone with a reduction of porosity by crystallization of salts) strongly decreases the imbibition by capillarity, the coefficient of water mass uptake is three times lower in the superficial zone than in the central zone: modifications of structure of the porous network appear down to about 8 mm.
Fig. 15. Imbibition curves for a deteriorated stone extracted from Chambord's Castle, France (after Brunet-Imbault [21]).
5. Conclusion
This research is a part of a larger project concerning the deterioration and restoration of historical buildings in France. Among the parameters influencing deterioration, moisture and water movements inside the pore network are essential. This paper presents numerous methods of investigation for the characterization of the porous building material and for the determination of water transfer properties.
Tests presented in this paper are chosen for their simple execution and interesting data obtained. Measuring by the imbibition test the height of the water capillary ascension or weighing the sample during this test gives very useful information about the anisotropy of the tested material and also about the pore distribution and topology. Coefficient of water vapour transfer was assessed using a simple apparatus having two cells containing two different saturated salt solutions. This test allows one to measure the hydraulic conductivity of the water vapour and to determine the coefficient of diffusion as function of relative humidity around the stone.
The behaviour of tuffeau is very sensitive to changes in relative humidity and has a very high water retention capacity. Determined water transfer properties are directly linked to pore network (e.g. pore size and connection) characterized by various methods: mercury porosimetry, BET measurements, SEM images. The high porosity and the high imbibition coefficient in the tuffeau imply that water moves easily and cyclic water transfer induces physico-chemical reactions (dissolution, crystallization) leading to textural changes and deterioration.
The simple and fast determination of water transfer and morphological and textural parameters of the stone is also useful for the restoration of monuments. The behaviour of the restoration stone must be similar to those of the different adjoining stones (porosity, mechanical resistance, permeability, imbibition coefficients) in order to minimize the deterioration process.
The modelling of water transfers in progress is based on the coupled analysis of macroscopic behaviour and microscopic properties and on the effect of dissolution–recrystallization. The modelling aims also to predict the durability and the behaviour of the restored stone after treatment.
Other techniques such as nuclear magnetic resonance could also be used to investigate the structure and the molecular dynamics of water layers at the water/solid interface, as it can probe the physical state of interlayer water.
Acknowledgements
The authors gratefully acknowledge the help of Mr. A. Plançon & Mr. F. Muller for interesting discussions and in conducting some experiments presented in this paper. Mr. S. Guérif Director of LUCET quarry is gratefully acknowledged for providing the tuffeau.
References
1. Dessandier D. Etude du milieu poreux et des propriétés de transfert des fluides du tuffeau blanc de Touraine. Application à la durabilité des pierres en œuvre, PhD thesis, University of Tours, France, 1995.
2. G. Chéné, G. Bastian, C. Brunjail and J.P. Laurent, Accelerating weathering of tuffeau block submitted to wetting–drying cycles. Materials and Structures 32 221 (1999), pp. 525– 532.
3. S. Brunauer, P.H. Emmett and E. Teller, Adsorption of gases in multimolecular layers.
Journal American Chemical Society 60 (1938), pp. 309–324.
4. Rouquerol F, Rouquerol J, Sing K. Assessment of microporosity. In: Adsorption by powders and porous solids. London: Academic Press, 1999. p. 219–36.
5. D. Dessandier, F. Antonelli and L. Rasplus, Relationships between mineralogy and porous medium of the crai tuffeau (Paris Basin, France). Bulletin de la Société Géologique de France
186 6 (1997), pp. 741–749.
6. Fitzner B. Porosity analysis—A method for the characterization of building stones in different weathering states. In: Koukis G, Marinos G, editors, Engineering geology of ancient works, monuments and historical sites, 1999. p. 2031–7.
7. P. Renault, Theoretical studies of mercury intrusion in some networks: testing the applicability of mercury intrusion in the size characterisation of the lacunar pore space of soil samples. Transport in Porous Media 3 (1988), pp. 529–547.
8. Rautureau M. Tendre comme la pierre, Region Council & University of Orléans, 2001, downloaded from http://www.culture.fr/culture/conservation/fr/biblioth/biblioth.htm.
9. B. Brunet-Imbault, I. Rannou, F. Muller and M. Rautureau, Application of X-ray diffraction to the study of limestone patinas. Journal of Physics IV France 8 Part 5 (1988), pp. 525–530.
10. G. West, Effect of suction on the strength of rock. Quarterly Journal of Engineering
Geology 27 1 (1994), pp. 51–56.
11. D.G. Fredlund and H. Rahardjo. Soil mechanics for unsaturated soils, Wiley, New York (1993).
12. E.W. Whashburn, The dynamics of capillary flow. Physics Review 17 3 (1921), pp. 273– 283.
13. D. Hoffmann and K. Niesel, Quantyfying capillary rise in columns of porous materials.
American Ceramic Society Bulletin 67 8 (1988), p. 1418.
14. L. Labajos-Broncano, M.L. González-Martín, B. Janczuk, J.M. Bruque and C.M. González-García, Distance–time measurements in capillary penetration: choice of the coordinate system. Journal of Colloid and Interface Science 211 (1999), pp. 175–177.
15. Jeannette D. Capillary transferts in rocks. Cous doctoral européen—Sciences et matériaux du patrimoine culturel, Ravello-Florence, 1992.
16. Al-Mukhtar M. Water vapour transfer in highly compacted and unsaturated soils. Proceedings of the Third International Conference on Unsaturated Soils 10–13 March, Recife-Brazil, Jucà, de Campos & Marinho, editors. Unsaturated soils, vol. 1. ISBN 90 5809 371 9, Rotterdam: A.A. Balkema Publishers, 2002. p. 389–94.
17. R.B. Bird, W.E. Stewart and E.N. Lightfoot. Transport phenomena, Wiley, New York (1960).
18. F. Haghighat and L. De Bellis, Material emission rates: literature review, and the impact of indoor air temperature and relative humidity. Building and Environment 33 5 (1988), pp. 261–277.
19. D.A. Rose, Water movement in porous materials—II: the separation of the components of water movement. British Journal of Applied Physics 14 (1963), pp. 491–496.
20. C.G. Dyke and L. Dobereiner, Evaluating the strength and deformability of sandstones.
Quarterly Journal of Engineering Geology 24 1 (1991), pp. 123–134.
21. Brunet-Imbault B. Etude des patines de pierres calcaires mises en oeuvre en région Centre. PhD thesis, University of Orléans, France, 1999.