HAL Id: hal-02330304
https://hal.archives-ouvertes.fr/hal-02330304
Submitted on 23 Oct 2019HAL is a multi-disciplinary open access archive for the deposit and dissemination of sci-entific research documents, whether they are pub-lished or not. The documents may come from teaching and research institutions in France or abroad, or from public or private research centers.
L’archive ouverte pluridisciplinaire HAL, est destinée au dépôt et à la diffusion de documents scientifiques de niveau recherche, publiés ou non, émanant des établissements d’enseignement et de recherche français ou étrangers, des laboratoires publics ou privés.
Modelling mineral dust emissions
B. Laurent, B. Marticoréna, G. Bergametti, I. Tegen, K. Schepanski, B.
Heinold
To cite this version:
B. Laurent, B. Marticoréna, G. Bergametti, I. Tegen, K. Schepanski, et al.. Modelling mineral dust emissions. IOP Conference Series: Earth and Environmental Science, IOP Publishing, 2009, 7, pp.012006. �10.1088/1755-1307/7/1/012006�. �hal-02330304�
Modelling mineral dust emissions
B Laurent1, B Marticorena2, G Bergametti2, I Tegen1, K Schepanski1 and B Heinold1
1 Leibniz-Institut für Troposphärenforschung, IfT, Permoserstraße 15, 04318, Leipzig,
Deutschland.
2 Laboratoire Inter-universitaire des Systèmes Atmosphériques, LISA, UMR 7583
CNRS, Universités Paris VII-XII, 61 Avenue du Général de Gaulle, 94010, Créteil, France.
Email: [email protected]
Abstract. The biogeochemical cycle of mineral dust is of major interest to understand climatic changes. Moreover, these particles can also cause risks for human health and societal activities in regions in the neighbourhoods of arid and semi-arid source areas of dust emission. To estimate and forecast atmospheric dust concentrations and their impacts, the correct description of the spatial and temporal variability of dust emission occurrences and intensities is a prerequisite. The explicit dust emission models provide a physical description of the main processes involved in dust production. They allow describing the spatio-temporal variability of the non-linear phenomenon of dust production if their input parameters (surface and soil features, surface winds) are accurately described. The recent developments, the current limits of these emission models, and some of their applications using relevant surface, soil and meteorological databases to simulate dust emissions are presented here.
1. Introduction
Atmospheric mineral dust is mainly produced by aeolian erosion acting in arid and semi-arid areas. Mineral aerosols have an impact on the Earth´s radiative budget by absorbing and scattering incoming solar and outgoing terrestrial radiation (e.g. [1]). The evaluation of this impact still represents a major uncertainty on the understanding of climatic changes. Mineral dust is involved in heterogeneous and multiphase atmospheric chemistry, affecting photo-oxidant concentrations and the composition of precipitation [2,3]. It also contributes to the biogeochemical cycles of many elements, as Fe and P, suspected to be limiting in isolated ecosystems (e.g. open oceans, the Amazon forest) [4,5,6]. At a regional scale, emitted mineral dust represents risks and nuisances for the exposed populations living close to the source areas.
To evaluate the mineral dust impacts, their concentration fields have to be determined precisely. Modelling dust emissions is of key importance to reproduce dust atmospheric concentrations. In fact, dust emissions are a threshold phenomenon, sporadic and spatially heterogeneous. Efforts have been deployed for more than 10 years to develop explicit dust emission models based on the physical processes at the interface between the atmosphere and the surface. Despite current modelling limits, the available emission models already allow to compute the dust flux produced for erodible arid surfaces satisfyingly provided the required input parameters (surface, soil and meteorological features) have been specifically determined. The development of accurate surface and soil databases and the use
WMO/GEO Expert Meeting on an International Sand and Dust Storm Warning System IOP Publishing IOP Conf. Series: Earth and Environmental Science 7 (2009) 012006 doi:10.1088/1755-1307/7/1/012006
c
of the most pertinent meteorological datasets at the relevant scales are required to model mineral dust correctly.
2. Explicit and process-oriented dust emission models 2.1. Parameterizations of the erosion threshold
Dust emissions occur when the wind velocity (U), and thus the wind friction velocity (U*), exceeds a certain value. This wind friction velocity value is called the threshold wind friction velocity (U*
t). U*t controls both the occurrence of dust emissions and their intensity. Based on experimental data from [7] and [8], U*
t can be considered as a function of the soil grain diameter. For large soil grains, U*t increases when the grain size increases (due to the gravity forces). For the smallest soil particles, U*
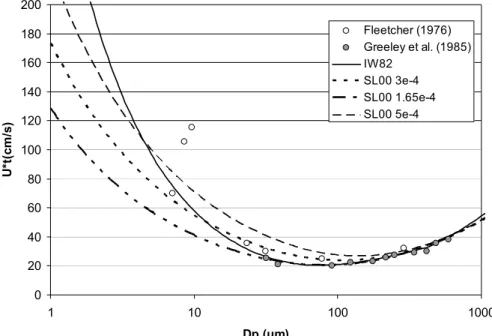
t increases when the grain size decreases (mainly due to the inter-particle cohesive forces reinforcing grain bonds) [9]. These two effects lead to an optimum grain size around 80 µm for which U*
t is the lowest (figure 1). 0 20 40 60 80 100 120 140 160 180 200 1 10 100 1000 Dp (µm) U* t( cm /s ) Fleetcher (1976) Greeley et al. (1985) IW82 SL00 3e-4 SL00 1.65e-4 SL00 5e-4
Figure 1: Threshold wind friction velocity (U*
t) as a function of the soil aggregate diameter (Dp). Circles represent data from [10,11] and
[12]. Simulations for several parameterizations: [9] (IW82), and [13] with γ =3 × 10⁻⁴ kg.s-2 (SL00 3e-4), γ =1.65 × 10⁻⁴ kg.s-2 (SL00 1.65e -4), γ =5 × 10⁻⁴ kg.s-2 (SL00 5e-4).
Moreover, non erodible elements (pebbles, stones or vegetation), present on the desert surfaces, dissipate a part of the wind momentum that will not be available to initiate particle motion. This leads to a global decrease of the wind shear stress acting on the erodible surface and to an apparent increase of U*
t. For example, [14] developed and validated a physical scheme describing the so-called drag partition (feff) between the roughness elements (characterized by the aerodynamic roughness length, Z0) and the erodible surface (characterized by the smooth roughness length, z0s). U*t can be then parameterized in “rough” or “smooth” situations which are encountered in arid and semi-arid areas:
WMO/GEO Expert Meeting on an International Sand and Dust Storm Warning System IOP Publishing IOP Conf. Series: Earth and Environmental Science 7 (2009) 012006 doi:10.1088/1755-1307/7/1/012006
) 0s Z , 0 (Z eff f p (D t * U
)
z
,
Z
,
(D
U
*t p 0 0s ) = with 0, 0
( ) ( )
0.8 10 0 1 0.35 0 0 ( ) eff s Z z s z s f Z z = −⎛⎜ ⎛⎜ ⎞⎟ ⎝ ⎠ ⎝ ⎠ ⎞ ⎟ (1) The soil moisture (w) is another factor affecting U*t. The cohesive forces between the soil grains are reinforced by the soil water, and thus the erosion threshold is increased. A parameterization of this influence of the soil moisture on the erosion threshold was proposed by [15] (equation 2). The increase of the erosion threshold under wet conditions in reference to dry conditions is computed as a function of w and the residual soil moisture (maximum amount of adsorbed water, w’, defined as a function of the soil clay content):
For w > w´,
(
)
5 . 0 68 . 0 ' 21 . 1 1 * *⎥⎦
⎤
⎢⎣
⎡
+ − = w w td U tw U with w'= 0 .0 0 1 4 (c la y% )2 + 0 .1 7 (c la y% ) (2)2.2. Erosion horizontal flux (G)
Many theoretical and experimental works [7,16,17,18,19,20,21] showed that the horizontal flux (G), mostly composed of soil grains in movement of saltation or creeping, is proportional to the third power of U*. Using a size-dependent expression of U*
t, the White’s formulation also provides a dependent equation of G (equation 3) [22]. The amount of material mobilized by wind and its size-distribution can be then computed as a function of U*
(E is the fraction of erodible surface, Srel(Dp) is the relative surface covered by the particles of diameter Dp):
p * * 2 0 0 0 0 *3 a * *2 D ( , , ) ( , , ) ρ 1 1 g t p s t p s rel p U D Z z U D Z z G E U S D U U ⎛ ⎞⎛ ⎞ = ⎜⎜ + ⎟⎜⎟⎜ − ⎟⎟ ⎝ ⎠⎝ ⎠
∑
( ) (3)[22] showed that this size-dependent representation of G well-reproduces the total mass and the size distribution of the horizontal fluxes measured in a wind tunnel for different soil substrates and wind friction velocities by [23] or [19]. However, it must be noted that such a parameterization does not correctly reproduce the horizontal flux for supply-limited surfaces such as crusted soils [24].
2.3. Dust vertical flux (F)
The dust vertical flux (F) is composed of the finest particles setting in suspension from the saltation layer. These particles are then able to be transported over long distances. The dust production occurs during the “sandblasting” process, when the saltating grains impact on the surface and break the inter-particle bonds linking dust inter-particles together or to the surface. Based on [17] coupled measurements of horizontal fluxes and vertical fluxes of dust particles with a diameter < 20 µm, [14] established an empirical relationship between the ratio F/G (i.e. the sandblasting efficiency, α) and the soil clay content. Using this parameterization the total mass of F can be estimated. Only sandblasting-process models allow to simulate both the mass and the size distribution of F explicitly.
[25] and [26] proposed a sandblasting-process model based on the existence of three typical dust particle populations that can be released from arid soils. These three modes are log-normally distributed and are characterized by specific binding energies corresponding to the thresholds of disruption of the soil aggregates. Dust of a given size is produced when the kinetic energy of the saltating soil particles exceeds the corresponding threshold. This implies that the dust size distribution varies as a function of the saltating particle size and their velocity [27,28].
WMO/GEO Expert Meeting on an International Sand and Dust Storm Warning System IOP Publishing IOP Conf. Series: Earth and Environmental Science 7 (2009) 012006 doi:10.1088/1755-1307/7/1/012006
In contrast to this energy-based model, the dust production can also be estimated as a function of the volume of soil removed by the saltating grains impacting on the surface [29]. An elaborated version of this model taking the saltation bombardment, the aerodynamic entrainment, and the aggregate disintegration into account, was developed by [30,31]. Large scale application of these sandblasting models is not easy due to the required input data (binding energy, soil plastic pressure) which cannot be easily determined from measurements at such a scale. This is currently one of the limitations to explicitly describe (i.e. based on physical processes) the size distribution of emitted mineral dust.
Major uncertainties in the modelling of dust emissions are the effects of the crusted soils and of specific soils such as the diatomite soil in the Bodélé Depression, the supply limitation of the soil, and the connection between the soil and the emitted dust size distribution and the dust composition. Moreover, the specific processes of dust emissions from the semi-arid vegetated and cultivated surfaces will need further investigations of the aerodynamic properties of the vegetation (porosity, flexibility, arrangement), of their temporal and spatial variability, and of the land use and agricultural practices. Additional data collection from these specific areas and new parameterization developments will be required.
3. Modelling dust emissions for regional and continental arid areas
The current explicit emission models allow to compute the dust flux emitted from erodible arid areas satisfyingly, provided input parameters have been specifically determined. For continental scale applications, the development and the use of accurate databases (surface, soil, and meteorology) are prerequisites to model mineral dust correctly.
3.1. Retrieval of relevant input data for the simulation of dust emissions
For the last decade, input databases have been developed alongside to the advancements of explicit dust emission models [e.g. 22,32,33,34,35,36,37,38]. We discuss here some of the most important soil, surface and meteorological input parameters for the modelling of dust emissions and some of the current methods used for their large scale establishments. It can already be noticed that a problem shared by all these methods is an under-constraint of the datasets due to the few available in-situ measurements.
In natural soil, various soil grain or aggregate sizes are present simultaneously. Since theses grains of different sizes have different threshold wind friction velocities, the in-situ soil size distribution has to be correctly described in emission models.
Soil maps generally classify soils according to the “textural triangle” defined by three size components: sand (2000 to 80 μm diameter), silt (80 to 4 μm diameter) and clay (<4 μm diameter) [39]. This classification is based on measurements performed by wet sedimentation techniques which break the soil aggregates (ultrasonic pre-treatment, dissolution). This leads to relatively high amounts of loose clay particles that generally form aggregates of larger size (>50-100 µm) and are then not encountered in the natural soils [40]. Moreover, [37] pointed out that for the north-east Asian deserts there is no direct relation between the soil texture and the soil grain size distribution. As a result, a soil texture classification cannot be directly used to characterize in-situ size distributions of erodible soils.
An alternative approach is to determine the soil size distribution using dry techniques that minimize, as much as possible, the breaking of the aggregates [40]. This approach was used by [39] for the characterization of the Saharan and Sahelian soils and applied to Chinese soil samples by [41]. In these works, the soil grain size is assumed to be log-normally distributed or to be the combination of 2 or 3 different log-normal distributions. However, the present data sets of such measurements remain limited and not homogeneous in terms of analytical methods. As mentioned by [40], there is a clear need for both standardized methods and sampling programs allowing for a correct mapping of the in situ size distribution of desert erodible soils.
WMO/GEO Expert Meeting on an International Sand and Dust Storm Warning System IOP Publishing IOP Conf. Series: Earth and Environmental Science 7 (2009) 012006 doi:10.1088/1755-1307/7/1/012006
The use of the drag partition scheme application for regional to global scale applications induces a similar problem to that encountered for the mapping of the soil grain size distributions: How can a map of aerodynamic roughness lengths (Z0) be obtained over continental desert areas? A first method was developed for the Sahara desert by [22] and [32] based on a geomorphologic study of the surfaces. However, this method is very time consuming (with respect to the analysis of the data for continental areas) and its extension to other deserts depends on the number and quality of the available geomorphologic information.
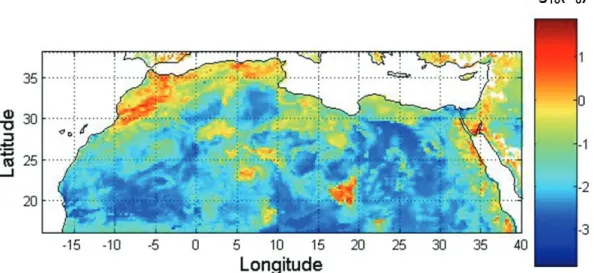
A second method was to examine how satellite observations could provide a global mapping of Z0. Following [42], who used the radar backscatter signal to retrieve Z0 over selected desert targets, [35] investigated the possibility to retrieve Z0 over arid areas using the surface products derived from the spaceborne POLDER-1 instrument (Polarization and Directionality of the Earth´s Reflectances). An empirical relationship between Z0 and the protrusion coefficient (PC) derived from the POLDER-1 bi-directional reflectance distribution function in the visible range was determined. Maps of Z0 (with a resolution of 1/
16°×1/16° to ¼°×¼°) were then established for the North African and north-east Asian
deserts [35,38,43] (figure 2).
Figure 2: Map of log10(Z0) derived from POLDER-1 products and completed using a geomorphologic approach at the ¼°×¼° spatial resolution (Z0 is in cm, data available on: www.lisa.univ-paris12.fr).
Based on in-situ measurements of Z0 in Tunisia, this approach was extended to the radar backscatter coefficient from high resolution images (Synthetic Aperture Radar, SAR, onboard the Earth Resource Satellite, ERS) [44]. This recent works provide an operational tool to derive Z0 maps for local to regional applications. The variability of erodible desert surfaces in dust models will be better described using the physical parameterizations of the effects of Z0 on the threshold wind friction velocities combined with these new datasets.
As already mentioned, dust emissions have a non linear dependence to wind speeds. Small errors on the surface wind speed values could lead to large errors on dust emissions [40]. Thus, the accuracy of the wind speed used in dust models is crucial. Most of the dust models use wind fields provided by meteorological centres (e.g. NCEP, ECMWF). Their spatial resolution is generally not higher than about 1°×1°. Other models, for instance those computing feedbacks between dust and dynamics, use wind fields computed on-line by an atmospheric general circulation model (with a lower resolution generally of 2°×2° up to 5°×5°). In certain locations as the Bodélé Depression, low-resolved wind speeds tend to be underestimated [45], and they can not reproduce specific meteorological processes forcing dust emissions (e.g. low-level jet, density current, squall line). Additional parameterizations, mainly based on wind probability density functions, were introduced to account for the subgrid wind
WMO/GEO Expert Meeting on an International Sand and Dust Storm Warning System IOP Publishing IOP Conf. Series: Earth and Environmental Science 7 (2009) 012006 doi:10.1088/1755-1307/7/1/012006
fluctuations [46,47,48]. If such an approach is valuable for climatic simulations, the use of wind fields derived from well-resolved regional meteorological models (e.g. MM5, RAMS, Lokal Modell) should be favoured for simulations of specific dust events [40].
3.2. Regional to continental simulations of dust emissions
The explicit dust emission model developed by [14] and coupled with relevant input datasets of the surface characteristics allows to simulate the dust emission occurrences and their intensity over continental desert areas with a good confidence level [37,38]. Both the emission occurrences and the intensity have to be modelled correctly, the radiative and biogeochemical impacts of sporadic but intense dust pulse events on the environment being different from the dust background impact due to frequent but less intense events.
Using this model configuration, dust emissions from the Sahara over a 6-yr simulated period correspond to an average value of 670 Tg ± 60 Tg per year with pronounced seasonal cycles [38]. These Saharan dust emissions are 2 or 3 times higher than the emissions simulated under the same conditions for the north-east Asian deserts (240 Tg ± 130 Tg) [37]. Using the modelling method developed in these two studies, dust emitted from large source areas over North African and north-east Asian deserts but also from small and very active areas (“hot spots”) are simulated. In addition, the sub-daily temporal resolution of the simulations respects the sporadic nature of dust emissions and allows to reproduce non-frequent and unusually intense dust events which can partly control the interannual variability of the dust emissions.
Studies have also been done to evaluate the performance of regional dust model systems (e.g. [ 49,50,51]). Occurrences of significant dust emissions (i.e. dust flux > 10-10 g.cm-2.s-1) simulated with
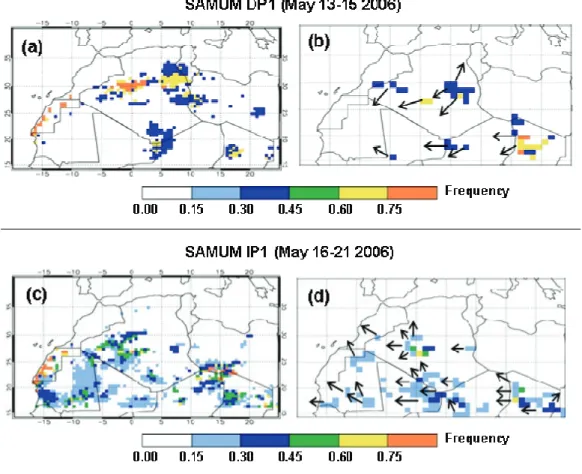
the LM-MUSCAT regional model for two periods of the Saharan Mineral Dust Experiment (SAMUM) with a spatial resolution of 28 km×28 km and a hourly temporal resolution are presented in figures 3 a and c. The spatio-temporal variability of the simulated emissions is in agreement with the dust emission observed from Meteosat Second Generation (MSG) SEVIRI IR difference images and using a back-tracking approach developed by [52] for the same two periods (figures 3 b and d respectively). The emissions observed with MSG (only the first ones when there is no cloud and no dust stagnation) correspond to a minimum frequency of occurrence. While regional models generally provide good results in reproducing the spatio-temporal dust variability for cases where dust emission is caused by large-scale dynamics, dust emissions in connection with moist convective events can, for instance, be misrepresented [51]. Currently, one of the main questions and uncertainties concerns the regional evaluation and forecast of emissions from semi-arid sources, as for example in the Sahel. The improvement of dust emission modelling and forecasting are necessary to determine and manage the risks and nuisances for the exposed populations living in these areas correctly.
The validation of the simulated dust emissions is also a complex issue due to the lack of quantitative measurements directly over desert surfaces. The appropriate strategy to test the simulations should be to use all available proxy of mineral dust content close to the source areas and during transport (horizontal visibility measurements (e.g. [37,53,54]); aerosol optical thickness from AERONET, on http://aeronet.gsfc.nasa.gov/; vertical profiles from EARLINET network, on http://www.earlinet.org/). The validation should also be based on the use of the satellite products over continental (aerosol index from OMI TOMS and Meteosat/IRT; dust emission observation from MSG) and oceanic surfaces (optical depth from SeaWIFS, Meteosat/VIS, PARASOL; vertical distribution from CALIPSO). As already mentioned, [52] made use of 3 thermal IR wavelength channels of the MSG SEVIRI instrument to detect atmospheric dust over land. The high spatio-temporal resolution renders then the detection of location of individual dust emission events possible (figures 3 b and d). Successful field campaigns which have studied mineral dust (e.g. African Monsoon Multidisciplinary Analyses, AMMA; Saharan Mineral Dust Experiment, SAMUM; Bodélé Dust Experiment, BoDEx) will be useful to better understand the mineral dust properties and to validate dust simulations.
WMO/GEO Expert Meeting on an International Sand and Dust Storm Warning System IOP Publishing IOP Conf. Series: Earth and Environmental Science 7 (2009) 012006 doi:10.1088/1755-1307/7/1/012006
Figure 3: Occurrence of significant dust emissions (i.e. dust flux > 10-10g.cm-2.s-1)
simulated with the LM-MUSCAT regional model (a), and occurrence of dust emissions observed with Meteosat Second Generation (b) during SAMUM Dust Phase 1 (DP1). The same informations are reported for the SAMUM Intermediate Phase 1 (c and d respectively). For the MSG observations, only the first pixel (1°×1°) where dust emission is observed is taken into account and compiled in the maps (when there is no cloud and no dust stagnation). The arrows show the main transport directions of the dust plumes under which emitted and transported dust cannot be differentiated.
4. Conclusion
During the last decade, dust emission models based on a physical basis and allowing for a better consideration of the heterogeneity of the surface features were developed. This is an important step ahead since the spatial variability of dust emissions is partly controlled by differences of the erodible surfaces in terms of soil grain size distributions, texture, and surface roughness. Alongside, new techniques have been developed (as ones derived from satellite observations) to provide relevant surface data required by the emission models. Maps of Z0 have been developed for the Saharan and Asian deserts and a global map for all the arid desert areas should be available soon. Though new data on the soil grain size distributions of desert areas are required, the available datasets have significantly grown. Sandblasting models have been conceptually developed and should be operational soon. This represents a progress since these models have the capability to simulate the dust flux and the dust size distribution explicitly. Accurate size-resolved dust fluxes are key parameters to simulate the long-range transport and the impacts of dust correctly. However, as a consequence of the progresses in dust production parameterizations and in the surface databases used in dust models, the uncertainty due to the lacking accuracy of the surface wind speed becomes more and more evident. A large part of the
WMO/GEO Expert Meeting on an International Sand and Dust Storm Warning System IOP Publishing IOP Conf. Series: Earth and Environmental Science 7 (2009) 012006 doi:10.1088/1755-1307/7/1/012006
future advances in dust modelling, especially to establish a forecasting system, will thus be focus on the provision of better resolved and more accurate wind fields for dust emission models. The new developments in satellite dust observations and the recent field campaigns will offer unique frames to better constrain dust emission simulations.
References
[1] Sokolik, I.N. and O.B. Toon, 1999 Incorporation of the mineralogical composition into models of the radiative properties of mineral aerosol from UV to IR wavelengths, J. Geophys. Res., 104, D8, 9423-9444.
[2] Loÿe-Pilot, M.D., J.M. Martin and J. Morelli, 1986 Influence of Saharan dust on the rain acidity and atmospheric input to the Mediterranean, Nature, 321, 427-428
[3] Bauer, S.E., Y. Balkanski, M. Schulz, D.A. Hauglustaine and F. Dentener, 2004 Global modeling of heterogeneous chemistry on mineral aerosol surfaces: The influence on tropospheric ozone chemistry and comparison to observations, J. Geophys. Res., 109, D02304, doi: 10.1029/2003JD003868.
[4] Bergametti, G., E. Remoudaki, R. Losno, E. Steiner, B. Chatenet and P. Buat-Ménard, 1992 Sources, transport and deposition of atmospheric phosphorus over the northwestern Mediterranean, J. Atmos. Chem., 14, 501-513.
[5] Swap, R., M. Garstang, S. Greco, R. Talbot and J.Y. Gac, 1992 Sahara dust in the Amazon basin, Tellus B, 44, 133-149.
[6] Jickells T.D., Z.S. An, K.K. Andersen, A.R. Baker, G. Bergametti, N. Brooks, J.J. Cao, P.W. Boyd, R.A. Duce, K.A. Hunter, H. Kawahata, N. Kubilay, J. La Roche, P.S. Liss, N. Mahowald, J.M. Prospero, A.J. Ridgwell, I. Tegen and R. Torres, 2005 Global iron connections: Between desert dust, ocean biogeochemistry and climate. Science, 308, 5708, 67-71.
[7] Bagnold, R.A., 1941 The physics of blown sand and desert dunes, Methuen, New York, 265 pp. [8] Chepil, W.S., 1945 Dynamics of wind erosion, Soil Sci, 60, 305-320.
[9] Iversen, J.D. and B.R. White, 1982 Saltation threshold on Earth, Mars and Venus, Sedimentology, 29, 111-119.
[10] Fletcher, B., 1976 The erosion of dust by an airflow, J. Phys. D Appl. Phys., 9, 17, 913-924. [11] Fletcher, B., 1976 The incipient motion of granular materials, J. Phys. D Appl. Phys., 9, 17,
2471-2478.
[12] Greeley, R. and J.D Iversen, 1985 Wind as a geological process on Earth, Mars, Venus and Titan, Cambridge University Press, New-York, 333 pp.
[13] Shao., Y. and H. Lu, 2000 A simplified expression for threshold friction velocity, J. Geophys. Res., 105, 22,437-22,443.
[14] Marticorena, B. and G. Bergametti, 1995 Modeling the atmospheric dust cycle: 1-Design of a soil derived dust production scheme, J. Geophys. Res., 100, 16415-16430
[15] Fécan, F., B. Marticorena and G. Bergametti, 1999 Parameterization of the increase of the aeolian erosion threshold wind friction due to soil moisture for semi arid areas, Ann. Geophys., 17, 149-157.
[16] White, B.R., 1979 Soil transport by winds on Mars, J. Geophys. Res., 84, 4643-4651.
[17] Gillette, D.A., 1979 Environmental factors affecting dust emission by wind erosion in Saharan Dust, C. Morales (Ed.), John Wiley, New York, 71-94.
[18] Gillette, D.A. and P.H. Stockton, 1989 The effect of nonerodible particles on wind erosion of erodible surfaces, J. Geophys. Res., 94, 12,885-12,893.
[19] Sörensen, M., 1985 Estimation of some aeolian saltation transport parameters from transport rate profiles, in Proceedings of the International Workshop on the Physics of Blown Sand, O.E. Barndorff- Nielsen, J.T. Möller, K. Römer Rasmussen, B.B. Willets (Eds.), University of Aarhus, Aarhus, Denmark, 141-190.
WMO/GEO Expert Meeting on an International Sand and Dust Storm Warning System IOP Publishing IOP Conf. Series: Earth and Environmental Science 7 (2009) 012006 doi:10.1088/1755-1307/7/1/012006
[20] Leys, J.F. and M.R. Raupach, 1991 Soil flux measurements with a portable wind erosion tunnel, Aust. J. Soil Res., 29, 533-552.
[21] Shao, Y., M.R. Raupach and P.A. Findlater, 1993 Effect of saltation bombardment on the entrainment of dust by wind, J. Geophys. Res., 98, 12,719-12,726.
[22] Marticorena, B., G. Bergametti, B. Aumont, Y. Callot, C. N’Doumé and M. Legrand, 1997 Modeling the atmospheric dust cycle: 2-Simulation of Saharan sources, J. Geophys. Res., 102, 4387-4404.
[23] Williams, G., 1964 Some aspects of the aeolian saltation load, Sedimentology, 3, 253-256. [24] Lopez, M.V., 1998 Wind erosion in agricultural soil: an example of limited supply of particles
available for erosion, Catena, 33, 17-28.
[25] Alfaro, S., A. Gaudichet, L. Gomes and M. Maillé, 1997 Modeling the size distribution of a soil aerosol produced by sandblasting, J. Geophys. Res., 102, 11,239-11,249.
[26] Alfaro, S., A. Gaudichet, L. Gomes and M. Maillé, 1998 Mineral aerosol production by wind erosion: aerosol particles size and binding energies, Geophys. Res. Lett., 25, 991-994.
[27] Alfaro, S. and L. Gomes, 2001 Modeling mineral aerosol production by wind erosion: emission intensities and aerosol size distributions in source areas, J. Geophys. Res., 106, 18,075-18,084.
[28] Alfaro, S., J.L. Rajot and W.G. Nickling, 2004 Estimation of PM20 emissions by wind erosion: main sources of uncertainties, Geomorphology, 59, 63-74.
[29] Lu, H. and Y. Shao, 1999 A new model for dust emission by saltation bombardment, J. Geophys. Res., 104, 16,827–16,842.
[30] Shao, Y., 2001 A model for mineral dust emission, J. Geophys. Res., 106, 20,239–20,254. [31] Shao, Y, 2004 Simplification of a dust emission scheme and comparison with data, J. Geophys.
Res., 109, doi:10.1029/2003JD004372.
[32] Callot, Y., B. Marticorena and G. Bergametti, 2000 Geomorphologic approach for modelling the surface features of arid environments in a model of dust emissions: application to the Sahara desert, Geodin. Acta, 13, 245-270.
[33] Tegen, I., S.P. Harrison, K. Kohfeld, I.C. Prentice, M. Coe and M. Heimann, 2002 Impact of vegetation and preferential source areas on global dust aerosol: Results from a model study, J. Geophys. Res., 107, doi: 10.1029/2001JD000963.
[34] Zender, C.S., D. Newman and O. Torres, 2003 Spatial heterogeneity in aeolian erodibility: Uniform, topographic, geomorphic, and hydrologic hypotheses, J. Geophys. Res., 108, D17, doi:10.1029/2002JD003039.
[35] Marticorena, B., P. Chazette, G. Bergametti, F. Dulac and M. Legrand, 2004 Mapping the aerodynamic roughness length of desert surfaces from the POLDER/ADEOS bi-directional reflectance product, Int. J. Remote Sens., 25, 603-626.
[36] Prigent C., I. Tegen, P. Aires, B. Marticorena and M. Zribi, 2005 Estimation of the aerodynamic roughness length in arid and semi-arid regions over the globe with the ERS scatterometer, J. Geophys. Res., 110, D09205, doi: 10.1029/2004JD005370.
[37] Laurent, B., B. Marticorena, G. Bergametti and F. Mei, 2006 Modeling mineral dust emissions from Chinese and Mongolian deserts, Global Planet. Change, 52, 1-4, 121-141.
[38] Laurent, B., B. Marticorena, G. Bergametti, J.F. Léon and N.M. Mahowald, 2008 Modeling mineral dust emissions from the Sahara desert using new surface and soil developments, J. Geophys. Res., doi:10.1029/2007JD009484.
[39] Chatenet, B., B. Marticorena, L. Gomes and G. Bergametti, 1996 Assessing the microped size distributions of desert soils erodible by wind, Sedimentology, 43: 901-911.
[40] Bergametti, G., B. Marticorena and B. Laurent, 2007 Key processes for dust emissions and their modeling, in Regional climate variability and its impacts in the Mediterranean area, A. Mellouki and A.R. Ravishankara (Eds.), Nato Science Series: IV: Earth and Environmental Sciences, 79, 326 pp.
WMO/GEO Expert Meeting on an International Sand and Dust Storm Warning System IOP Publishing IOP Conf. Series: Earth and Environmental Science 7 (2009) 012006 doi:10.1088/1755-1307/7/1/012006
[41] Mei, F., X. Zhang, H. Lu, Z. Shen and Y. Wang, 2004 Characterization of MASDs of surface soils in north China and its influence on estimating dust emission, Chin. Sci. Bull., 49, 2169– 2176.
[42] Greeley, R., D.G. Blumberg, J.F. McHone, A. Dobrovolski, J. Iversen, N. Lancaster, K.R. Rasmussen, S. Wall and B. White, 1997 Applications of spaceborne radar laboratory data to the study of aeolian processes, J. Geophys. Res., 102, 10,971-10,983.
[43] Laurent, B., B. Marticorena, G. Bergametti, P. Chazette, F. Maignan and C. Schmechtig, 2005 Simulation of the mineral dust emission frequencies from desert areas of China and Mongolia using an aerodynamic roughness length map derived from the POLDER/ADEOS 1 surface products, J. Geophys. Res., 110, D18S04, doi: 10.1029/2004JD005013.
[44] Marticorena, B., M. Kardous, G. Bergametti, Y. Callot, P. Chazette, H. Khatteli, S. Le Hégarat-Mascle, M. Maillé, J.L. Rajot, D. Vidal-Madjar and M. Zribi, 2006 Aeolian geometric and aerodynamic surface roughness in arid and semi-arid areas and their relation with radar backscatter coefficient, J Geophys. Res., 111, doi: 10.1029 /2006JF000462.
[45] Bouet, C., G. Cautenet, R. Washington, M.C. Todd, B. Laurent, B. Marticorena and G. Bergametti, 2007 Mesoscale modeling of aeolian dust emission during the BoDEx 2005 experiment, Geophys. Res. Lett., 34, L07812, doi:10.1029/2006GL029184.
[46] Westphal, D.L., O.B. Toon and T.N. Carlson, 1988 A case study of mobilization and transport of Saharan dust, J. Atmos. Sci., 45, 2145– 2175.
[47] Gillette, D.A. and R. Passi, 1988 Modeling dust emission caused by wind erosion, J. Geophys. Res., 93, 14,233-14,242.
[48] Cakmur, R.V., R.L. Miller and O. Torres, 2004 Incorporating the effect of small-scale circulations upon dust emission in an atmospheric general circulation model, J. Geophys. Res., 109, doi: 10.1029/2003JD004067.
[49] Shao, Y., Y. Yang, J. Wang, Z. Song, L.M. Leslie, C. Dong, Z. Zhang, Z. Lin, Y. Kanai, S. Yabuki and Y. Chun, 2003 Northeast Asian dust storms: Real-time numerical prediction and validation, J. Geophys. Res., 108, 4691, doi:10.1029/2003JD003667.
[50] Pérez, C., S. Nickovic, J.M. Baldasano, M. Sicard, F. Rocadenbosch and V.E. Cachorro, 2006 A long Saharan dust event over the western Mediterranean: Lidar, Sun photometer observations, and regional dust modeling, J. Geophys. Res., 111, D15214, doi:10.1029/2005JD006579.
[51] Heinold, B., I. Tegen, M. Esselborn, K. Kandler, P. Knippertz, D. Müller, A. Schladitz, M. Tesche, B. Weinzierl, A. Ansmann, D. Althausen, B. Laurent, A. Massling, T. Mueller, A. Petzold, K. Schepanski and A. Wiedensohler, 2008 Regional Saharan dust modelling during the SAMUM 2006 campaign, Tellus B, doi: 10.1111/j.1660-0889.2008.00387.
[52] Schepanski, K., I. Tegen, B. Laurent, B. Heinold and A. Macke, 2007 A new Saharan dust source activation frequency map derived from MSG-SEVIRI IR-channels, Geophys. Res. Lett., 34, L18803, doi:10.1029/2007GL030168.
[53] Middleton, N.J., 1989 Climatic controls on the frequency, magnitude and distribution of dust storms: examples from India/Pakistan, Mauritania and Mongolia, M. Leinen and M. Sarnthein (Eds.), Paleoclimatology and paleometeorology: Modern and past patterns of global atmospheric transport, Kluwer Academic Publ., Dordrecht, 97–132.
[54] Mahowald, N.M., J.A. Ballantine, J. Feddema and N. Ramankutty, 2007 Global trends in visibility: Implications for dust sources, Atmos. Chem. Phys., 7, 3309-3339.
WMO/GEO Expert Meeting on an International Sand and Dust Storm Warning System IOP Publishing IOP Conf. Series: Earth and Environmental Science 7 (2009) 012006 doi:10.1088/1755-1307/7/1/012006