HAL Id: halshs-01081458
https://halshs.archives-ouvertes.fr/halshs-01081458
Submitted on 7 Nov 2014HAL is a multi-disciplinary open access archive for the deposit and dissemination of sci-entific research documents, whether they are pub-lished or not. The documents may come from teaching and research institutions in France or abroad, or from public or private research centers.
L’archive ouverte pluridisciplinaire HAL, est destinée au dépôt et à la diffusion de documents scientifiques de niveau recherche, publiés ou non, émanant des établissements d’enseignement et de recherche français ou étrangers, des laboratoires publics ou privés.
The productivity impact of international technology
transfer in China: Empirical investigation on Chinese
regions
Adel Ben Youssef, Zhou Wei
To cite this version:
Adel Ben Youssef, Zhou Wei. The productivity impact of international technology transfer in China: Empirical investigation on Chinese regions. Economics Bulletin, Economics Bulletin, 2011, 32 (2), pp.1590-1603. �halshs-01081458�
The productivity impact of international technology transfer in China:
Empirical investigation on Chinese regions
Zhou WEI
University of Paris Sud and University of Wuhan
Adel BEN YOUSSEF
University of Nice Sophia-Antipolis and GREDEG
ABSTACT
This paper investigates the impact of international technology transfer through FDI and technology import on Chinese productivity by analyzing 28 Chinese province-level regions over the period 2001 to 2008. The findings show that technology import has significantly positive impact on Chinese regional productivity, while FDI has significantly negative impact.
1. Introduction
The role of technological knowledge in technology progress has been largely studied in the economic growth literature. Technological knowledge is of paramount importance for the continuous development of competitive advantage (Cantwell, 1991). Technological knowledge can be acquired by international technology transfer. Coe and Helpman (1995) consider that national productivity increases with the accumulation of both domestic and foreign knowledge. Technology transfer across countries is the source of foreign knowledge which is flowed mainly through Foreign Direct Investment (FDI) and technology import.
International technology transfer affects productivity of domestic firms in developing countries. FDI and technology import are considered as the two main channels of international technology transfer (Bin, 2008; Damijan et al., 2003; Yasar and Paul, 2007). The flow of FDI is the means through which technological knowledge can flow across national boundaries (Branstetter, 2006). Damijan et al. (2003) find that technology is being primarily transferred to local firms through direct foreign linkages. By importing technology and attracting multinational enterprises investment, firms in less developed countries attempt technology imitation from technology transfer and promote the development of productivity. This paper examines how different channels of international technology transfer affect Chinese regional productivity. International technology transfer through FDI and technology
import in China mainly takes place in Coastal area, so we investigate their productivity impact with regional data. China is the largest developing economy which has 31 provincial-level regions. It is widely known that Chinese economy is affected by strong regional disparities. GDP in Coastal area, Central area and Western area are around 60%, 23% and 17% of total GDP, respectively. The persistence of geographical disparities and the regional distribution of international technology transfer in China motivated this paper to investigate further the impact of international technology transfer on Chinese regional productivity. Using a balanced panel, we analyze to what extent FDI and technology import influence the productivity of Chinese regions. Our paper analyzes above questions with a balanced panel data on 28 Chinese regions from 2001 to 2008.
The paper is organized as follows. Section 2 presents the review of literature. Section 3 highlights model specification. Section 4 briefly describes the data we used in this paper and the proxies for the relevant variables. Section 5 discusses the empirical results. Section 6 concludes.
2. Review of Literature
FDI and technology import are considered as the main channels of international technology transfer in empirical literature. A number of empirical studies have examined the relationship between productivity and international technology transfer through FDI. A strand of literature draws the conclusion that FDI has positive effect on the productivity of local firms (Driffield, 2001; Lee, 2006; Todo, 2006). Driffield (2001) demonstrates that productivity growth in domestic firms is mainly generated by productivity advantages of foreign-owned firms. Lee (2006) indicates that international knowledge spillovers through FDI have significant and positive impact on productivity. Todo (2006) considers that knowledge spillovers from foreign-owned enterprises to domestically-owned firms through FDI are often regarded as a source of technical progress and productivity growth in the host country. Yasar and Paul (2007) indicate that plants in the industries with more international linkages have higher productivity levels. They find that FDI has positively effect on plant-level productivity. Blalock and Gertler (2008) test the hypothesis that the technology transfer of multinational firms operating in host-country markets can increase the productivity of local suppliers. They find strong evidence of productivity gains due to both greater competition and lower prices among local firms which supply foreign entrants.
However, some empirical papers demonstrate that FDI can contribute to domestic productivity growth only when the technology gap between domestic and foreign firms is not too large and when a sufficient absorptive capacity is available in domestic firms (Borensztein et al., 1998; Kinoshita, 2000; Kokko, 1994). So absorptive capacity, which is defined as a firm‟s ability to “recognize the value of new external knowledge, assimilate it, and apply it to commercial ends” (Cohen and Levinthal, 1990:128), plays an important role in international technology transfer. Moreover, the productivity impact of international technology transfer through FDI is an important study which has no consistent conclusion in the literature. In particular, Damijan and al. (2003) consider that FDI do not generate positive intra-industry spillovers for domestic firms, while the spillovers from foreign to domestic firms are negative or insignificant. Haddad and Harrison (1993) find a weak negative
correlation between plant total factor productivity growth and the presence of foreign firms in the sector by using the data on Moroccan manufacturing plants in the period 1985-1989. Aitken and Harrison (1999) find that the productivity growth of domestic plants is negatively correlated with foreign presence in the sector by using the data on Venezuelan manufacturing plants in the period 1976-1989. Hanson (2001) indicates there is weak evidence that FDI generates positive spillovers for host economies.
Another strand of empirical literature has focused on the impact of technology import on productivity. Coe and Helpman (1995) and Coe et al. (1997) consider that a country that is more open to technology import derives greater benefits from foreign R&D. Furthermore, it is shown empirically that the countries which have experienced faster growth in total factor productivity have imported more from the world‟s technology leaders (Texeira and Fortuna, 2010). Hasan (2002) examines the effect of imports of disembodied technologies on productivity by panel data on 286 Indian manufacturing firms. His analysis shows that it is positive and significant impact of foreign technology import on firm productivity. The empirical result of Yasar and Paul (2007) finds that technology import is significantly and positively related to productivity. Moreover, imported technology is expected to have a positive effect on the host country‟s productivity (Teixeira and Fortuna, 2010).
Recently a new literature has attempted to demonstrate the importance of FDI and technology import on Chinese economic growth. Branstetter and Chen (2006) conduct an empirical analysis of the impact of R&D spending and purchases of foreign technology on productivity in Taiwanese industry. Their empirical results suggest that the impact of foreign technology imports on productivity growth at the plant level is positive and significant. Based on an industry-level analysis of CLMIE1 over the period 1996-2001, Bin (2008) investigates the contributions of different technology acquisition channels to productivity. His empirical results indicate that foreign technology transfer makes significant contributions to productivity in Chinese manufacturing industries. Girma and Gong (2008) focus on the impact of FDI on state-owned firms. They suggest that FDI has a positive effect on state-owned firms with foreign capital in productivity. Girma and Gong (2008) also consider that the increased competition caused by FDI has a negative impact on State owned firms without foreign capital. Motohashi and Yuan (2010) show that technology import as formal technology acquisition channel has positive productivity impact. However, few empirical works have studied the impact of international technology transfer on Chinese regional productivity. Kuo and Yang (2008) use the data on 31 of Chinese regions over the 1996-2004 period to assess how and to what extent knowledge capital and technology spillovers contribute to regional economic growth in China. Their empirical results show that technology import contributes significantly and positively to regional economic growth, while the impact of FDI is insignificant. Based on the research of Kuo and Yang (2008), our paper further examines the impact of international technology transfer on Chinese productivity with 28 regions in the period from 2001 to 2008.
3. Model Specification
1
In order to analyze the productivity impact of international technology transfer for region j at year t we use the following production functions:
Yjt=Ajtƒ(Kjt, Ljt) (1)
Where Y is output, K is the stock of fixed capital, L is labor input measured by the number of employees and A denotes the technology parameter. We assume that A is a function of the stock of R&D capital, as well as international technology transfer through FDI and technology import:
Ajt=ƒ (RDjt, FDIjt,TIMjt) (2)
In Eq.(2), RD represents R&D stock, FDI represents cumulate foreign direct investment, and TIM represents the stock of technology import.
In line with previously empirical work (Bronzini and Piselli, 2009; Kuo and Yang, 2008), we assume that the production function for regional economy can be approximated by a Cobb-Douglas functions. Combining Eqs. (1) and (2), the model becomes:
Yjt = Kαjt LβjtRDφjt FDIγjtTIMδjteujt (3)
As usual, to implement the estimation of the Cobb-Douglas function, we take logarithm and obtain the following linear regression equation.
lnYjt=αlnKjt+βlnLjt+φlnRDjt+γlnFDIjt+δlnTIMjt+ujt (4)
Here Yjt is the output of region j in year t. Terms L and K are the two key physical inputs
which refer to labor input and fixed capital stock, respectively. L jt is measured as the total
number of employees in j region in t year, measured in 10 thousands persons; Kjt is the stock
of fixed capital in j region and t year, and its calculation will be discussed in next section. Here ujt has two components as follows,
ujt= αj+εjt (5)
αj is an individual-specific effect, it includes any errors in the specification which arise
because regions have different production functions (or because Chinese regions have different inputs and economic development levels as shown in the last section), and εjt is an
idiosyncratic error.
The objective of this study is to investigate the impact of FDI and technology import on regional productivity. FDIjt is measured by the cumulate investment amount of
foreign-funded enterprises in j region and t year. And TIMjt is the stock of the amount of
foreign technology import in j region and t year. FDI and technology import are considered as two external sources of technological knowledge. In the model (4), the parameters denote the elasticity, i.e. the percentage change in productivity for a given percentage change in the corresponding explanatory variable.
The data used in this study include 282 Chinese regions over the 2001-2008 period, yielding 224 observations. We choose the sample period from 2001 to 2008 due to the following reasons. Firstly, China entered WTO at the end of 2001, which intensifies international linkages between China and other countries. Since 2002, trade barriers were cut rapidly, which promotes the development of FDI and technology import in China. As a result, international technology transfer through the two channels increased significantly. Secondly, the data of technology import in each region is available from 2001.
The data contains detailed information of each region: the gross value of output in current prices and output deflators, the current value of fixed assets investment and the price index for fixed assets, the workforce, the R&D expenditures, the accumulative investment amount of foreign-funded enterprises (FDI), and the expenditures of technology import (TIM). It should be pointed out that all monetary variables in our regression analysis are measured in 100 million Yuan, and deflated to control the influence of price inflation by taking 2000 as the base year. Output is deflated by output deflators. The deflator used in calculating fixed capital stocks are the price indices of investment in fixed assets (Bin, 2008; Tuan et al., 2009), and the expenditure of R&D and FDI are deflated by ex-factory prices of industrial products (Bin, 2008). Technology import is deflated it by the output price deflator (Branstetter and Chen, 2006). All of the deflators are taken from China statistical Yearbook. The majority of the original data are collected from China Statistical Yearbook 2002-2009, the expenditures of R&D, FDI and technology import are available from China Statistical Yearbook on
Science and Technology 2002-2009.
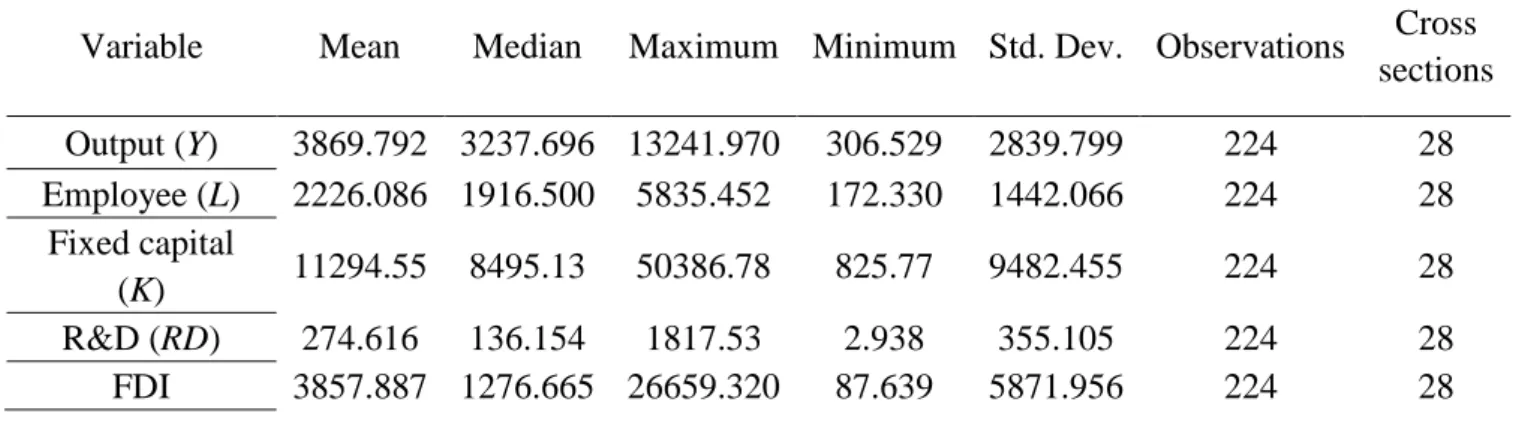
There is no published data on fixed capital stock (K) at the region level and only statistics on annual total investment of fixed assets is available. Therefore, we construct fixed capital stock with the following methods. First, we deflate the nominal value of newly added fixed assets in each year by a price index of investment in fixed assets (Liu, 2002), which is the regional price index taken from China Statistical Yearbook. Second, following Kuo and Yang (2008), the fixed capital stock is calculated using the flows of fixed capital investment according perpetual inventory method. With the same way, the stock of technology import and R&D is calculated. The descriptive statistics is shown in Table 1.
Table 1 The Descriptive Statistics of Variables
Variable Mean Median Maximum Minimum Std. Dev. Observations Cross sections Output (Y) 3869.792 3237.696 13241.970 306.529 2839.799 224 28 Employee (L) 2226.086 1916.500 5835.452 172.330 1442.066 224 28 Fixed capital (K) 11294.55 8495.13 50386.78 825.77 9482.455 224 28 R&D (RD) 274.616 136.154 1817.53 2.938 355.105 224 28 FDI 3857.887 1276.665 26659.320 87.639 5871.956 224 28
2 Although there are 31 regions in China, Tibet, Inner Mongolia and Qinghai regions have been excluded due to the data of
technology import is zero in several years during 2001-2008. For example, the technology import of Tibet is zero from 2001 to 2007. And all the variables are logarithmic form, so we analyze the regional economy without these three regions.
Technology
import (TIM) 136.029 32.045 1953.567 0.0699 281.473 224 28 Note: The stocks of fixed capital, R&D and technology import are calculated as described in this section. The unit of monetary is 100 million Yuan, and the unit of employee is 10 thousand persons.
5. Empirical Results
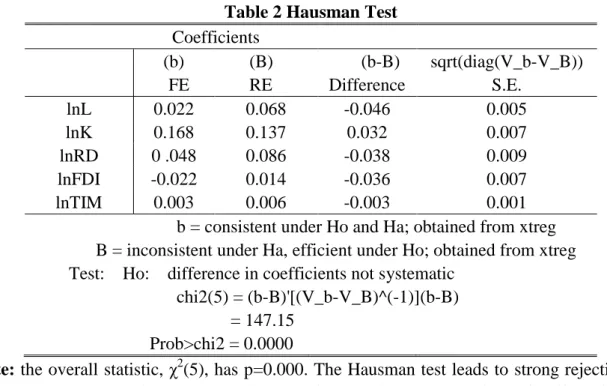
We have used Eq.(4) to estimate the impacts of two channels of international technology transfer (FDI and technology import) on Chinese regional productivity. The Hausman specification test is employed in order to determine whether fixed-effects (FE) or random-effects (RE) model is appropriate (Bin, 2008). As shown in Table 2, the overall statistic, χ2(5), has p=0.000. The Hausman test leads to strong rejection of the null hypothesis that RE provides consistent estimates, so FE is the fit effects for our model.
However, there is a potential endogeneity problem between variables in technology level function and economic growth (Kuo and Yang, 2008). If foreign firms are attracted to regions which benefit from agglomeration economies or better infrastructure, the impact of location-specific foreign investment on productivity could be overestimated (Aitken and Harrison, 1999). We account for the potential endogeneity issues by estimating our empirical model using two-stage least squares with instrument variables (Lin and Ma, 2012). We do not use the Olley-Pakes or Levinsohn-Petrin adjustments to address the endogeneity of inputs due to a lack of data. In Eq.(4), L, K, RD, FDI and TIM are possibly endogenous. Following Lin and Ma (2012), we use a one-period lag of labor as instrument variable of L. An intermediate input, the electricity of j region used during t year (Ejt) is used as an instrument of Kjt
(Ackerberg et al., 2006). The number of patents j region has applied in t year, Pjt, is used as
instruments of RDjt (Hu, 2001). The lagged FDI is used as the instrument variables for FDI.
At the same time, we introduce proxy variables which reflect regional productivity (Aitken and Harrison, 1999) to eliminate the possible endogeneity problems of FDI and TIM. One such variable is the total length of highways (RO3) of each region, which could reflect locational advantages such as infrastructural differences. Another factor which can be used to capture exogenous differences in productivity across regions in China is a policy variable, the numbers of the lagged special economic zones (Z) 4. There are some exemptions and reductions of profits taxes, import duties, consolidated industry and commerce taxes and land use fees in these special economic zones (Cheng and Kwan, 2000). To allow time lag for the policy variables to have an impact, the lagged values (Z) are used in the econometric analysis (Cheng and Kwan, 2000).
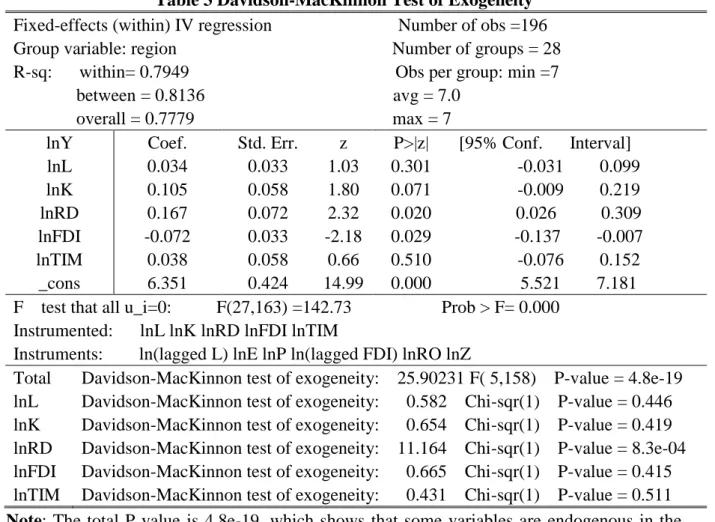
We implement Davidson-MacKinnon test of exogeneity to test whether L, K, RD, FDI and TIM are endogenous. The last part of Table 3 is the results of Davidson-MacKinnon test of exogeneity. The total P value is 4.8e-19, which shows that some variables are endogenous in our model. Then we do Davidson-MacKinnon test of exogeneity for each variable, only the test of RD leads to strong rejection of the null hypothesis that RD is exogenous. So among L,
3
RO is measured by km/km2 of land mass (Cheng and Kwan, 2000).
4 The numbers of special economic zone is the sum of the numbers of Economic and Technological Development Zones
(ETDZ), New and High-tech Industrial Development Zones (NHIDZ), Free Trade Zones (FTZ) and Export Processing Zones (EPZ).
K, RD, FDI and TIM, only RD is endogenous. Finally, we do fixed-effects estimation with
instrumental variables to solve the endogeneity of RD. Pjt and lagged FDI are used as
instruments of RDjt, because a large number of R&D labs are established by FDI in China
(von Zedtwitz, 2004). The first-stage regression (Table 4) has explanatory power, and the coefficients of lnP and ln(lagged FDI) are highly statistically significant. The values of Shea Partial R2 and Partial R2 indicate that the instrument variables we used are not weak instruments. The Sargan test in Table 5 shows that the instrument variables are valid. When the endogeneity of RD is addressed, the coefficient of region FDI is significantly negative. It is consistent with the recent researches (Aitken and Harrison, 1999; Hu and Jefferson, 2002; Konings, 2001; Xu and Sheng, 2011) which pay attention to the endogeneity of the inputs in production function.
Why the impact of FDI on Chinese regional productivity is significantly negative? There are two main explanatory reasons.The first one relies to the „competition effects‟ explanation of Aitken and Harrison (Hu and Jefferson, 2002). Multinationals may cut into the market share of domestic firms without FDI, because multinationals have lower marginal costs due to their firm-specific advantage, which allows them to attract demand away from domestic firms, thus forcing the domestic firms to reduce production (Görg and Greenaway, 2004). Therefore, foreign firms may reduce the productivity of domestic firms through competition effects (Aitken and Harrison, 1999; Görg and Greenaway, 2004; Konings, 2001). The second explanatory reason relies to the „technology gap‟ explanation supported by the following empirical literature (Borensztein et al., 1998; Glass and Saggi, 1998; Görg and Greenaway, 2004; Kinoshita, 2000; Kokko, 1994). They find that only when the technology gap between domestic firms and multinationals is not too large and when domestic firms have sufficient absorptive capacity, FDI can promote domestic productivity. Moreover, the greater the technology gap is, the less is the likelihood that domestic firms have the enough ability to adopt the transferred technologies, or at least adopt them successfully (Harris and Robinson, 2004). Girma (2005) finds that there is a minimum absorptive capacity threshold level below which productivity spillovers from FDI are negligible or even negative. Moreover, it can not be ignored that the technology gap between China and developed countries is still large, and some Chinese domestic companies have no enough absorptive capacity to learn the technologies transferred from FDI. Due to the „competition effects‟ and „technology gap‟ explanation, the impact of FDI on Chinese regional productivity is significantly negative in short period.
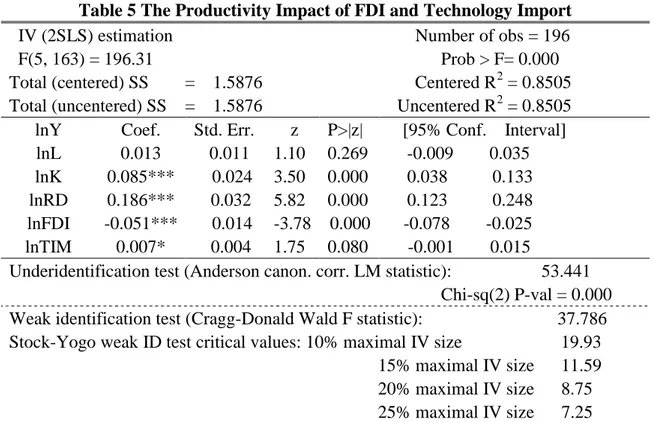
In addition, our results on the relationship between regional productivity and technology import appear in line with previous findings (Branstetter and Chen, 2006; Kuo and Yang, 2008; Yasar and Paul, 2007). In IV estimate (Table 5), the impact of technology import on Chinese regional productivity is positive and significant. Technology import is an important source to acquire external technology which is developed by advanced countries. Regional productivity can be improved by absorbing and utilizing the imported technology. However, the elasticity of technology import is low. The benefit of technology import to large extent depends on the absorptive capacity and innovative ability of the recipient. Lai et al. (2009) consider that it is not advisable for developing countries to import the most advanced technology since it is hard to absorb them, and only when the domestic technology level is appropriate to the imported technology, the best benefits can be shared. Therefore, in order to
enhance the contribution of technology import on productivity, Chinese domestic companies should import the technologies which are appropriate to their technological level.
6. Conclusions
This paper analyzes the productivity impact of international technology transfer through FDI and technology import in China, at the regional level, from 2001 to 2008. Our empirical analysis shows that FDI has significant and negative impact on Chinese regional productivity in 2001-2008 period, and technology import has significant and positive impact. Two main explanatory effects are stressed: „Competition effects‟ and „technology gap‟. Together they explain the negative impact of FDI on Chinese productivity and why technology import contributes greatly on Chinese productivity.
Table 2 Hausman Test
Coefficients (b) (B) (b-B) sqrt(diag(V_b-V_B)) FE RE Difference S.E. lnL 0.022 0.068 -0.046 0.005 lnK 0.168 0.137 0.032 0.007 lnRD 0 .048 0.086 -0.038 0.009 lnFDI -0.022 0.014 -0.036 0.007 lnTIM 0.003 0.006 -0.003 0.001 b = consistent under Ho and Ha; obtained from xtreg B = inconsistent under Ha, efficient under Ho; obtained from xtreg Test: Ho: difference in coefficients not systematic
chi2(5) = (b-B)'[(V_b-V_B)^(-1)](b-B) = 147.15
Prob>chi2 = 0.0000
Note: the overall statistic, χ2(5), has p=0.000. The Hausman test leads to strong rejection of the null hypothesis that RE provides consistent estimates, so FE is the fit effects for our model.
Table 3 Davidson-MacKinnon Test of Exogeneity
Fixed-effects (within) IV regression Number of obs =196 Group variable: region Number of groups = 28 R-sq: within= 0.7949 Obs per group: min =7 between = 0.8136 avg = 7.0
overall = 0.7779 max = 7
lnY Coef. Std. Err. z P>|z| [95% Conf. Interval] lnL 0.034 0.033 1.03 0.301 -0.031 0.099 lnK 0.105 0.058 1.80 0.071 -0.009 0.219 lnRD 0.167 0.072 2.32 0.020 0.026 0.309 lnFDI -0.072 0.033 -2.18 0.029 -0.137 -0.007 lnTIM 0.038 0.058 0.66 0.510 -0.076 0.152 _cons 6.351 0.424 14.99 0.000 5.521 7.181 F test that all u_i=0: F(27,163) =142.73 Prob > F= 0.000
Instrumented: lnL lnK lnRD lnFDI lnTIM
Instruments: ln(lagged L) lnE lnP ln(lagged FDI) lnRO lnZ
Total Davidson-MacKinnon test of exogeneity: 25.90231 F( 5,158) P-value = 4.8e-19 lnL Davidson-MacKinnon test of exogeneity: 0.582 Chi-sqr(1) P-value = 0.446 lnK Davidson-MacKinnon test of exogeneity: 0.654 Chi-sqr(1) P-value = 0.419 lnRD Davidson-MacKinnon test of exogeneity: 11.164 Chi-sqr(1) P-value = 8.3e-04 lnFDI Davidson-MacKinnon test of exogeneity: 0.665 Chi-sqr(1) P-value = 0.415 lnTIM Davidson-MacKinnon test of exogeneity: 0.431 Chi-sqr(1) P-value = 0.511
Note: The total P value is 4.8e-19, which shows that some variables are endogenous in the
model. In Davidson-MacKinnon test of exogeneity for each variable, only the test of
RD leads to strong rejection of the null hypothesis that RD is exogenous. So among L, K, RD, FDI and TIM, only RD is endogenous.
Table 4 The First-Stage Regression of IV (2SLS) Estimation
First-stage regressions Number of obs = 196 F(6, 162) = 187.58 Prob > F= 0.000 Total (centered) SS = 23.617 Centered R2 = 0.8742 Total (uncentered) SS = 23.617 Uncentered R2 = 0.8742
lnRD Coef.
Std.
Err. t P>|t| [95% Conf. Interval] lnL 0.026 0.041 0.64 0.525 -0.055 0.107 lnK 0.374 0.049 7.56 0.000 0.276 0.471 lnFDI 0.116 0.049 2.37 0.019 0.019 0.213 lnTIM -0.006 0.014 -0.44 0.662 -0.035 0.022 lnP 0.381 0.049 7.65 0.000 0.282 0.479 ln(lagged FDI) 0.122 0.057 2.16 0.032 0.011 0.234 Included instruments: lnL lnK lnFDI lnTIM lnP ln(lagged FDI)
Summary results for first-stage regressions
lnRD 0.3181 0.3181 37.79 0.000 Underidentification tests
Ho: matrix of reduced form coefficients has rank=K1-1 (underidentified) Ha: matrix has rank=K1 (identified)
Anderson canon. corr. N*CCEV LM statistic Chi-sq(2)=53.44 P-val=0.000 Cragg-Donald N*CDEV Wald statistic Chi-sq(2)=78.37 P-val=0.000 Weak identification test
Ho: equation is weakly identified
Cragg-Donald Wald F-statistic 37.79 See main output for Cragg-Donald weak id test critical values
Note: the first-stage regression has explanatory power, and the coefficients of lnP and ln(lagged FDI) are highly statistically significant. The values of Shea Partial R2 and Partial R2 indicate that the instrument variables are not weak instruments.
Table 5 The Productivity Impact of FDI and Technology Import
IV (2SLS) estimation Number of obs = 196 F(5, 163) = 196.31 Prob > F= 0.000 Total (centered) SS = 1.5876 Centered R2 = 0.8505 Total (uncentered) SS = 1.5876 Uncentered R2 = 0.8505 lnY Coef. Std. Err. z P>|z| [95% Conf. Interval] lnL 0.013 0.011 1.10 0.269 -0.009 0.035 lnK 0.085*** 0.024 3.50 0.000 0.038 0.133 lnRD 0.186*** 0.032 5.82 0.000 0.123 0.248 lnFDI -0.051*** 0.014 -3.78 0.000 -0.078 -0.025 lnTIM 0.007* 0.004 1.75 0.080 -0.001 0.015
Underidentification test (Anderson canon. corr. LM statistic): 53.441 Chi-sq(2) P-val = 0.000 Weak identification test (Cragg-Donald Wald F statistic): 37.786 Stock-Yogo weak ID test critical values: 10% maximal IV size 19.93 15% maximal IV size 11.59 20% maximal IV size 8.75 25% maximal IV size 7.25 Source: Stock-Yogo (2005). Reproduced by permission.
Sargan statistic (overidentification test of all instruments): 0.982 Chi-sq(1) P-val =0.3217 Instrumented: lnRD
Included instruments: lnL lnK lnFDI lnTIM Excluded instruments: lnP ln(lagged FDI)
* Significant at the 10% level, ** Significant at the 5% level, *** Significant at the 1% level. Note: the Sargan test shows that the instrument variables are valid.
References
Ackerberg, D., A., Caves, K., Frazer, G. (2006) “Structural identification of production functions” UCLA working paper.
Bin, G. (2008) “Technology acquisition channels and industry performance: An industry-level analysis of Chinese large- and medium-size manufacturing enterprises”
Research Policy 37, 194-209.
Blalock, G. and Gertler, P.J. (2007) “Welfare gains from Foreign Direct Investment through technology transfer to local suppliers” Journal of International Economics 74, 402-421.
Branstetter, L.G. (2006) “Is foreign direct investment a channel of knowledge spillovers? Evidence from Japan‟s FDI in the United States” Journal of International
Economics 68, 325-344.
Branstetter, L.G. and Chen, J. (2006) “The impact of technology transfer and R&D on productivity growth in Taiwanese industry: Microeconometric analysis using plant and firm-level data” Journal of the Japanese and International Economies 20, 177-192.
Borensztein, E., De Gregorio, J., and Lee, J.W. (1998) “How does foreign direct investment affect economic growth?” Journal of International Economics 45, 115-135.
Bronzini, R., and Piselli, P. (2009) “Determinants of long-run regional productivity with geographical spillovers: The role of R&D, human capital and public infrastructure” Regional
science and Urban Economics 39, 187-199.
Cameron, A., C., Trivedi, P., K., 2010. Microeconometrics Using Stata, The United Stated, Stata Press.
Cantwell, J. (1991) “The theory of technological competence and its application to international production” in D. G. McFetridge (Ed.), Foreign investment, technology and
economy growth, Calgary: University of Calgary Press.
Cheng, L., K., and Kwan, Y., K. (2000) “What are the determinants of the location of foreign direct investment? The Chinese experience” Journal of International Economics 51, 379–400.
Coe, D., and Helpman, E. (1995) “International R&D spillovers” European Economic
Review 39, 859-887.
Coe, D.T., Helpman, E., and Hoffmaister, A.W. (1997) “North and South spillovers”
Economic Journal 107, 134-149.
Cohen, W.M., and Levinthal, D.A. (1990) “Absorptive capacity: A new perspective on learning and innovation” Administrative Science Quarterly 35, 128-152.
Damijan, J.P., Knell, M., Majcen, B., and Rojec, M. (2003) “The role of FDI, R&D accumulation and trade in transferring technology to transition countries: evidence from firm panel data for eight transition countries” Economic Systems 27, 189-204.
Djankov, S. (2000) “Knowledge transfer under subcontracting: evidence from Czech firms” World Development 28, 1837-1847.
Driffield, N. (2001) “The impact on domestic productivity of inward investment in the UK” The Manchester School 69, 103-119.
Girma, S. (2005) “Absorptive capacity and productivity spillovers from FDI: A threshold regression analysis” Oxford Bulletin of Economics and Statistics 67, 281-306.
Girma, S., and Gong, Y. (2008) “Putting people first? Chinese state-owned enterprises‟ adjustment to globalization” International Journal of Industrial Organization 26, 573-585.
Görg, H., and Greenaway, D. (2004) “Much Ado about nothing? Do domestic firms really benefit from foreign direct investment?” The World Bank Research Observer 19, 171-197.
Hall, B.H., and Mairesse, J. (1995) “Exploring the relationship between R&D and productivity in French manufacturing firms” Journal of Econometrics 65, 263-293.
Hanson, G. (2001) “Should Countries promote Foreign Direct Investment?” G-24 discussion paper series, no. 9, Centre for International Development, Harvard University, Harvard.
Harris, R., and Robinson, C. (2004) “Productivity impacts and spillovers from foreign owenship in the United Kingdom” National Institute Economic Review 187, 58-75.
Hasan, R. (2002) “The impact of imported and domestic technologies on the productivity of firms: panel data evidence from Indian manufacturing firms” Journal of
Development Economics 69, 23-49.
Hu, A.G.Z., and Jefferson, G.H. (2002) “FDI impact and spillover: evidence from China‟s electronic and textile industries” The World Economy 25, 1063-1076.
Kaneko, S., and Managi, S. (2004) “Environmental productivity in China” Economics
bulletin 17, 1-10.
Kinoshita, Y. (2000) “R&D and technology spillovers via FDI: innovation and
absorptive capacity” Mimeo, CERGE-EI.
Kokko, A. (1994) “Technology, market characteristics and spillovers” Journal of
Development Economics 43, 279-293.
Konings, J. (2001) “The effects of foreign direct investment on domestic firms: evidence from firm-level panel data in emerging economics” Economics of Transition 9, 619-633.
Kuo, C.C., and Yang, C.H. (2008) “Knowledge capital and spillover on regional economic growth: Evidence from China” China Economic Review 19, 594-604.
Lai, M, Wang, H., and Zhu, S. (2009) “Double-edged effects of the technology gap and technology spillovers: Evidence from the Chinese industrial sector” China Economic Review
20, 414–424.
Lee, G. (2006) “The effectiveness of international knowledge spillover channels”
European Economic Review 50, 2075-2088.
Lin, S., Ma, A.C. (2012) “Outsourcing and productivity: Evidence from Korean data”
Liu, Z. (2002) “Foreign direct investment and technology spillovers: Evidence from China” Journal of Comparative Economics 30, 579-602.
Motohashi, K., and Yuan, Y. (2010) “Productivity impact of technology spillover from multinationals to local firms: Comparing China‟s automobile and electronics industries”
Research Policy 39, 790-798.
Mundlak, Y. (1961) “Empirical Production Function Free of Management Bias” Journal
of Farm Economics 43, 44-56.
O‟Mahony, M., and Vecchi, M. (2009) “R&D, knowledge spillovers and company productivity performance” Research Policy 38, 35-44.
Teixeira, A.A.C., and Fortuna, N. (2010) “Human capital, R&D, trade, and long-run productivity: Testing the technological absorption hypothesis for the Portuguese economy, 1960-2001” Research Policy 39, 335-350.
Todo, Y. (2006) “Knowledge spillovers from foreign direct investment in R&D: Evidence from Japanese firm-level data” Journal of Asian Economics 17, 996-1013.
Tuan, C., Ng, L., F., Y., and Zhao, B. (2009) “China‟s post-economic reform growth: The role of FDI and productivity progress” Journal of Asian Economics 20, 280-293.
Von Zedtwitz, M. (2004) “Managing foreign R&D laboratories in China” R&D
Management 34, 439-452.
Xu, X., and Sheng, Y. (2011) “Productivity spillovers from foreign direct investment: firm-level evidence from China” World Development 40, 62-74.
Yasar, M., and Paul, C.J.M. (2007) “International linkages and productivity at the plant level: Foreign direct investment, exports, imports and licensing” Journal of International