XIII. COMMUNICATIONS BIOPHYSICS
Prof. W. A. Rosenblith Dr. R. D. Halltt J. W. Davisftt
Prof. M. Eden Dr. N. Y-S. Kiang N. Gothard
Prof. M. H. Goldstein, Jr. Dr. T. T. Sandel** J. L. Hall, II Prof. W. T. Peake Dr. D. C. Teasj$ R. G. MarkSt$ Prof. W. M. Siebert Dr. Eda Berger Vidale C. E. Molnar**** Dr. J. S. Barlowt Dr. T. Watanabe*** Clare Monck Dr. M. A. B. Brazierl Aurice V. Albert D. F. O'Brien
W. A. Clark--: J. Allen C. E. Robinson
Dr. B. G. Farley**' R. M. Brown R. W. Rodieck Margaret Z. Freeman J. F. Buoncristiani G. Svihula
Dr. G. L. Gerstein T. F. Weiss
A. EVOKED CORTICAL RESPONSES AS A FUNCTION OF "STATE" VARIABLES
Electrical responses evoked by sensory stimuli and recorded with gross electrodes placed in different locations of the nervous system have been of great interest to electrophysiologists for many years. The use of implanted electrodes for recording the electrical activity from unanesthetized preparations has made possible parallel electro-physiological and behavioral studies. A recent report1 has stated that in unanesthetized cats the evoked cortical response to an acoustic click consists of several components. One of these components, termed ER 1,. corresponds to the evoked response from the classical barbituate-anesthetized preparation. The data reported here are part of a study in which it is attempted to relate the components of the evoked response complex (ERC) to that which may be loosely termed the "state" variables of the organism.
Electrodes (nichrome steel of approximately 100 mu, encased in Teflon) were implanted through small holes drilled in the skull over Al (left side), in the frontal sinus, and in the neck muscle. The electrode in the frontal sinus provided a reference for the electrode in AI, from which the evoked responses were recorded. The neck electrode, also referred to frontal sinus (or to another neck electrode), provided a monitor of the
This work was supported in part by the U. S. Air Force under Contract AFl9(60Z)-4112.
tResearch Associate in Communication Sciences from the Neurophysiological Laboratory of the Neurology Service of the Massachusetts General Hospital.
lVisiting Professor in Communication Sciences from the Brain Research Institute, University of California at Los Angeles.
Staff Member, Lincoln Laboratory, M. I. T.
ttPostdoctoral Fellow of the National Institute of Mental Health.
"fPostdoctoral Fellow of the National Institute of Neurological Diseases and Blindness.
***Research Associate in Communication Sciences; also at the Massachusetts Eye and Ear Infirmary. tttNational Science Foundation Cooperative Fellow.
"INational Science Foundation Graduate Fellow. Staff Associate, Lincoln Laboratory, M. I. T.
(XIII. COMMUNICATIONS BIOPHYSICS)
electric activity in the neck muscle.
During the recording sessions the animal was mildly restrained by putting him into a loosely fitting bag with a drawstring at each end. The animal's head and tail protruded and the width of the bag was such that although he could not stand, he could lie ably in a V-shaped trough. The animal usually remained quiet, appeared to be comfort-able, and did not struggle to get free from the bag.
Light flexible leads were soldered to the electrodes, and the leads were then
connected to the preamplifiers. The output of the amplifiers was recorded on magnetic
tape and was also continuously monitored during the course of the experiment with two
dual-beam oscilloscopes. Auditory stimuli were delivered through a loud-speaker
directly in front of the animal's head, approximately 8 inches from his nose. For the
data reported here, clicks were generated by delivering a 0. l-msec square pulse to the loud-speaker.
During a recording session one can detect changes in state by observing the various electrophysiological responses. When the animal is "awake," the voltage on the neck lead is relatively high and the cortical record (ECG) shows low-voltage, fast activity. In "deep sleep" the voltage from the neck muscle drops below the noise level of the
amplifiers and one sees only small twitches2' 3
occurring irregularly. The ECG also
shows low-voltage, fast activity in this state. There is an intermediate state in which the voltage from the neck muscle is moderately high and in which slow waves predomi-nate in the ECG. This intermediate state may be called "light sleep."
Since the waveforms of the responses differ with the "state" of the animal, indis-criminate averaging of responses is not meaningful. After each recording session, the tape records are played back into an Offner Dynagraph. Sections of this monitor record
are then selected for homogeneity. Evoked responses are then averaged over these
homogeneous sections of the monitor-record. Within these sections, which are consid-ered homogeneous from the monitor records, the single evoked responses are similar. That is, homogeneity with respect to the neck muscle activity and the on-going cortical activity correlates well with homogeneity of evoked responses when they are considered in more detail and on a shorter time scale.
Figure XIII-1A shows an average of 64 cortical responses computed for the beginning of a recording session. Figure XIII-2A shows a section of the monitor, the ink-written record, from the AI and also from the neck, both referred to the frontal electrode. The averaged response has an initial surface-positive peak, a second smaller positivity, followed by a longer-lasting negative deflection. Since the Al/frontal recording for this "state" is relatively free of background activity, this waveform is visible, even in single traces on the oscilloscope.
At present, a further partitioning and definition of "state" variables requires a
specification of duration of exposure to the stimulus. Some investigators4
NAIVE AWAKE -IABITUATED LIGHT SLEEP DEEP SLEEP NEMBUTAL
Fig. XIII-1. Averaged evoked responses (N=64) to an acoustic click recorded
from auditory cortex (A1). Reference electrode is in the frontal
sinus. Note the changes in form of the averaged response as a function of "state." Stimulus rate, 1/sec.
173
----N/FS AWAKE NAIVE AI/FS N/N A, /FS AWAKE HABITUATED N/FS A,/FS LIGHT SLEEP N/FS N/N A /FS DEEP SLEEP N/FS
NEMBUTAL I sec
;o100
ov
A/FS
Fig. XIII-Z. Samples from monitor records. (N/FS, neck with respect to frontal
sinus; N/N, neck with respect to another electrode also in the neck
muscle; A1/FS, auditory cortex (A1) with respect to frontal sinus.)
Notice the quiet base line for N/N in sample labeled "sleep." The samples are selected from the section of tape over which the respec-tive averages are taken.
,~..~,*1 u~ylil~Jjii *u i~U1.~ YnulJ.IW -L.I .Il I~I~ I~Y .**yyly:~*11YyW.Y.~Yil~ Y ~'
..- --
(XIII. COMMUNICATIONS BIOPHYSICS)
a high degree of lability of the evoked response from the unanesthetized animal. After prolonged, unchanging stimulation, the evoked response is said to decline in magnitude and even to disappear entirely. After behavioral arousal, brought about by a change in the stimulus, or by some other alteration in the animal's immediate environment, the response is said to reappear. This "state" is referred to as "habituated." Our animal was exposed to a click stimulus at a rate of 1/sec for a period of more than 24 hours. During the 24 hours, preceding the beginning of recording, the animal was able to move freely in the soundproof room, that is, he was not "wired-in" to the amplifiers. Fol-lowing this initial 24-hour period, he was placed in the canvas bag, the electrodes were connected, and responses were recorded for approximately 12 hours.
Figure XIII-lB shows an average of 64 cortical responses after the prolonged expo-sure. Figure XIII-2B shows a section of the monitor record. For this "state" the long-lasting negativity is no longer present in the response, and neither is it present in the single traces viewed on the oscilloscope. During this recording session the negativity did not return when either wideband noise or light was introduced, nor did the entrance of the experimenter into the room, with resultant arousal, lead to the reappearance of the negative component. On the other hand, the presence of an ER1 of comparable magnitude to that shown in Fig. XIII-1A suggests that the changes in the waveform are probably not a result of changes in the acoustic stimulus or middle-ear muscle activity.
Figure XIII-1C shows the average of 64 evoked responses for the "state" referred to as "light sleep." Figure XIII-2C shows a section of the monitor record for this aver-age. The response in this state differs slightly from the "habituated" state, except for the presence of a very late negativity with a latency of approximately 170 msec.
Figure XIII-1D shows an average of 64 responses for the state described as "deep sleep." Figure XIII-2D shows a section from the monitor record for this average. The neck activity has all but disappeared and one sees only occassional irregular twitches. The evoked responses are now easily seen on the cortical monitor, but the averaged response shows that the magnitude is slightly greater and that there is a sharp negativ-ity that follows the ER 1 very closely. The second positivity, seen in the previous aver-ages, is now broader and slightly larger in magnitude.
Finally, Fig. XIII-1E shows the average of 64 responses after nembutal (0. 06 mgm/ kgm) was injected into the peritoneal cavity. Figure XIII-2E shows the monitor record, a pattern typical of activity during light anesthesia. The averaged response is also typical of a lightly anesthetized animal, showing only an ER 1 with subsequent repetitive activity.
Our results may be summarized as follows. In the awake "naive" state the full range of components shown by Kiang, Neame, and Clark is present. In the "habituated" and "light sleep" states the long-lasting negative component drops out, leaving the earlier components relatively unchanged. In the "deep sleep" state the ER1 becomes somewhat
(XIII. COMMUNICATIONS BIOPHYSICS)
larger and is followed by a sharp negativity. Finally, under barbituate anesthesia, all
components drop out except the ER1 which is not distinguishable from the ER1 in an
awake, habituated, or lightly sleeping animal. Although these data are preliminary in
that they represent a detailed analysis for only one preparation, corroborative evidence has been seen in other animals.
D. C. Teas, N. Y-S. Kiang
References
1. N. Y-S. Kiang, J. F. Neame, and L. E. Clark, Evoked cortical activity from auditory cortex in anesthetized and unanesthetized cats, Science 133, 1927-1928 (1961).
2. M. Jouvet, F. Michel, and J. Courjon, Aspects 6lectroenc6phalographiques de
deux m6chanismes inhibiteurs, t6lenc6phalique et rhombenc6phalique, entrant en jeu au cours du sommeil, J. Physiologie 51, 490-492 (1959).
3. D. H. Hubel, Electrocorticograms in cats during natural sleep, Arch. Ital. Biol. 98, 171-181 (1960).
4. R. Galambos, G. Sheatz, and V. G. Vernier, Electrophysiological correlates
of a conditioned response in cats, Science 123, 376-377 (1956).
B. JOINT PROBABILITIES IN FIRING PATTERNS OF A SINGLE NEURON
The nervous system often exhibits electrical activity during complete absence of externally controlled stimuli. During presentation of discrete stimuli at slow rates, the on-going electrical activity in a sensory system seems perturbed for several hundred milliseconds after stimulus presentation, and then returns to a "spontaneous" level.
In the past, in examining these phenomena at the level of the firing pattern of a single neuron, we have used several different measurements that essentially determine the probability of firing at a particular time relative to the stimulus, or relative to the
pre-vious action potential. l ' 2 We report here on some new measurements that serve to
examine the effects of two earlier events (either stimulus and action potential, or two action potentials) on the probability of firing.
Data from single units are obtained with microelectrodes, and recorded on magnetic
tape for subsequent processing with the TX-0 digital computer. In the examples shown
below, tungsten microelectrodes were used to isolate neurons in the auditory cortex (AI) of lightly anesthetized (nembutal) cats.
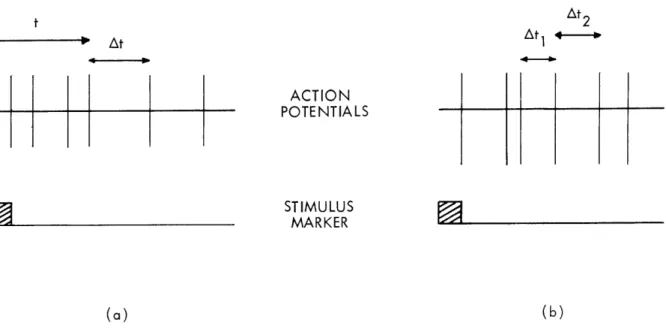
Two simple joint probability measurements are schematically indicated in
Fig. XIII-3. In each case the indicated measurement is made for a large number of
(XIII. COMMUNICATIONS BIOPHYSICS) t At2
iAt
At1 ACT10 I PO I tN I I A L STIMULUS MARKER (a) (b)Fig. XIII-3. Diagram of the two joint probability measurements discussed here.
two-dimensional plot on which a particular pair of measurements represents a
single point. Thus we can plot either: (a) At vs t, or (b) AtZ vs Atl. In the
first case we examine the correlation between At, the interval between two
suc-cessive spikes, and t, the time since the most recent stimulus. In the second
case we examine the correlation between At2, the second of two successive
intervals, and Atl, the first interval. (The restriction to successive intervals
is arbitrary. We would expect departures from independence only for a relatively
short time span. If two well-separated intervals were examined in this way we
would expect complete independence.)
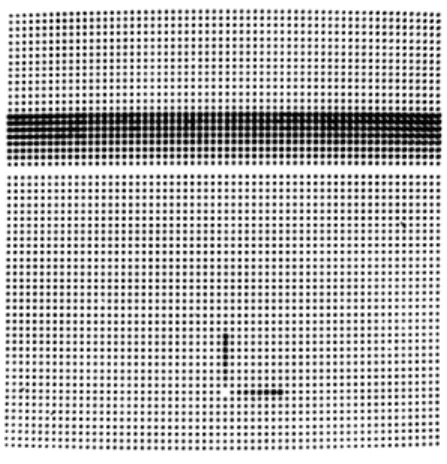
The actual form that a joint probability display takes is shown in Fig. XIII-4.
The plot consists of a raster of 64 X 64 points, whose intensity indicates the
number of measurements falling into that particular category. Arbitrary
arrange-ments of the numbers 0-8 are displayed on a field of "1" 's in Fig. XIII-4. As
in our other processing arrangements, the time resolution (or bin width) is
under control of the operator.
It is interesting to note some properties of such a joint probability matrix.
For example, the conditional measurement of At vs t can be simply related to
the Post Stimulus Time (PST) and Interval histograms with which we previously
characterized unit firing patterns. (For definitions of these terms see Gerstein
and Kiangl and also Fig. XIII-1 of a previous quarterly report. 3) If the matrix
At vs t is added column by column, the resulting set of 64 numbers form the
177
0l i
(XIII. COMMUNICATIONS BIOPHYSICS)
...
iIii..i
Fig. XIII-4. Display used for joint probabilities.
Field of "lil1 's, arbitrary arrange-ments of 0-8.
PST histogram of the data. Similarly, if the matrix is added row by row, the resulting
set of 64 numbers form the interval histogram of the data. These properties are useful in interpreting the joint distribution.
The matrix of At2 vs At1 has somewhat different properties. In this case either
addition by rows or by columns must result in the same set of 64 numbers that form the interval histogram. If a new (symmetric and suitably normalized) matrix is generated
from these two sets (x , y) of 64 numbers (a.i= xy ), we obtain the matrix that would
occur if At1 and At2 were completely independent. Comparison of this constructed
matrix and the experimental matrix thus allows a rapid check for systematic departures from independence.
Furthermore, if independence of At1 and At2 is assumed, it can be shown that
sum-mations of the matrix elements along the two diagonals are related to: (a) the autocor-relation function of the interval histogram, and (b) the convolution of the interval histogram with itself. The extent to which these relationships are fulfilled can be used conversely to investigate the degree of statistical independence.
Joint probability analyses of two units from the auditory cortex of anesthetized cats
are shown in Figs. XIII-5 and XIII-6. In each case the data taken during the presentation
of 1/sec clicks can be compared with spontaneous activity.
The PST and interval histograms for unit 106-1 have been shown previously. In the
nomenclature previously used,3 it is a (-) unit, with a dip in the PST histogram for
approximately 100 msec after the stimulus. The dependence of At on t for this unit is
shown in Fig. XIII-5. The features that correspond to the PST and interval histograms
can readily be picked out: There are few events in the columns following the stimulus, there are many events in the rows representing small intervals. In this case, not much
more useful information can be obtained. more useful information can be obtained.
-CLICKS
I/SEC
SPONTANEOUS
TI. ME
..'i
:'...
:...."
"
.'
" "-
* *.TIME
TIME
Fig. XIII-5.CLICKS
Joint At, t distribution (Bin width, 8 msec.)
0.75/SEC
for unit 106-1.SPONTANEOUS
TIME
Fig. XIII-6.TIME
Joint At, t distribution for unit 116-1.(Bin width, 8 msec.)
179 I I i I I
--
~--~--~
I---
-1 ~o~---
II
..
...
... ,
..
. • . •.. • . o'
':"
iw~ :(XIII. COMMUNICATIONS BIOPHYSICS)
A more interesting situation is shown in Fig. XIII-6. The PST histogram of
unit 116-1 has been shown previously2; it is a (+) unit, with an increase of activity
imme-diately after the stimulus, and two or three later peaks of activity. These peaks are also visible as columnar structure in Fig. XIII-6. Also, there seems to be diagonal structure (rising towards the left) associated with each peak. This implies that in a certain number of instances, the second action potential is well time-locked to the stim-ulus, while the first action potential can occur at various times.
Although no figure is shown, several units have been examined for the dependence
of At2 on At 1. In the small number of units that have been processed there appears to
be approximate statistical independence between the values of successive spike inter-vals. Considerably more work is required in order to become familiar with various spike patterns that have been processed in this way.
G. L. Gerstein
References
1. G. L. Gerstein, Analysis of firing patterns in single neurons, Science 131,
1811-1812 (1960).
2. G. L. Gerstein and N. Y-S. Kiang, An approach to the quantitative analysis of
electrophysiological data from single neurons, Biophys. J. 1, 15-28 (1960).
3. G. L. Gerstein and N. Y-S. Kiang, Responses from single units in the
unanes-thetized auditory cortex, Quarterly Progress Report No. 62, Research Laboratory of Electronics, M.I.T., July 15, 1961, pp. 227-231.
C. SHORT-TIME AFTEREFFECTS OF NOISE ON AUDITORY NERVE RESPONSES
Acoustic stimuli produce effects in the periphery of the auditory nervous system which outlast both the stimulus and the evoked neural response that is recorded with
gross electrodes. Previous studies have demonstrated that the amplitude of the
audi-tory nerve response to a click (N1) (recorded with gross electrodes) is reduced, if the
1 2
click is preceded by either another click, a burst of noise, or a burst of high-frequency
3-5
tone. The response amplitude increases monotonically with increasing time interval,
T, between the first stimulus and the test click; response amplitude decreases monoton-ically with increasing intensity or duration of the first stimulus. If the first stimulus is a low-frequency tone, the response has a supernormal amplitude for certain values
of T.4-6 All of these earlier workers report that the cochlear microphonic potential,
CM, in response to the test click is unchanged by the preceding stimulus as long as very
high intensity stimuli are not used. More recent reports confirm this finding.7
' 8 In the work reported here we have attempted to describe the aftereffects of low and moder-ate intensity wideband noise as a function of several stimulus parameters. The intensity and duration of the noise bursts have been limited so as to produce aftereffects lasting
(XIII. COMMUNICATIONS BIOPHYSICS)
NOISE BURST INTENSITY, IN, DB RE IV RMS
-70 -50
I
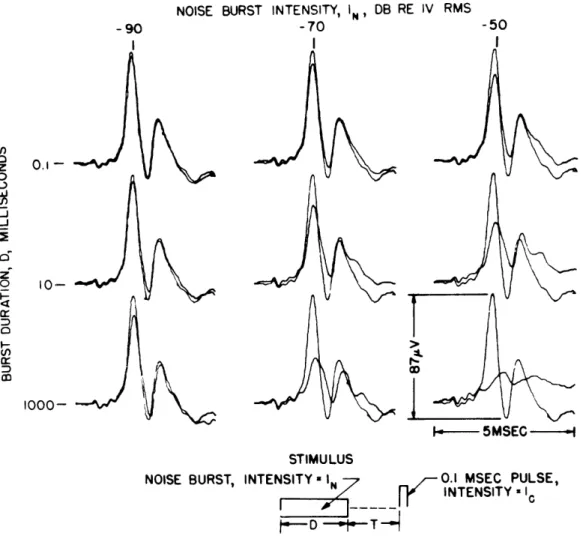
Fig. XIII-7.
-- - 5MSEC
STIMULUS
NOISE BURST, INTENSITY IN -N 0.1 MSEC PULSE,
N R N INTENSITY I
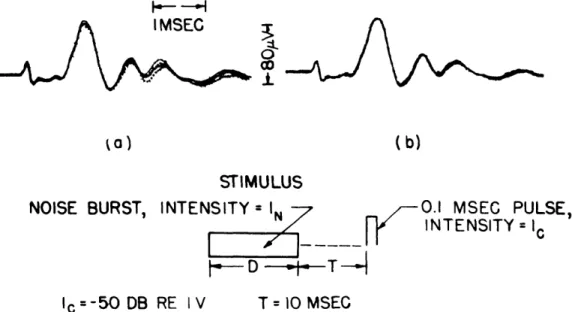
Averaged responses to clicks with and without a preceding noise burst for various values of burst intensity and duration. The
larger trace in each case is the control response. Number of
responses averaged for each trace, 32; T and Ic constant, with T = 10 msec; I = -80 db re 3. 9 volts; VDL c = -100 db. (Cat O.)
less than 10 seconds.
Responses were recorded from anesthetized cats with a wire electrode placed on the bone near the round window; a reference electrode was connected to the headholder. Stimuli were delivered with a PDR-10 earphone connected to the external meatus by a plastic tube.
The stimulus configuration is drawn at the bottom of Fig. XIII-7. The noise burst
was generated by a General Radio 1390A noise generator (bandwidth 20-20, 000 cps) that was gated by an electronic switch. The rise and fall times of the noise burst were
approximately 10 Iisec. All noise-intensity measurements are referred to a 0-db level
corresponding to 1 volt rms at the terminals of the earphone. (The voltage measurement
181
-90
0.1
-
1000-(XIII. COMMUNICATIONS BIOPHYSICS)
was made at the output of a lowpass (8 kc, 18 db/octave) filter that was inserted to approximate the lowpass properties of the earphone.) This reference level corresponds
to a sound pressure of approximately 120 db re 0. 0002 dynes/cm2. The clicks were
produced by applying a 0. 1-msec rectangular pulse to the earphone. The pulse polarity
was chosen so as to produce a condensation click at the earphone.
A control click was often inserted before each burst-click pattern. If the amplitude of the response to this control click was less than that obtained when the noise burst was removed, the stimulus repetition rate was reduced. Hence, the stimulus pattern was repeated at a rate that was slow enough to avoid any overlapping of aftereffects from one noise burst to the next. As a result, the stimulus repetition rate was varied from one per second to one every 20 seconds, the rate depending on the stimulus parameters.
Responses were averaged on the ARC-1 computer.9
Averaged response waveforms illustrating the effects of changing burst duration, D,
and intensity, In , are given in Fig. XIII-7. Each pair of responses is a comparison of
the click response obtained with and without the preceding noise burst. The larger response for each case was obtained without the noise burst.
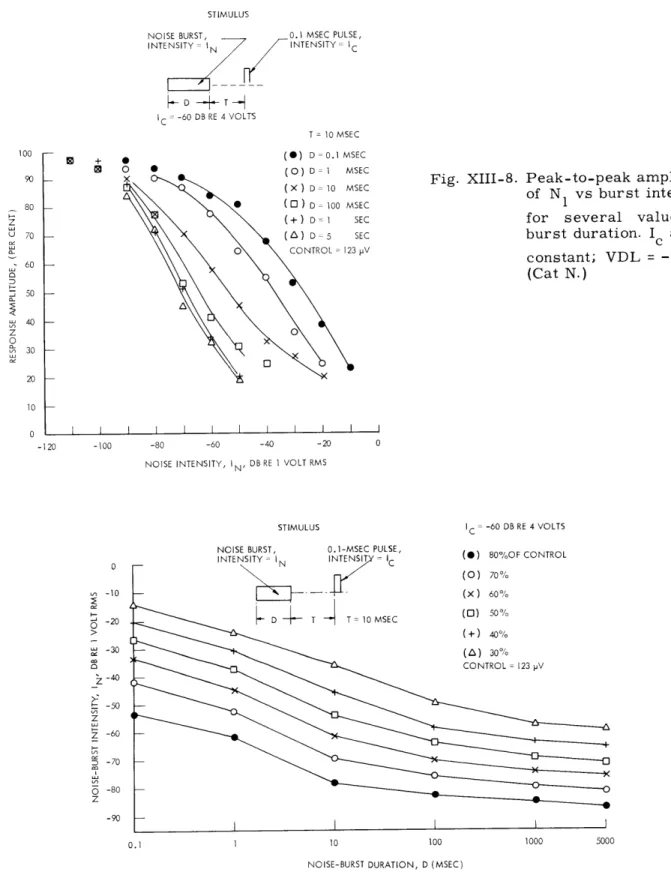
Figure XIII-8 illustrates the dependence of N1 amplitude on noise intensity for six
values of burst duration D. For the range of In used, it appears that there is little
change in the aftereffect when the burst duration is increased above 100 msec.
The data of Fig. XIII-8 can be replotted as in Fig. XIII-9. For a given response
amplitude, an In vs D curve can be plotted which might be thought of as an equal
after-effect contour. However, these data only insure equality of the amplitude of N1. It may
be that different noise burst parameters produce equal N1 amplitudes, but different
wave-forms. Figure XIII-10a shows that for one set of four "equivalent" I -D pairs, the whole
click response waveform is nearly the same. The small differences in the later
com-ponents of the averaged responses waveforms are significant, however, since these dif-ferences do not occur if the noise-burst parameters are unchanged (Fig. XIII-10b).
It is also possible that a set of noise-burst parameters which produces "equivalent"
aftereffects for one value of T, may not be equivalent for other values. Figure XIII-11
shows that they are not. The data of Fig. XIII-11 were obtained by finding five different pairs of noise duration and intensity values which produce equal aftereffects with T equal
to 10 msec. For the chosen Ic, these equal aftereffects reduced the click response to
78 per cent of its control value. If these In-D pairs are used at other values of T, we
find that response recovery after a short-duration high-intensity burst is more rapid than after an "equivalent," low-intensity, long-duration burst.
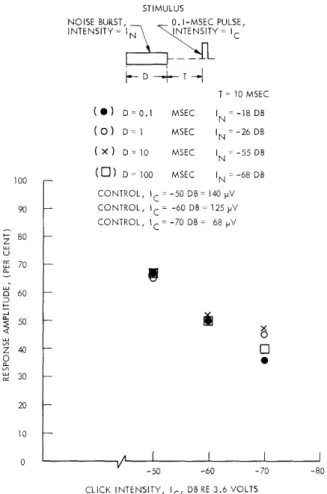
In Fig. XIII-12 a comparison is made of N1 amplitudes for a set of equivalent noise
bursts at three click intensities. The equivalent pairs of I and D values were
deter-mined at T equal to 10 msec and Ic equal to -50 db. The figure shows that N1 amplitudes
STIMULUS
NOISE BURST, 0.1 MSEC PULSE, INTENSITY = IN INTENSITY = IC D T C = -60 DB RE 4 VOLTS T = 10 MSEC (C) D 0. 1 MSEC ( ) D = 1 MSEC (X) D= 10 MSEC S (O ) D 100 MSEC (+) D = 1 SEC (A) D 5 SEC O CONTROL =123 pV
Fig. XIII-8. Peak-to-peak amplitude of N1 vs burst intensity for several values of burst duration. I and T
c
constant; VDL = -95 db. (Cat N.)
I I I I I I I
-120 -100 -80 -60 -40 -20
NOISE INTENSITY, IN , DB RE 1 VOLT RMS
STIMULUS
NOISE BURST, 0.1-MSEC PULSE,
INTENSITY IN INT EN IC -D T " T =10MSEC IC = -60 DB RE 4 VOLTS (0) 80%OF CONTROL (0) 70% 10 100 1000 5000
NOISE-BURST DURATION, D (MSEC)
Fig. XIII-9. Equal aftereffect curves obtained from the data of Fig. XIII-8. Several levels of equal aftereffects are shown in the In-D plane.
183 S O 0 0 80 H--10 -20 S-30 -40 _ -50 z Z Z -60 -70 O -80 z I I I I . . . . ..
IMSEC
CD -L
ta)
(b)
STIMULUS
NOISE BURST, INTENSITY
= I0.1
MSEC PULSE,
INTENSITY = I
-D
----
T
--I
c=-50
DB RE IV
T
= 10
MSEC
Fig. XIII-10. (a) Superimposed averaged responses for four values of noise-burst param-eters which produce equal N1 amplitudes. Noise parameters (In = -18 db
and D = 0.1 msec, -26 db and 1 msec, -55 db and 10 msec, -68 db and 100 msec) produced the effects illustrated in the superimposed traces.
N1 amplitude is 66 per cent of its control value of 140 mv. (b) Four dif-ferent averaged responses with identical stimulus conditions: In = -55 db, D = 10 msec; number of responses averaged, 32; I and T constant; VDL =
-95 db. (Cat L.) c
100
90 90 STIMULUS
NOISE BURST, 0.1-MSEC PULSE,
80 INTENSITY= INTENSITY= Ic 70 -60 60D IC = -60 DB RE 4 VOLTS 50 C Z ( ) IN =-46DB, D=0.1 MSEC (O ) IN= -55 DB, D MSEC 30 - (X) N= -73 DB, D= 10 MSEC (0) N = -80DB, D=100 MSEC 20 - + ) N = -82 DB, D = 1 SEC 10 - CONTROL 127 pV 0 I I I i l I I i II 13 10 30 100 300 1000
POSTSTIMULUS DELAY, T (MSEC)
Fig. XIII-11. N1 amplitude vs T. Pairs of In and D values were chosen so as
to make the N1 amplitudes equal at T = 10 msec. (Amplitudes are
(XIII. COMMUNICATIONS BIOPHYSICS)
STIMULUS
NOISE BURST, 0. I-MSEC PULSE,
INTENSITY=N I NTENSITY= IC T = 10 MSEC ( ) D=0.1 MSEC IN = -18 DB (o) D= 1 MSEC IN = -26 DB ( x) D 10 MSEC IN = -55 DB 100 ( ) D= 100 MSEC IN = -68 DB CONTROL, IC = -50 DB 140 pV 90 - CONTROL, IC -60 DB 125 pV CONTROL, IC= -70 DB = 68 pV Z 80 70 60 50 0 z40 -20 10 0 -50 -60 -70 -80
CLICK INTENSITY, IC, DB RE 3.6 VOLTS
Fig. XIII-12. N1 amplitude vs click intensity for four pairs of In and D. The four
noise-burst-duration pairs were chosen to give equal N1 amplitudes for Ic equal to -50 db. (N1 amplitudes are peak-to-peak measure-ments.) T constant; VDL = -95 db. (Cat L.)
of the set of bursts is maintained quite well for small changes in click inten-sity (10 db).
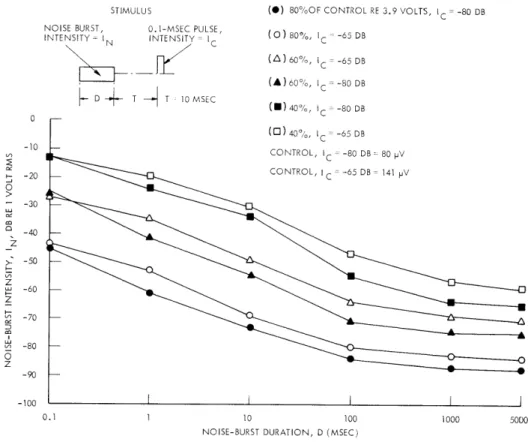
A comparison of equal aftereffect curves in the In-D plane is shown in Fig. XIII-13 for two click intensities. Since the sets of curves for the two intensities (dif-ferring by 15 db) are roughly parallel (except for the smallest values of D), we can conclude that "equivalence" of a set of I -D values holds approximately
n
over this intensity range.
In summary, we, have measured the aftereffects produced by a burst of wide-band noise on the response to a click. We have focused our attention on the effects of changing the noise-burst parameters, and on the hypothesis that a set of I -D values produces equivalent aftereffects. The data have shown that
n
(XIII. COMMUNICATIONS BIOPHYSICS)
STIMULUS
NOISE BURST, 0.1-MSEC PULSE, INTENSITY= I
N INTENSITY= IC
D T T 10 MSEC
(*) 80%OF CONTROL RE 3.9 VOLTS, IC - -80 DB
(0)80%, IC -65 DB (A) 60%, IC = -65 DB (A)60% , IC - -80 DB (11)40%, IC= -80 DB (0) 40%, IC -65 DB CONTROL, IC = -80 DB= 80 pV CONTROL, I C = -65 DB 141 pV 10 100
NOISE-BURST DURATION, D (MSEC)
Fig. XIII-13.
1000 5000
Equal aftereffect curves for two values of click intensity. (Cat O, VDL = -100 db.)
this hypothesis is not valid when variations in T are permitted, but that it is quite accu-rate for small variations in click intensity (10-15 db).
J. F. Buoncristiani, W. T. Peake References
1. W. J. McGill, A statistical description of neural responses to clicks recorded at the round window of the cat, Ph.D. Thesis, Harvard University, 1952.
2. J. E. Hawkins, Jr. and M. Kniazuk, The recovery of auditory nerve action
potentials after masking, Science 3, 568-576 (1950).
3. P. Kellaway and H. E. Hoff, Inhibition in the auditory nerve, Fed. Proc. 6,
140 (1947).
4. W. A. Rosenblith, R. Galambos, and I. J. Hirsh, The effect of exposure to loud
tones upon animal and human responses to acoustic clicks, Science 3, 569-670 (1950).
5. W. A. Rosenblith, Auditory masking and fatigue, J. Acoust. Soc. Am. 22,
797-800 (1950).
6. J. R. Hughes and W. A. Rosenblith, Electrophysiological evidence for auditory
sensitization, J. Acoust. Soc. Am. 29, 275-280 (1957).
7. H. Sorensen, Auditory adaptation in nerve action potentials recorded from the
(XIII. COMMUNICATIONS BIOPHYSICS)
8. L. Gisselsson and H. Sorensen, Auditory adaptation and fatigue in cochlear potentials, Acta. Oto-Laryngol. 50, 391-405 (1951).
9. W. A. Clark, R. M. Brown, M. H. Goldstein, Jr., C. E. Molnar, D. F. O'Brien, and H. F. Zieman, The average response computer (ARC): A digital device for com-puting averages and amplitude and time histograms of electrophysiological response, Trans. IRE, Vol. BME-8, pp. 46-51, 1961.