HAL Id: inserm-03016227
https://www.hal.inserm.fr/inserm-03016227
Submitted on 20 Nov 2020
HAL is a multi-disciplinary open access
archive for the deposit and dissemination of
sci-entific research documents, whether they are
pub-lished or not. The documents may come from
teaching and research institutions in France or
abroad, or from public or private research centers.
L’archive ouverte pluridisciplinaire HAL, est
destinée au dépôt et à la diffusion de documents
scientifiques de niveau recherche, publiés ou non,
émanant des établissements d’enseignement et de
recherche français ou étrangers, des laboratoires
publics ou privés.
Lattice light-sheet microscopy and photo-stimulation in
brain slices
Mathieu Ducros, Angela Getz, Misa Arizono, Valeria Pecoraro, Monica
Fernandez Monreal, Mathieu Letellier, U Nägerl, Daniel Choquet
To cite this version:
Mathieu Ducros, Angela Getz, Misa Arizono, Valeria Pecoraro, Monica Fernandez Monreal, et al..
Lattice light-sheet microscopy and photo-stimulation in brain slices. Neural Imaging and Sensing
2019, Feb 2019, San Francisco, France. pp.8, �10.1117/12.2509467�. �inserm-03016227�
*
[email protected]
, http://www.bic.u-bordeaux.fr/
Lattice light-sheet microscopy and photo-stimulation in brain slices
Mathieu Ducros
*a, Angela Getz
b, Misa Arizono
b, Valeria Pecoraro
b, Monica Fernandez-Monreal
a,
Mathieu Letellier
b, U. Valentin Nägerl
b, Daniel Choquet
a,ba
Bordeaux Imaging Center, UMS 3420 CNRS, US04 INSERM, University of Bordeaux, F-33000
Bordeaux, France
b
Interdisciplinary Institute for Neuroscience, UMR5297 CNRS, University of Bordeaux F-33000
Bordeaux, France
ABSTRACT
Lattice light sheet (LLS) fluorescence microscopy is a powerful recent technique for in vivo imaging of single and multi-cellular samples at very high spatio-temporal resolutions. We built a LLS microscope in which we added a stimulation path to perform all-optical neurophysiological studies in rodent hippocampal brain slices. Thanks to the photo-stimulation path we could achieve fluorescence recovery after photobleaching (FRAP) or glutamate uncaging at spatially and temporally controlled regions of interest. Several fluorescence labelling protocols were employed depending on the imaged structure. Sub-micrometric neuronal elements such as spines or dendritic vesicles could be imaged down to ~20 µm below the surface. We demonstrate the performances of LLS in several ongoing studies: measurement of AMPA receptor surface diffusion at single spines, vesicular transport in dendrites, spontaneous and stimulated local calcium activity in neurons and astrocytes.
Keywords: light-sheet fluorescence microscopy, selective-plane imaging microscopy, lattice, neurons, astrocytes,
calcium imaging, brain slices, uncaging, FRAP
1. INTRODUCTION
LLS microscopy1 is part of the wide family of selective plane illumination microscopes2 (SPIM). Compared to
conventional wide field or laser scanning techniques, SPIM presents several key advantages: an intrinsic optical sectioning along with very low phototoxicity/photobleaching and high frame rates. In addition, the specific illumination pattern of LLS creates a homogeneous submicron 3D resolution over extended fields of view (~ 20-50 µm). The great performance of LLS for subcellular elements imaging at high spatiotemporal resolution has already been demonstrated in several biological studies involving cultured cells1,3, mouse embryonic stem cell spheroids1, neuroblastoma cells4, zebrafish
embryos3 or model of brain metastatis5. In the present work we focused on imaging neuronal and glial cells in rodent
organotypic hippocampal slices with LLS. Furthermore we modified the LLS microscope by adding a photo-stimulation path to perform FRAP or uncaging experiments at spatially and temporally controlled regions of interest. With this instrument we could perform all-optical physiological studies in brain slices.
2. METHODS
2.1 Instrumentation
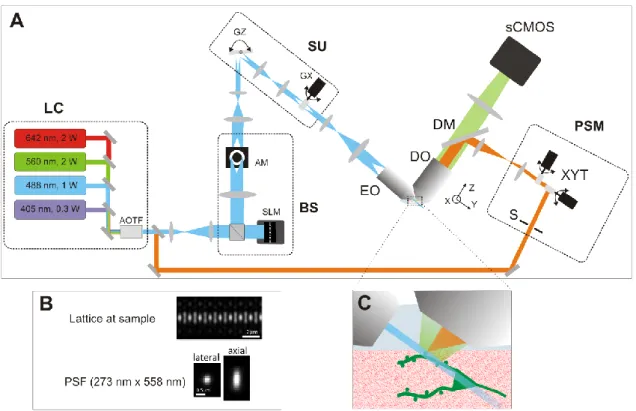
The LLS microscope setup (Fig 1A) was built according to the complete technical information provided by the group of Eric Betzig at Janelia Fams, HHMI, USA. For complete description see 1. Briefly, the output line of the laser combiner
(LC), which is selected by an acousto-optic tunable filter (AOTF), is sent to a beam shaping system (BS) to create the lattice pattern. BS consists of a spatial light modulator (SLM) and an annular mask (AM). The SLM creates the square lattice profile (Fig 1B, top) and is conjugated with the sample object plane. AM is required to clean the SLM diffraction
pattern. A scanning unit (SU) composed of two galvanometric mirrors is used to dither the pattern along the X axis and to translate along the Z axis. The lattice light sheet is focused by a 0.65 NA excitation objective (EO). Fluorescence is collected with a 1.1NA detection objective (DO) and imaged onto an sCMOS camera. We characterized the LLS optical resolution using 170 nm diameter beads and found values near diffraction limits laterally and better than confocal microscopy axially (Fig 1.B). All images are acquired in dithered square lattice mode. The annular mask minimum and maximum NAs were 0.44 and 0.55 respectively. Fast sample translation with a piezo stage was used to acquire Z stacks. We modified the original LLS setup by adding a photo-stimulation module (Fig 1A, PSM, orange path). A small portion (5-20 %) of the laser combiner output is sent to the PSM by a variable beamsplitter. A mechanical shutter (S) (VS25, Uniblitz) controls the photostimulation duration. Submicron positioning and patterning is achieved by a set a galvanometric mirrors (XYT) (6215H, Cambridge Technology) that are optically conjugated to the DO back focal plane. The photostimulation beam is magnified to fill the DO back aperture and coupled into the LLS detection arm by a quadband dichroic mirror (DM) (Di03-R405/488/561/635, Semrock). The shutter timing and galvo positioning are controlled by a USB A/D card (6002, National Instruments), that is programmed by a user interface written in labVIEW. Minimum illumination time is limited by the shutter speed to ~5 ms. Beam positioning precision was measured to less than 0.2 µm and beam diameter at sample was near diffraction limited.
Figure 1: A Lattice light-sheet microscope (LLS). LC: four wavelengths laser combiner; BS: beam shaper composed of a spatial light modulator (SLM) and an annular mask (AM); SU: scanning unit with Z and X galvos (GZ and GX) translates the pattern along the x and z axis; fast dithering X galvo creates uniform light sheet at sample; EO: excitation objective; DO: detection objective; fluorescence is detected over the illuminated plane by a fast and sensitive sCMOS camera; PSM: photostimulation module to target any user defined ROI at high spatiotemporal resolution; S: shutter; XYT: galvo-based targeting system. B. Optical characterization of the lattice pattern and resulting PSF at 488 nm excitation. C: Schematic zoom at the sample with light sheet (blue), detected fluorescence (green), and photostimulation beam (orange). The light sheet is a very thin (~ 0.5 µm) and extended plane (>15 µm along Y and 100 µm along X) allowing very high resolution imaging and fast 3D imaging.
2.2 Sample preparation and imaging conditions
Several labeling techniques were employed depending on the imaged cells and experiment purpose. This allowed us to test LLS in various conditions of sample preparation and fluorescence signal level. As a general model we used organotypic slices6 from P5-7 rats. All work involving animals was conducted according to the European guide for the care and use of
laboratory animals and the animal care guidelines issued by the animal experimental committee of the University of Bordeaux (CE50; A5012009). Briefly, 300 µm thick hippocampal slices were grown on millicell membrane in a horse serum based medium. Depending on the protein expression method, slices were used at 5-10 DIV. Membranes were cut and glued to a 5 mm diameter cover slip with high vacuum silicone grease. The cover slip was mounted onto the LLS sample holder and the slice was imaged in ACSF (composition was adjusted and optimized to experiments) continuously gassed with 5% CO2 and 95% O2, perfused at a rate of 1.7 mL/min and recorded at 32°C. Some of the slices (used for comparison with confocal microscopy) were fixed in 4% paraformaldehyde and stored in Phosphate Saline Buffer (PBS) prior imaging. All images were acquired at depth between 0 and 20 µm below the surface. Illumination power varied depending on wavelength, fluorophore brightness and labelling density and ranged from 5 to 100 µW, spread over the entire light sheet width and thickness.
3. RESULTS
3.1 Comparison with confocal microscopy
We started by comparing the performances of LLS and laser scanning confocal microscopy in the context of neuronal sample imaging. For this we used fixed hippocampal slices transfected by single cell electroporation with a construct driving the expression of TdTomato. We imaged the same region with both methods (Fig 2). The PSF of the confocal microscope (Objective NA=0.9) is more anisotropic than with LLS. Thus the image of dendrite and spines appears elongated along the Z axis even after deconvolution. Consequently the morphology of submicrometric elements is more faithful with LLS than with confocal: we measured the spine “width” in XY plane and “depth” along the Z axis. We found a “width” of 0.53 +/-0.13 µm and “depth” of 0.67 +/-0.12 for LLS, whereas it was 0.63 +/- 0.09 µm and 1.59 +/- 0.21 for confocal (n=10 spines).
Figure 2: Axial resolution is significantly improved with LLS as revealed when visualizing surface rendering of 3D stacks of fixed dendrites in hippocampal slices. LLS provides a much more faithful representation of fine neuronal structures. Both image stacks are deconvolved. Imaging depth: between 5 and 20 µm.
Then we acquired time lapse videos of two dendrites at 10 fr/s for 60 s with both methods. In the case of confocal microscopy the imaged dendrite disappeared almost completely after 30s due to strong photobleaching, whereas we could acquire good SNR images with LLS throughout the entire imaging duration. Note that the difference in photobleaching rate between LLS and confocal would be even further increased when acquiring 3D stacks because out of focus planes are always illuminated in confocal modality.
Figure 3: tdTomato labeled dendrites in a fixed hippocampal slice were acquired continuously at 10 fps for 60 s. Light intensity at the sample is ~2.5 W/cm2 and ~25 kW/cm2 for LLS and confocal respectively. Long term imaging with high SNR is possible
with LLS and not with confocal (initial SNR: 28 for LLS, 4.5 for confocal)
3.2 Receptor diffusion at dendritic spines
Thanks to the excellent imaging performances of LLS and the addition of our photo-stimulation module, we could perform FRAP experiments at single spine in live organotypic hippocampal slices. The goal of this project is to study receptor mobility upon various synaptic plasticity conditions. For these experiments, we used slices infected with AAV viruses driving the expression of AMPA receptor subunits (GluA1 or A2) tagged with biotin by coexpression of the BirA biotin ligase7 together with soluble GFP to identify transfected cells. After 10-14 days of expression, slices were incubated for
20 min with fluorescent dye-tagged StreptAvidin (SA biotin binding protein) to label and visualize surface AMPA receptors8. Individual spines could be imaged, targeted, photobleached, and subsequent fluorescence recovery was
measured for several minutes (Fig 4). When AMPA receptors were labelled with monomeric SA, fluorescence recovered partially indicating a mobile pool of AMPA receptors (Fig 4, right). However, the amplitude of the recovery was significantly reduced when AMPA receptors were crosslinked with tetrameric SA which reduces their mobility (data not shown).
Figure 4: Simultaneous high resolution imaging and targeted photobleaching of mSA-STAR 635 labeled GluA1/GluA2 proteins is used to measure the surface diffusion of AMPA receptors at the level of single spines.
3.3 Local stimulation of individual dendritic spines with glutamate uncaging
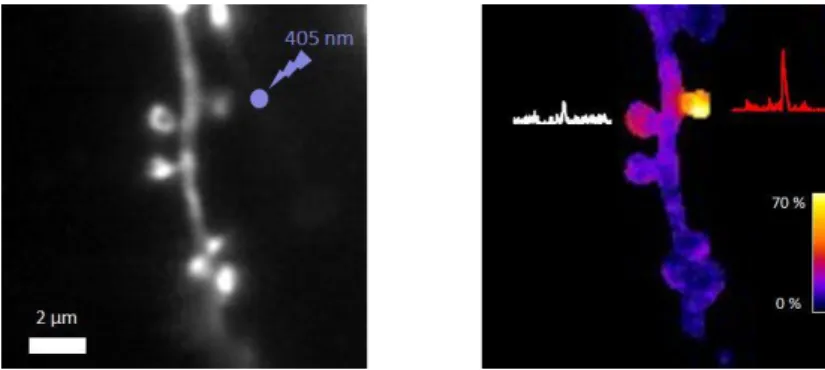
Here we demonstrate the possibility to perform glutamate uncaging at single spines and simultaneous calcium reporter imaging with our microscope. Local glutamate uncaging is commonly used to study synaptic plasticity conditions such as long term potentiation. GCaMP6f was expressed in a sparse subset of neurons in a rat hippocampal slice using FLEx-Cre recombinase system (GCaMP6-FLEx +Cre (100:1)). 2.5 mM MNI glutamate was used in HEPES buffered ACSF. A dendrite of a neuron expressing GCaMP6f was imaged at 100 fps. A 1mW, 20 ms flash of 405 nm light focused onto a single spot about 1µm away from the spine (Fig 5 left) triggered a local rise of fluorescence due to calcium influx at the spine (Fig 5 right).
Figure 5 : GCaMP6f was expressed in a sparse subset of neurons in an organotypic rat brain slice using FLEx-Cre recombinase (GCaMP6-FLEx + Cre (100:1)). Slice was incubated with 2.5 mM MNI glutamate. We uncaged glutamate with a 405 nm diffraction limited pulse for 20 ms about 1 µm away from a spine. Calcium response was sampled at 100 Hz. Right: F/F in a 200 ms period after stimulation and response of individual spines over 4 s (white and red traces).
3.4 Vesicular transport in dendrites
Another project involves measurement of AMPA receptor vesicular transport in various physiological conditions. Mouse hippocampal slices were electroporated with constructs coding for ARIAD-TdTomato-GluA1 with NucleofectorTM from
Lonza. The ARIAD system brings the cDNAs coding for proteins of interest: synthetized tagged protein are blocked in the ER and when a signal sequence is cleaved on demand (by adding a ligand that disrupts aggregation domains responsible to link them to the ER), all tagged proteins leave simultaneously the ER and transported towards the plasma membrane in vesicles following the regular trafficking pathway. We imaged vesicles loaded with TdTomato-GluA1 with LLS at 10 fps for 10mn. FRAP of a portion of dendrite could be used to enhance the contrast and reveal individual vesicles (video 1).
Video 1: video1.mp4 Photobleaching of ROIs on neuronal dendrites (red dotted rectangle) can be helpful to increase contrast and reveal individual vesicles. http://dx.doi.org/doi.number.goes.here
3.5 Astrocyte calcium activity imaging at high temporal resolution
Thanks to the extremely high image acquisition speed of LLS we could visualize very brief calcium events occurring spontaneously in astrocytes (movie 2). For this experiment hippocampal slices were prepared using the roller-tube method
9. Slices were infected with AAV9-GFAP-GCaMP6s 10 that was microinjected into the stratum radiatum of 2-week old
slices from WT mice mice 4-6 weeks prior to the experiment. LLS imaging rate was 100 Hz. No stimulation was applied to the cell.
Video 2: video2.mp4 Spontaneous calcium activity in GCaMP6s infected astrocyte recorded at 100 Hz. http://dx.doi.org/doi.number.goes.here
We could also record slower spontaneous calcium events in astrocytes in 3D at volumetric rates near 1Hz (Movie 3). In this case we used rat hippocampal slices that were electroporated with a plasmid coding for GCaMP6f using NucleofectorTM from Lonza.
Video 3: video3.mp4 Spontaneous calcium activity recorded in 3D at 0.9 Hz in an astrocyte labelled with GCaMP6f. 3D volume ~60x50x20 µm3.http://dx.doi.org/doi.number.goes.here
4. DISCUSSION
In this work we demonstrate that LLS is a powerful technique to image structure and activity of neuronal and glial cells at very high spatio-temporal resolution with minimal photo-bleaching and toxicity. Furthermore, with the addition of the photo-stimulation path we significantly expand the potential of LLS for neuroscience studies, as illustrated by the FRAP and uncaging experiments presented above.
Until now LLS was mainly applied to the imaging of cultured cells or semi-transparent samples. Turbid tissue, such as brain, scatters light and induces optical aberration. Both excitation and detection paths are potentially degraded by propagation inside brain tissue. Furthermore LLS is particularly sensitive to aberration and misalignment because the light sheet and detection focal plane positions need to overlap to less than ~ 0.1 µm. Thus we were glad to observe that sub-micrometric neuronal elements could be imaged by our LLS microscope down to ~ 20 µm below the surface. LLS fine optical sectioning and high spatial resolution is maintained in organotypic hippocampal slices at shallow depth. This imaging depth is sufficient to investigate many neuronal processes, including synaptic plasticity or neural-glial interaction mechanisms. Imaging slightly deeper, which could be useful for acute brain slices (where surface cells are often damaged by cutting) or any other thick biological sample, might also be possible with adaptive optics strategies11,12.
Acknowledgments
We thank the Howard Hughes Medical Institute, Janelia Research Campusfor providing all the technical information to reproduce the lattice light sheet microscope upon signature of a research license agreement. Among the HHMI staff, Westley R. Legant and Daniel E Milkie provided very precious help to build the setup and handle the controlling software. We thanks all the Bordeaux Imaging photonic team for technical support. We thank Julie Angibaud for preparing organotypic slices with the rolling tube technique. This work was financially supported by France Bioimaging, the GIS IBiSA and DynSynMem ERC grant.
REFERENCES
[1] Chen, B.-C., Legant, W. R., Wang, K., Shao, L., Milkie, D. E., Davidson, M. W., Janetopoulos, C., Wu, X. S., Hammer, J. a., Liu, Z., English, B. P., Mimori-Kiyosue, Y., Romero, D. P., Ritter, A. T., Lippincott-Schwartz, J., Fritz-Laylin, L., Mullins, R. D., Mitchell, D. M., Reymann, a.-C., et al., “Lattice light-sheet microscopy: Imaging molecules to embryos at high spatiotemporal resolution,” Science (80-. ). (2014).
[2] Huisken, J., Swoger, J., Del Bene, F., Wittbrodt, J. and Stelzer, E. H. K., “Optical sectioning deep inside live embryos by selective plane illumination microscopy.,” Science 305(5686), 1007–1009 (2004).
[3] Aguet, F., Upadhyayula, S., Gaudin, R., Chou, Y. and Lippincott-schwartz, J., “Membrane dynamics of dividing cells imaged by lattice light-sheet microscopy” (2016).
[4] Ellefsen, K. L. and Parker, I., “Dynamic Ca2+imaging with a simplified lattice light-sheet microscope: A sideways view of subcellular Ca2+puffs,” Cell Calcium 71(November 2017), 34–44 (2018).
[5] Parker, I., Evans, K. T., Ellefsen, K., Lawson, D. A. and Smith, I. F., “Lattice light sheet imaging of membrane nanotubes between human breast cancer cells in culture and in brain metastases,” Sci. Rep. 7(1), 1–7 (2017). [6] Stoppini L, Buchs A and Muller D., “A simple method for organotypic cultures of nervous tissue,” J. Neurosci.
Methods 37, 173–182 (1991).
[7] Penn, A. C., Zhang, C. L., Georges, F., Royer, L., Breillat, C., Hosy, E., Petersen, J. D., Humeau, Y. and Choquet, D., “Hippocampal LTP and contextual learning require surface diffusion of AMPA receptors,” Nature
549(7672), 384–388 (2017).
[8] Chamma, I., Letellier, M., Butler, C., Tessier, B., Lim, K. H., Gauthereau, I., Choquet, D., Sibarita, J. B., Park, S., Sainlos, M. and Thoumine, O., “Mapping the dynamics and nanoscale organization of synaptic adhesion proteins using monomeric streptavidin,” Nat. Commun. 7 (2016).
[9] Gähwiler, B. H., “Organotypic monolayer cultures of nervous tissue,” J. Neurosci. Methods (1981).
[10] Stobart, J. L., Ferrari, K. D., Barrett, M. J. P., Stobart, M. J., Looser, Z. J., Saab, A. S. and Weber, B., “Long-term in vivo calcium imaging of astrocytes reveals distinct cellular compartment responses to sensory stimulation,” Cereb. Cortex (2018).
[11] Liu, T. L., Upadhyayula, S., Milkie, D. E., Singh, V., Wang, K., Swinburne, I. A., Mosaliganti, K. R., Collins, Z. M., Hiscock, T. W., Shea, J., Kohrman, A. Q., Medwig, T. N., Dambournet, D., Forster, R., Cunniff, B., Ruan, Y., Yashiro, H., Scholpp, S., Meyerowitz, E. M., et al., “Observing the cell in its native state: Imaging
subcellular dynamics in multicellular organisms,” Science (80-. ). 360(6386) (2018).
[12] Schöneberg, J., Dambournet, DLiu, T.-L., Forster, R., Hockemeyer, D., Betzig, E. and Drubin, D. G., “4D Cell Biology: Big Data Image Analytics and Lattice Light-Sheet Imaging Reveal Dynamics of Clathrin-Mediated Endocytosis in Stem Cell Derived Intestinal Organoids,” MBoC Stem cell issue, 1–24 (2018).