HAL Id: inserm-01368780
https://www.hal.inserm.fr/inserm-01368780
Submitted on 20 Sep 2016HAL is a multi-disciplinary open access
archive for the deposit and dissemination of sci-entific research documents, whether they are pub-lished or not. The documents may come from teaching and research institutions in France or abroad, or from public or private research centers.
L’archive ouverte pluridisciplinaire HAL, est destinée au dépôt et à la diffusion de documents scientifiques de niveau recherche, publiés ou non, émanant des établissements d’enseignement et de recherche français ou étrangers, des laboratoires publics ou privés.
Multiparametric MRI including oxygenation mapping of
experimental ischaemic stroke
Ligia Simoes Braga Boisserand, Benjamin Lemasson, Hirschler Lydiane,
Anaïck Moisan, Violaine Hubert, Emmanuel Luc Barbier, Chantal Rémy,
Olivier Detante
To cite this version:
Ligia Simoes Braga Boisserand, Benjamin Lemasson, Hirschler Lydiane, Anaïck Moisan, Violaine Hubert, et al.. Multiparametric MRI including oxygenation mapping of experimental ischaemic stroke. Journal of Cerebral Blood Flow and Metabolism, Nature Publishing Group, 2016, 37 (6), pp.2196-2207. �10.1177/0271678X16662044�. �inserm-01368780�
1
Multiparametric MRI including oxygenation mapping of
experimental ischaemic stroke
Authors: Ligia Simoes Braga Boisserand 1,2,4; Benjamin Lemasson 1,2; Lydiane Hirschler 1,2,6;
Anaïck Moisan 1,2,5; Violaine Hubert 1; Emmanuel Luc Barbier 1,2*; Chantal Rémy 1,2; Olivier
Detante 1,2,3
1 Univ. Grenoble Alpes, Grenoble Institut des Neurosciences, GIN, F-38000 Grenoble, France
2 Inserm, U1216, F-38000 Grenoble, France 3 CHU Grenoble Alpes, F-38000 Grenoble, France 4 CAPES Foundation, Ministry of Education of Brazil
5 Cell Therapy and Engineering Unit, EFS Rhône Alpes, 464 route de Lancey, 38330 Saint Ismier, France
6 Bruker Biospin, Ettlingen, Germany
*CORRESPONDING AUTHOR: Emmanuel Luc Barbier
Chemin Fortuné Ferrini, Université Grenoble Alpes - Site Sante BP 170 38042 Grenoble Cedex 9, France
Tél. +33 4 56 52 05 88 Fax +33 4 56 52 05 98
2
Abstract (226 → 200)
Recent advances in MRI methodology, such as microvascular and brain oxygenation (StO2)
imaging, may prove useful in obtaining information about the severity of the acute stroke. We assessed the potential of StO2 to detect the ischaemic core in the acute phase compared to
apparent diffusion coefficient (ADC), and to predict the final necrosis. Sprague-Dawley rats (n=38) were imaged during acute stroke (D0) and 21 days after (D21). A multiparametric MRI protocol was performed at 4.7T to characterize brain damage within three Region of interest (ROI): “LesionD0” (diffusion), “Mismatch” representing penumbra (perfusion/diffusion) and “Hypoxia” (voxels <40% of StO2 within the ROI LesionD0).
Voxel-based analysis of stroke revealed heterogeneity of the ROI LesionD0, which included voxels with different degrees of oxygenation decrease. This finding was supported by a dramatic decrease of vascular and perfusion parameters within the ROI Hypoxia. This zone presented the lowest values of almost all parameters analyzed, indicating a higher severity. Our study demonstrates the potential of StO2 MRI to more accurately detect the ischaemic core without
the inclusion of any reversible ischaemic damage. Our follow-up study indicates that both ADC (r2=0.93) and StO
2 (r2=0.68) ROI correlate with the final necrosis, which was
overestimated by diffusion imaging.
3
INTRODUCTION
Stroke is a major public health issue due to the socioeconomic burden of stroke-induced disability.1 Ischaemic stroke is the most common subtype of stroke (accounting for around
80% of all stroke cases), resulting from an arterial occlusion that dramatically decreases local brain perfusion. Cerebral ischaemia is a complex and dynamic process that spans hyperacute to acute, subacute and chronic phases. When diagnosed quickly, ischaemic stroke can be treated by thrombolysis, using recombinant tissue plasminogen activator (rtPA).2 Mechanical
thrombectomy via an endovascular route can be performed either as an alternative to thrombolysis to reduce the risk of brain haemorrhage3 or in association with rtPA.4 Patients
can benefit from thrombolysis up to 6 hours after ischaemic stroke onset.5 However, evidence
suggests that time alone is not sufficient to optimally select patients for thrombolysis. Neuroimaging can play an influential role in refining treatment decisions by correctly distinguishing between salvageable tissue and the central irreversible core.6
Indeed, two distinct regions can be detected during the acute phase of stroke: an ischaemic core that is severely and irreversibly damaged, and a zone of “penumbra” defined as an ischaemic tissue that is functionally impaired and at risk of infarction but has the potential to be salvaged.7,8 Currently, the standard imaging technique to identify the penumbra is positron
emission tomography (PET)15O
2.9 However, the use of PET imaging in acute stroke remains
limited in clinical practice by its high cost, relative invasiveness and limited availability. A more widely available alternative is perfusion-weighted imaging (PWI)/diffusion-weighted imaging (DWI) mismatch MRI. Using MRI, the ischaemic core is detected as the zone of water diffusion abnormality, while the penumbra area is indirectly detected as the mismatch between the zone of perfusion deficit and the zone of diffusion abnormality. Recently, it has been observed that an area of diffusion alteration that shows a modest apparent diffusion decrease could be salvaged with timely reperfusion.10 Different degrees of severity within the
4 apparent diffusion coefficient (ADC) lesion were detected using PWI (mean transit time).11 A
pilot clinical study using 18FMISO PET also reported the presence of extensive penumbra in
each patient (n = 3), which included the zone of abnormality identified by DWI9. This
suggested that ADC may not be the best biomarker for an ischaemic core or predictor of the final lesion.
Recent advances in brain imaging techniques offer new tools to characterize the ischaemic lesion. Currently, it is possible to map microvascular parameters such as vessel size index (VSI),12 vessel density (VD),13,14 and brain tissue oxygen saturation (StO
2) in a voxelwise
basis, using a multiparametric quantitative blood oxygenation level-dependent (mqBOLD) approach.15,16
Changes in infarct progression may be better detected with voxel-based methods than with methods using volumetric mismatches.17 In this way, these new parameters might allow a
more accurate identification of salvageable areas and the core (irreversible damage) within the ADC lesion. Based on previous studies,16,18 a drop in StO
2 below 40% of control levels
predicts irreversible damage. However, it is not yet known how ADC and StO2 compare in the
context of acute stroke. The specific goals of this study were: 1) to investigate the sensitivity of StO2 to detect an acute stroke lesion (compared to ADC); 2) to assess the distribution of
hypoxic zones within the ADC lesion, and their impact on haemodynamic parameters; and 3) to assess the potential of combined StO2 and ADC to predict the final necrosis (three weeks
after stroke onset).
To address these goals, we used a multiparametric MRI protocol, which combined standard diffusion/perfusion maps with the acquisition of novel MRI parameters (VSI, VD, and StO2).
We examined these MRI parameters within four regions of interest (ROI): the lesion detected on ADC (ROI LesionD0), the zone of mismatch CBF (cerebral blood flow)/ADC (ROI
5 Mismatch), the zone with a StO2below 40% within the ADC lesion (ROI Hypoxia) and the
contralateral tissue (ROI Contra).
MATERIALS AND METHODS
All procedures and animal care were in accordance with French government guidelines and were performed under permit numbers 380820 and A3851610008 (for experimental and animal care facilities) from the French Ministry of Agriculture. The study design was approved by the “Grenoble Institute of Neuroscience” local ethics committee for animal care and use (agreement number 004). This study is in compliance with the ARRIVE guidelines (Animal Research: Reporting in Vivo Experiments).19 Male Sprague Dawley rats (n = 38;
294±93 g; age = 7 weeks) were obtained from Charles River (France), and housed in groups of 3-4 in Plexiglas cages under standard laboratory conditions (12 h light/dark cycle with lights off at 7:00 p.m. and at a controlled temperature of 22±2 °C). Water and standard laboratory chow were provided ad libitum. Figure 1a shows the full experimental protocol.
Animal preparation
For all experimental procedures with a potential risk of pain or discomfort for the animals, anaesthesia was induced by inhalation of a gas mixture of 5% isoflurane (IsoFlo, Abbot Laboratories Ltd, Berkshire, UK) in medical air through a facial mask and maintained between 1.0-2.5% of isoflurane during the surgical procedures and MRI acquisition. Body temperature was monitored by a rectal probe and maintained at 37 °C ± 0·5°C via a heating blanket. The tail vein was equipped with a catheter to deliver the contrast agent.
6
Middle cerebral artery occlusion surgery
Focal brain ischaemia was induced by middle cerebral artery occlusion (MCAo) using the intraluminal filament technique.20 The incision site was shaved, cleaned and injected
subcutaneously with 2 mg/kg 0.05% Bupivacaine (Pfizer, France). Briefly, the right carotid arterial tree was isolated. A monofilament (silicon rubber-coated monofilaments: 0.37 mm in diameter, Doccol, Sharon, MA, USA) was advanced from the lumen of the external carotid artery into the internal carotid artery to occlude the right MCA at its origin. The external carotid artery was ligated, the occipital artery branch of the external carotid artery and superior thyroid artery were isolated and electro-cauterized. After 20 minutes of MCAo, the MRI session began. At the end of the MRI session, the filament was retracted to allow reperfusion. Therefore, ischaemia lasted around 100 minutes (Fig. 1a).
Magnetic Resonance Imaging Protocol
MRI was performed at day 0 (multiparametric protocol, duration: 53 min) and at day 21 (anatomical and diffusion sequences, duration: 20 min).
All MRI data were acquired using a 4.7T magnet (Bruker Biospec®, Germany) (MRI facility IRMaGe, Grenoble, France). After securing the animal in a cradle using tooth and ear bars to restrict head movement, a volume coil for excitation and a surface coil for detection were used. The slice orientation was identical for all MRI sequences. During each MRI session, physiological variables were continuously monitored.
The multiparametric MRI protocol was as follows. After a pilot sequence to ensure the correct rat position, anatomical T2-weighted (T2W) images were acquired using a spin-echo sequence
(repetition time (TR)/echo time (TE) = 7000/50 ms, 31 slices with a voxel size = 234x234x800 µm). ADC was mapped using diffusion-weighted, spin-echo, single-shot echo-planar imaging (TR/TE = 2250/33 ms, 8 averages, 9 slices, voxel size = 234x234x800 µm).
7 This sequence was applied four times, once without diffusion weighting and three times with diffusion weighting (b = 800 s/mm2) in three orthogonal directions. CBF was determined
using pseudo continuous arterial spin labelling (pCASL) with an echo-planar imaging (EPI) readout (spin-echo EPI, TR/TE = 3600/21ms, labelling duration = 3 s, post-labelling delay = 400 ms, 50 label/control pairs, 5 slices with voxel size = 234x234x800 µm). Note that the use of a fixed 400 ms post-labelling delay may not account for all arterial delays that occur during experimental ischaemic stroke. In practice, this approach may underestimate the absolute CBF values in the lesion territory. A T1 map was obtained using an inversion-recovery sequence
(TR/TE = 8000/33 ms; 15 inversion times: 35-7000; 5 slices; voxel size = 234x234x800 µm). A T2 map was obtained using a multi spin-echo sequence (26 echoes; TR/TE = 2000/12-312
ms; 5 slices; voxel size = 234x234x800 µm). A high resolution T2* map was obtained from a
3D multiple-gradient echo sequence (15 echoes; TR/TE = 100/4-67ms; 26 slices; voxel size = 117x117x200 µm). A blood volume fraction (BVf) map was obtained using a steady-state approach 12. A multiple-gradient echo sequence (16 gradient echoes; TR/TE = 4000/3-56 ms,
and 1 spin echo TE = 60ms; 5 slices, voxel size = 234x234x800 µm) was performed before, and one minute, after an intravenous injection of ultrasmall superparamagnetic iron oxide nanoparticles (USPIO) contrast agent (P904, 200 µmol of iron/kg, Guerbet S.A., Aulnay-sous-bois, France) flushed with 250 µL of saline.
At day 21, the MRI protocol was composed of the same anatomical and ADC sequences.
Histology
After euthanasia at day 21, brains were quickly removed, frozen in -40 °C isopentane, and stored at -80 °C until processing. Coronal cryosections (20 µm thick) were cut along the entire lesion at -20 °C on a cryotome (Leica, Nanterre, France).
8 Haematoxylin-erytrosine (HE) staining was performed according to the manufacturer’s instructions on the slice with the largest lesion area to assess the final necrosis (n = 10).
MRI data processing
MRI data were processed using homemade software developed in Matlab 2013 (MathWorks, Natick, MA, USA). This software allows map calculation and the creation of ROIs.
ADC maps were generated with Paravision 5.1 software (Bruker, Germany) computed as the mean of the ADCs measured in the three principal directions of the gradient system. VSI and BVf maps were derived from the change of T2 and T2* induced by injection of iron oxide
particles as previously described.12 VD was derived from the ratio of the changes in transverse
relaxation rates, using the equations 13 to 15 described in Troprès et al. 2015.13 A quantitative
CBF map was computed with the equations described in Alsop et al. 2015 using both the pCASL sequence and the T1 map.21 A StO2 map was computed using the T2 map, T2* map
and BVf map as previously described.15 The spatial resolution of all MRI maps was set to that
of the lowest acquired (234x234x800 µm). Except for ADC maps (9 slices), all parametric maps had 5 slices placed in the centre of the lesion because of technical limitations.
MRI data analysis
At day 0, four ROIs were delineated to evaluate the alterations of the MRI parameters following ischaemia (Fig. 1b). The ROI LesionD0 was obtained by contouring the zone with abnormal diffusion on the ADC map (over 9 slices). The ROI Contra was the “mirror” of the ROI LesionD0 in the contralateral hemisphere. The ROI Mismatch was defined as the
9 difference between the low-CBF ROI manually delineated (over 5 slices) on the CBF map and the ROI LesionD0. To delineate the low-CBF ROI, we searched for anatomically relevant areas (i.e. excluding ventricles) that exhibited a sharp CBF decrease (about 20%). The ROI Hypoxia was automatically defined as the voxels with a StO2 value below 40% and located
within the ROI LesionD0 (over 5 slices). The StO2 threshold of 40% was chosen on the basis
of a previous study demonstrating that a value below 40% is not sufficient for cell survival.18
These four ROIs were transferred to each parametric map.
In addition, two ROIs, ROI HIpsiD0 (9 slices) and ROI HContraD0 (9 slices), were defined by delineating hemispheres on T2W images and excluding ventricles and Corpus callosum.
The volume of each hemisphere was estimated by multiplying the number of voxels in the ROI by the voxel volume (234x234x800 µm3). At day 21, the lesion volume (LesionD21) was
estimated by delineating regions of hyperintensity on the ADC map of the 9 slices (approximately between the coordinates +2.20 and 4.0 mm from bregma) and the ROI ContraD21 was the “mirror” of LesionD21. The volume of each hemisphere (HIpsiD21 and HContraD21) was measured as described above.
The volume occupied by the ROI Hypoxia in the ipsilateral hemisphere was compared to that detected three weeks after, the ROI LesionD21. Finally, we compared the in vivo (MRI) and
ex vivo (histological analysis) detection of the final necrosis at day 21.
The comparison between the volume of the lesion detected on the StO2 map at day 0 and the
final lesion at day 21 was performed using 5 slices, because the StO2 maps had only five
slices (cf. MRI data processing section of Material and Methods). For ADC-based measurements, 9 slices were used. Hemisphere volumes were evaluated at day 0 and day 21 to detect brain oedema or shrinkage. Lesion volume was also evaluated at both time points to assess the ADC lesion fate.
10
Histological data analysis
After HE staining, the slices were digitized at a resolution of 2400-dot-per-inch using a photo scanner (Perfection 4870; Epson, Long Beach, CA) with backlighting. Brain images were imported into the Matlab environment (using homemade software), converted to black and white and then warped (elastic registration) to ensure matching of the histological regions and the anatomical points detected by MRI T2W (1 slice). Briefly, a simple 2D elastic registration
was done in three steps using built-in Matlab functions (MathWorks, Natick, MA, USA): 1) manually selecting control point pairs that correspond to the same anatomical structure between the HE staining and the MRI anatomical image (Matlab function called cpselect); 2) infer the spatial transformation from control point pairs using a piecewise linear transformation (Matlab function called cp2tform); and 3) transform the HE image according to the 2D spatial transformation returned by the cp2tform function (Matlab function called imtransform). The ROI NecrosisD21 was defined by delineating the zone of HE alteration.
Statistical Analysis
We tested the normality of our data distribution using the Shapiro-Wilk test. Comparisons of ROI areas, volumes and parameter values at day 0 were analyzed with Student’s paired t-test if the distribution was normal or by Wilcoxon Signed-rank test otherwise. The Spearman correlation coefficient was used for the correlation analysis of MRI at day 0 and day 21 and the Pearson correlation coefficient was used for the correlation of MRI D21 and histological analysis. Statistical significance was set to p<0.05. Statistical analysis was conducted with statistical software package SPSS 21.0 (IBM, Armonk, USA). Data are presented as mean ± Standard Error of Mean (SEM) for MRI data or mean ± standard deviation (SD) for physiological data.
11
RESULTS
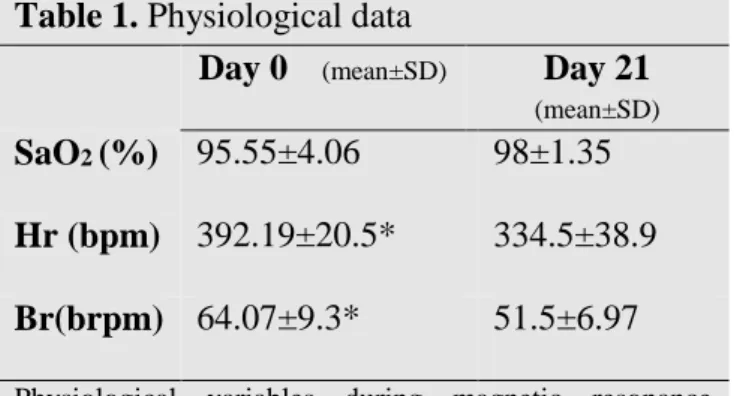
Four animals were excluded for not presenting an ischaemic lesion (n = 2) or because of problems with the contrast agent administration (n = 2). We also lost 22 rats spontaneously due to stroke, and 2 because of deteriorating health, leaving 10 rats in our follow-up study. The mean occlusion time was 101±15 minutes. Physiological variables (day 0 and day 21) were monitored and maintained within physiological limits (Table 1). We found higher heart (HR, p=0.04) and breathing rates (BR, p=0.01) at day 0 than at day 21.
The HIpsi and HContra had similar volumes, at both time points (at day 0: 375.3±3.8 mm3
and 364.9±6.8 mm3, p=0.17; at day 21: 365.0±5.7 and 363.0±5.7mm3, p=0.97 respectively.
Comparisons between HIpsiD0 vs. HIpsiD21 p=0.10; and HContraD0 vs. HContraD21
p=0.88, evaluated by a paired analysis Wilcoxon Signed-rank test) (Fig. 2a and 2b).
Mortality
Rats spontaneously died due to the severity of ischaemia (n = 22) or were euthanized due to deteriorating health (n = 2). The criteria for euthanasia were based on clinical examination and assessment of the rat's level of pain, distress or significant weight loss (20% from preoperative body weight). Rats were euthanized by an intra-cardiac injection of Pentobarbital 200mg/kg (Dolhethal, Vétoquinol Inc, France) under deep anaesthesia by isoflurane (IsoFlo, Abbot Laboratories Ltd, Berkshire, UK).
Effect of ischaemia on MRI parameters during the acute phase
Table 2 and Figure 3 summarize the values of each MRI parameter within each ROI at Day 0 (n = 10). Comparisons between these parameters were based on estimates obtained from 5 slices, with the exception of ADC (9 slices), and were performed by a paired analysis (Student’s paired t-test for a normal distribution or Wilcoxon Signed-rank test otherwise).
12 ADC. As expected, a decreased ADC was observed in the MCA territory following MCAo. The ROIs LesionD0 and Hypoxia showed a similar ADC decrease (p=0.14). The mean ADC within the ROI Mismatch was similar to that of the ROI Contra (p=0.22) (Figure 3b).
Perfusion. The CBF in the ROI Hypoxia was lower than that of the ROI Mismatch (p=0.001) or LesionD0 (p=0.01) (Figure 3c). BVf, measured with a steady-state approach, confirmed a reduced perfusion in the ipsilateral ROIs, with the greatest reduction observed in the ROI Hypoxia, followed by LesionD0 and Mismatch (p=0.04 for the comparison between Hypoxia and the LesionD0 and p<0.01 for comparisons between the other groups) (Figure 3d).
VSI and VD. Figures 3e and 3f show the average VSI and VD, respectively, across all rats and for each ROI. MCAo induced alterations in the apparent microvascular architecture: the three ipsilateral ROIs exhibited larger VSI and lower VD than in the ROI Contra. Moreover, the ROI LesionD0 had higher VSI values than the Mismatch (p=0.05) and Hypoxia (p=0.02) ROIs. VD in ROI Hypoxia was lower than that of ROI Mismatch (p<0.01) but similar to that of ROI LesionD0 (p=0.37).
StO2. Figure 3g shows the mean StO2 values in the different ROIs. The three ipsilateral ROIs
exhibited lower StO2 values than the ROI Contra (StO2=70.2%, p<0.01). As expected, the
lowest values of StO2 were found in the ROI Hypoxia when compared to the ROI LesionD0
(22.3% vs. 46.7% respectively, p=0.01) or to the Mismatch ROI (22.3% vs. 59.8% p=0.01).
13 A paired test showed that the volume of altered ADC (over 9 slices, n = 10 rats) was lower at day 21 (ROI LesionD21: 48.6±19.2 mm3) than at day 0 (ROI LesionD0: 65.8±24 mm3,
p=0.02) (Figure 2b). A good correlation was detected between the two time points (r2=0.93,
y=1.202x +7.435, p<0.01). At Day 21, the ADC values reported in the ROIs LesionD21 and Contra (ADC map) were 1743.7±134.6 µm2/s and 756.2±10 µm2/s, respectively.
Moreover, we compared the volume of ROI Hypoxia detected by MRI at day 0 using the ADC and StO2 maps with the final lesion detected on the ADC map at day 21. We observed
no significant difference in the volume of ROI Hypoxia (24.29mm3±9.57; 5 slices) and the
lesion volume detected at day 21 in the ROI LesionD21 (34.66 mm3±12.87; 5 slices; p=0.64)
(Fig 4). A good correlation was detected between the volume of the ROI Hypoxia and the ROI LesionD21 (r2=0.68, p<0.01) (Figures 4b and 4c).
To check the accuracy of the lesion detection by MRI in the chronic phase, we assessed the correlation between lesions detected in vivo by MRI (ROI LesionD21) and ex vivo by histological staining (ROI Necrosis). We found a good correlation between the in vivo and ex
vivo detection of necrotic area (r2=0.85; p<0.01) (Fig 5). Altogether, these results suggest that
there is a good agreement between the volume of ROI Hypoxia, measured during the acute phase of the stroke, and the chronic lesion volume.
DISCUSSION
The aims of this study were to investigate the sensitivity of StO2 to detect hypoxic areas
during the acute phase of ischaemic stroke compared to ADC, and to assess its potential in predicting the final necrosis. During the acute phase of stroke, both ADC and StO2 detected a
lesion. The results obtained with multiparametric MRI show that the lesion may be divided into three zones with different degrees of severity: the ROIs Mismatch (CBF/ADC mismatch), LesionD0 (the ADC lesion) and Hypoxia (as a part of the ADC lesion). After three weeks, the
14 final lesion volume was smaller than that of the initial ischaemic core defined on the ADC map. StO2 and ADC were equivalent in predicting the final necrosis.
Contralateral hemisphere
Most of the parameter values assessed in the contralateral hemisphere are in agreement with previous reports for ADC,22 BVf, VD,23 CBF,24 and StO
2.16,25 Contralateral VSI values appear
to be slightly higher than those previously reported in literature (7.0±0.6 µm vs. 4.5±0.8 µm).26,27 This result might be explained, as previously reported, by long-term changes in
myogenic reactivity of MCAs in both ischaemic and non-ischaemic hemispheres.28
Penumbra
In this study, the “mismatch” area (ROI Mismatch), usually considered to be a salvageable zone, exhibited the least severe alterations among the three ipsilateral ROIs. Note that this penumbra, being observed around 60 minutes after stroke onset. was evolving more slowly than just after stroke onset. We observed an important reduction in CBF (61.0±5.2 mL/100g/min) compared to the contralateral hemisphere (153.0±4.6 mL/100g/min), but with values compatible with cell survival,29 and no alteration of ADC. For all other parameters
(BVf, VD, StO2), a slight reduction was observed, compared to the contralateral hemisphere,
except for VSI whose values were slightly higher (7.0±0.6 µm vs. 8.1±0.7 µm).
Ischaemic core
Quantitative measures of ADC in previous studies revealed that during ischaemia, ADC declines before energy metabolism fails.30 These results suggest that a reduced ADC area may
15 overestimate the size of the infarct core. In the present study, the ROI LesionD0 (i.e the ADC abnormality) exhibited lower values of ADC, CBF, BVf, VD, and StO2 than the contralateral
hemisphere and the mismatch area. Conversely, VSI was higher in the initial diffusion lesion (LesionD0 ROI) than in the mismatch area and contralateral hemisphere. Regarding both the ischaemic core and the penumbra, the increase in VSI, combined with a decrease in BVf and VD, could result from a decrease in the number of perfused vessels. Indeed, it is unlikely that microvessels have disappeared 1 hour after MCAo. It is more likely that MCAo and oedema prevent blood flow in some vessels, which become inaccessible to contrast agent (USPIO), resulting in an apparent reduction in VD. The increase in VSI suggests that these non-perfused vessels are the smallest in diameter. Alternatively, the increase in VSI could arise from vasodilation of the remaining perfused vessels, or to a combination of both phenomena. The balance between the reduction in VD and the increase in VSI yields a reduction in CBV. The ROI Hypoxia was defined as the pixels located within the diffusion lesion (ROI LesionD0) with a StO2 below 40%. This segmentation yielded the same hypoxic area as that
estimated by pimonidazole ex vivo.16
This threshold was chosen based on a study using near-infrared spectroscopy.18 In the study,
the authors demonstrated that a lactate increase is detected at an oxygen saturation of 44%, minor electroencephalography alterations appear at 42%, and the adenosine thriphosphate (ATP) decreases at 33%.18 In a previous study by our team, a comparison between hypoxic
zones detected in vivo by MRI (threshold of 40% of StO2) and by histological analysis with
pimonidazole was performed.16 Pimonidazole is a bioreductive hypoxic marker that is
activated in an oxygen-dependent manner and is covalently bound to thiol-containing proteins in hypoxic cells.31 This binding is reported in viable hypoxic cells but not in necrotic cells.
The redox-dependent process is progressively inhibited at increasing oxygen tensions and involves the cell-specific action of cellular nitroreductases.32 A good correlation was
16 previously reported between StO2 MRI and pimonidazole-positive hypoxic cells 2 hours after
ischaemia onset.16
The values of the MRI parameters within the hypoxic zone (ROI Hypoxia), located by construction within the diffusion lesion (ROI LesionD0), were in general much lower than those of the two other ipsilateral regions, except for ADC and VD, where the ROI Hypoxia values were similar to LesionD0. The mean value of CBF in the ROI Hypoxia (31.0±1.4 mL/100g/min) was no longer compatible with cell survival 29. StO
2 fell to 22.0±0.6%; in the
ROI LesionD0 it was 47.0±1.4%. BVf was also reduced (from 2.2±0.7 to 1.9±0.1%) but to a lesser extent. Note that we could not find a BVf or a CBF threshold that could yield the same Hypoxia area as that detected with the 40% StO2 threshold.
Altogether, our results demonstrate that StO2 is a discriminant parameter to detect the most
severe ischaemic areas within the zone of ADC decrease. In this way, our data confirmed our hypothesis that the zone of ADC decrease is heterogeneous, based on our vascular and oxygenation results.
In the present study, the reperfusion was performed after the MRI acquisition, and we therefore investigated hypoperfused areas. It should be noted that if the artery had already been recanalized at the time of scanning, the blood vessel StO2 concentration would have been
high even in zones of already dead tissue. In such cases, StO2 values would not represent
brain tissue oxygenation. The morphology and function of cerebral capillaries undergo profound changes during cerebral ischaemia. Capillary constrictions regulated by pericytes could block the blood supply; this could explain the occasional absence of tissue reperfusion even after the large-vessel recanalization. This result corresponds to the well-described no-reflow phenomenon.33 This neurovascular dysfunction involves the formation of reactive
species of oxygen at the level of the vascular endothelium, and affects the local oxygen delivery.33
17 In clinical settings, a spontaneous reperfusion could be a limitation for the detection of an ischaemic core using a low StO2 threshold. Abnormally high StO2 and normal CBF values
could also be a marker of already dead tissue.
Evolution of the ischaemic lesion
The final lesion volume was estimated from the area of increased ADC (LesionD21: 1743.7±134.6 µm2/s vs. ContraD21: 756.2±10 µm2/s). This increase in ADC, in line with a
previous study,34 is a consequence of cell death and subsequent cavitation of brain tissue
being filled by liquid and cell debris. The final lesion volume (48.5 mm3) was smaller than the
initial volume (65.8 mm3). In accordance with previous reports,35 this suggests that an altered
ADC during the acute phase does not necessarily yield a lesion. In addition, some morphological changes were detected at day 21 such as brain shrinkage and enlargement of ventricles (Figure 3a). Brain shrinkage, a process commonly associated with stroke, occurs not only in the perilesional zone but also in contralateral hemisphere.36 Additional processes,
such as axonal degeneration, are involved in shrinkage, and result in expansion of the lesion to include remote regions connected to the affected area.36,37
The ischaemic lesion has a complex and dynamic physiopathology process, and even after reperfusion the lesion can continue to change. One limitation of our study is that our estimation of the hypoxic zone (ROI Hypoxia based on the StO2 map) did not take into
account neighbouring voxels. Indeed a recent study, which considered each voxel independently, showed that the distribution of intensities surrounding a voxel at the early ischaemic stages may capture the dynamic of the lesion growth and be predictive of tissue outcome.6,38
There was a good correlation between the volume of the MRI lesion detected at day 0, 1 hour after stroke onset, by StO2 map (ROI Hypoxia) or by ADC (ROI LesionD0), and the volume
18 measured at day 21 (ROI LesionD21), which corresponded to that of Necrosis D21, estimated post-mortem. Due to the above mentioned morphological changes that occur between day 0 and day 21, we were not able to conduct a pixel-by-pixel analysis to determine whether each voxel of the StO2 lesion evolved towards necrosis. Nevertheless, we observed that LesionD0
tended to overestimate the volume of LesionD21, while Hypoxia tended to underestimate it. Further studies are needed, including MRI maps obtained at several time points between 30 and 90 minutes after a stroke for the acute phase, and obtained 1 or 2 days after a stroke for the late phase, to assess the fate of low StO2 voxels within the ADC lesion and determine
whether StO2 MRI is a better predictor of the final infarct than ADC alone.
Study Limitations
The primary limitation of our study is the mortality rate. We lost around 60% of animals, including the animals euthanized due to deteriorating health. Our model of ischaemic stroke promotes a massive lesion that includes the fronto-parietal cortex and striatum. In our experience, a short occlusion time promotes smaller and more heterogeneous lesions. To avoid this heterogeneity, we used a minimum occlusion time of 90 minutes. This resulted in a high number of large homogeneous lesions, but also in a higher mortality. The mortality in this case can be linked to complications that are common in large stroke, such as cerebral oedema and haemorrhagic transformation. The majority of rats died after the filament retraction. The actual American Heart Association /American Stroke Association guidelines recommend not reperfusing patients with severe stroke.39 Note that our study, like all stroke
studies, is biased towards small stroke lesions: indeed, as reported in the Results section, rats with large lesions died early.
A second point is that a voxel-based evaluation of the lesion progression over time is inherently challenging. Firstly, because it requires the exact same placement of the rats in the
19 magnet, and secondly because of the occurrence of brain shrinkage and/or ventricle enlargement. Overall, the registration quality was not sufficient to allow voxel-by-voxel analysis. However the co-localization was visually inspected and we observed a coherent evolution of infarction.
An additional limitation is that here we use manual contouring for the diffusion map. The zone of ADC abnormality could be also detected using thresholds to detect the voxels with the most severe decrease of ADC. This method of detection has previously been used in a clinical study of patients with persistent arterial occlusion.35
In the present study, we focused on StO2 mapping for core discrimination but other
parameters such as BVf or CBF could be used to estimate stroke severity within the zone of ADC decrease. For this, perfusion thresholds should be used to detect the voxels corresponding to the irreversibly damaged zones. Engelhorn et al. 2005 evaluated the absolute CBF using radioactive-labelled microspheres.29 They demonstrated that the baseline CBF
(before MCAo) is variable by region, for example between the parietal (0.88±0.26 mL/g/min) and temporal cortex (0.74±0.24 mL/g/min). In addition, this difference is increased in ischaemic conditions, dropping to 0.51± 0.21 mL/g/min in the parietal cortex and 0.20± 0.15 mL/g/min in the temporal cortex.29 Thirty minutes after MCAo, the absolute CBF in viable
areas was 0.39 ± 0.15 mL/g/min, while in hypoxic brain tissue the CBF average was 0.30± 0.09 mL/g/min.29 Hypoxic zones detected by the StO
2 (<40%) mapping could be compared
with those detected by perfusion using a threshold. Wu et al. 2006 reported that the use of automated threshold techniques by MR-based algorithms combining PWI and DWI was more sensitive to the detection of salvageable areas (penumbra) than diffusion alone.17 A limitation
of our study is that we have not performed the analysis based on perfusion. Brain oxygenation is linked to perfusion (BVf), and perfusion could provide a similar core discrimination to StO2.
20
Summary
The voxel-based analysis performed using the StO2 map reveals heterogeneity within the
ischaemic zone in the acute phase. Diffusion imaging is commonly employed during the acute phase of ischaemic stroke to detect the ischaemic core. We report that the zone of ADC decrease includes voxels with different degrees of severity, as confirmed by the multiparametric analysis including CBF, BVf, VSI and StO2. This study therefore provides
evidence of the utility of a multiparametric analysis including StO2 mapping to more
accurately analyze the severity and heterogeneity of brain focal ischaemia. Our follow-up study indicated that both ADC and StO2 MRI maps were able to predict the final necrosis.
However, the lesion volume detected by ADC mapping decreased significantly three weeks after stroke. This could indicate that salvageable tissue is included within the initial diffusion lesion.
Few microvascular MRI studies concerning stroke have been conducted.13 As far as we know,
this is the first study assessing the VSI and VD during the acute phase in a model of ischaemic stroke.
Currently, the most common methods of analysis of CT and MRI images in clinical settings are volumetric-based, and until voxel-based analysis becomes available, perfusion-diffusion mismatch is useful in clinical settings.40 Overall, a multiparametric approach appears to be
promising in depicting the severity of a stroke, but such an approach still requires further validation and simplification of data analysis. For clinics, the use of this MRI methodology to identify heterogeneous acute stroke could be useful to better select the optimal candidates for recanalisation procedures.
21 •Acknowledgements: The authors gratefully acknowledge the excellent technical support of the MRI Facility of Grenoble (IRMaGe). IRMaGe was partly funded by the French programme “Investissement d’Avenir” run by the ‘Agence Nationale pour la Recherche’; grant 'Infrastructure d’avenir en Biologie Santé' - ANR-11-INBS-0006. We also acknowledge the CAPES Foundation, Ministry of Education of Brazil, for the financial support of our PhD student.
•Author Contribution statement:
L.S.B.B has participated in all steps of this study including study design, experiments, MRI acquisition, histology, data processing and analysis, interpretation of the data and writing of the paper; B.L performed the experiments, analyzed the MRI data, interpreted the data and wrote the paper; L.H performed the MRI acquisition; E.B, A.M, O.D and V.H designed the study; C.R and E.B interpreted the data and wrote and revised the paper.
22
References
1 Feigin VL, Forouzanfar MH, Krishnamurthi R, Mensah GA, Connor M, Bennett DA et al. Global and regional burden of stroke during 1990–2010: findings from the Global Burden of Disease Study 2010. Lancet 2014; 383: 245–254.
2 Kwiatkowski TG, Libman RB, Frankel M, Tilley BC, Morgenstern LB, Lu M et al. Effects of Tissue Plasminogen Activator for Acute Ischemic Stroke at One Year. N Engl J
Med 1999; 340: 1781–1787.
3 Smith WS, Sung G, Starkman S, Saver JL, Kidwell CS, Gobin YP et al. Safety and Efficacy of Mechanical Embolectomy in Acute Ischemic Stroke Results of the MERCI Trial. Stroke 2005; 36: 1432–1438.
4 Campbell BCV, Donnan GA, Lees KR, Hacke W, Khatri P, Hill MD et al. Endovascular stent thrombectomy: the new standard of care for large vessel ischaemic stroke. Lancet
Neurol 2015; 14: 846–854.
5 Wang H, Chen M, Wang F, Dai L, Fei A, Liu J et al. Comparison of Therapeutic Effect of Recombinant Tissue Plasminogen Activator by Treatment Time after Onset of Acute Ischemic Stroke. Sci Rep 2015; 5. doi:10.1038/srep11743.
6 Scalzo F, Nour M, Liebeskind DS. Data science of stroke imaging and enlightenment of the penumbra. Stroke 2015; 6: 8.
7 Donnan GA, Davis SM. Neuroimaging, the ischaemic penumbra, and selection of patients for acute stroke therapy. Lancet Neurol 2002; 1: 417–425.
8 Astrup J, Siesjö BK, Symon L. Thresholds in cerebral ischemia - the ischemic penumbra.
Stroke J Cereb Circ 1981; 12: 723–725.
9 Alawneh JA, Moustafa RR, Marrapu ST, Jensen-Kondering U, Morris RS, Jones PS et al. Diffusion and perfusion correlates of the 18F-MISO PET lesion in acute stroke: pilot study. Eur J Nucl Med Mol Imaging 2013; 41: 736–744.
10 Kidwell CS, Saver JL, Mattiello J, Starkman S, Vinuela F, Duckwiler G et al. Thrombolytic reversal of acute human cerebral ischemic injury shown by diffusion/perfusion magnetic resonance imaging. Ann Neurol 2000; 47: 462–469.
11 Carrera E, Jones PS, Alawneh JA, Klærke Mikkelsen I, Cho T-H, Siemonsen S et al. Predicting infarction within the diffusion-weighted imaging lesion: does the mean transit time have added value? Stroke J Cereb Circ 2011; 42: 1602–1607.
12 Troprès I, Grimault S, Vaeth A, Grillon E, Julien C, Payen JF et al. Vessel size imaging.
Magn Reson Med Off J Soc Magn Reson Med Soc Magn Reson Med 2001; 45: 397–408.
13 Troprès I, Pannetier N, Grand S, Lemasson B, Moisan A, Péoc’h M et al. Imaging the microvessel caliber and density: Principles and applications of microvascular MRI. Magn
23 14 Wu EX, Tang H, Jensen JH. High-resolution MR imaging of mouse brain microvasculature using the relaxation rate shift index Q. NMR Biomed 2004; 17: 507– 512.
15 Christen T, Lemasson B, Pannetier N, Farion R, Segebarth C, Rémy C et al. Evaluation of a quantitative blood oxygenation level-dependent (qBOLD) approach to map local blood oxygen saturation. NMR Biomed 2011; 24: 393–403.
16 Christen T, Bouzat P, Pannetier N, Coquery N, Moisan A, Lemasson B et al. Tissue oxygen saturation mapping with magnetic resonance imaging. J Cereb Blood Flow Metab
Off J Int Soc Cereb Blood Flow Metab 2014; 34: 1550–1557.
17 Wu O, Christensen S, Hjort N, Dijkhuizen RM, Kucinski T, Fiehler J et al. Characterizing physiological heterogeneity of infarction risk in acute human ischaemic stroke using MRI.
Brain J Neurol 2006; 129: 2384–2393.
18 Kurth CD, Levy WJ, McCann J. Near-infrared spectroscopy cerebral oxygen saturation thresholds for hypoxia-ischemia in piglets. J Cereb Blood Flow Metab Off J Int Soc Cereb
Blood Flow Metab 2002; 22: 335–341.
19 Kilkenny C, Browne W, Cuthill IC, Emerson M, Altman DG. Animal research: reporting in vivo experiments—The ARRIVE Guidelines. J Cereb Blood Flow Metab 2011; 31: 991–993.
20 Longa EZ, Weinstein PR, Carlson S, Cummins R. Reversible middle cerebral artery occlusion without craniectomy in rats. Stroke J Cereb Circ 1989; 20: 84–91.
21 Alsop DC, Detre JA, Golay X, Günther M, Hendrikse J, Hernandez-Garcia L et al. Recommended implementation of arterial spin-labeled perfusion MRI for clinical applications: A consensus of the ISMRM perfusion study group and the European consortium for ASL in dementia. Magn Reson Med 2015; 73: spcone.
22 Shen Q, Meng X, Fisher M, Sotak CH, Duong TQ. Pixel-by-Pixel Spatiotemporal Progression of Focal Ischemia Derived Using Quantitative Perfusion and Diffusion Imaging. J Cereb Blood Flow Metab 2003; 23: 1479–1488.
23 Lemasson B, Valable S, Farion R, Krainik A, Rémy C, Barbier EL. In vivo imaging of vessel diameter, size, and density: A comparative study between MRI and histology.
Magn Reson Med 2013; 69: 18–26.
24 Coquery N, Francois O, Lemasson B, Debacker C, Farion R, Rémy C et al. Microvascular MRI and unsupervised clustering yields histology-resembling images in two rat models of glioma. J Cereb Blood Flow Metab 2014; 34: 1354–1362.
25 Lemasson B, Christen T, Serduc R, Maisin C, Bouchet A, Le Duc G et al. Evaluation of the Relationship between MR Estimates of Blood Oxygen Saturation and Hypoxia: Effect of an Antiangiogenic Treatment on a Gliosarcoma Model. Radiology 2012; 265: 743–752. 26 Troprès I, Lamalle L, Farion R, Segebarth C, Rémy C. Vessel size imaging using low intravascular contrast agent concentrations. Magn Reson Mater Phys Biol Med 2004; 17: 313–316.
24 27 Valable S, Lemasson B, Farion R, Beaumont M, Segebarth C, Remy C et al. Assessment of blood volume, vessel size, and the expression of angiogenic factors in two rat glioma models: a longitudinal in vivo and ex vivo study. NMR Biomed 2008; 21: 1043–1056. 28 Winters A, Taylor JC, Ren M, Ma R, Liu R, Yang S-H. Transient focal cerebral ischemia
induces long-term cerebral vasculature dysfunction in a rodent experimental stroke model.
Transl Stroke Res 2012; 3: 279–285.
29 Engelhorn T, Doerfler A, Forsting M, Heusch G, Schulz R. Does a Relative Perfusion Measure Predict Cerebral Infarct Size? Am J Neuroradiol 2005; 26: 2218–2223.
30 Ramos-Cabrer P, Campos F, Sobrino T, Castillo J. Targeting the ischemic penumbra.
Stroke J Cereb Circ 2011; 42: S7-11.
31 Varia MA, Calkins-Adams DP, Rinker LH, Kennedy AS, Novotny DB, Fowler Jr. WC et
al. Pimonidazole: A Novel Hypoxia Marker for Complementary Study of Tumor Hypoxia
and Cell Proliferation in Cervical Carcinoma. Gynecol Oncol 1998; 71: 270–277.
32 Bergeron M, Evans SM, Sharp FR, Koch CJ, Lord EM, Ferriero DM. Detection of hypoxic cells with the 2-nitroimidazole, EF5, correlates with early redox changes in rat brain after perinatal hypoxia–ischemia. Neuroscience 1999; 89: 1357–1366.
33 Østergaard L, Jespersen SN, Mouridsen K, Mikkelsen IK, Jonsdottír KÝ, Tietze A et al. The Role of the Cerebral Capillaries in Acute Ischemic Stroke: The Extended Penumbra Model. J Cereb Blood Flow Metab 2013; 33: 635–648.
34 Foley LM, Hitchens TK, Barbe B, Zhang F, Ho C, Rao GR et al. Quantitative temporal profiles of penumbra and infarction during permanent middle cerebral artery occlusion in rats. Transl Stroke Res 2010; 1: 220–229.
35 Oppenheim C, Samson Y, Manaï R, Lalam T, Vandamme X, Crozier S et al. Prediction of Malignant Middle Cerebral Artery Infarction by Diffusion-Weighted Imaging. Stroke 2000; 31: 2175–2181.
36 Seghier ML, Ramsden S, Lim L, Leff AP, Price CJ. Gradual lesion expansion and brain shrinkage years after stroke. Stroke J Cereb Circ 2014; 45: 877–879.
37 Kraemer M, Schormann T, Hagemann G, Qi B, Witte OW, Seitz RJ. Delayed Shrinkage of the Brain After Ischemic Stroke: Preliminary Observations With Voxel-Guided Morphometry. J Neuroimaging 2004; 14: 265–272.
38 Scalzo F, Hao Q, Alger JR, Hu X, Liebeskind DS. Regional prediction of tissue fate in acute ischemic stroke. Ann Biomed Eng 2012; 40: 2177–2187.
39 Jauch EC, Saver JL, Adams HP, Bruno A, Connors JJ (Buddy), Demaerschalk BM et al. Guidelines for the Early Management of Patients With Acute Ischemic Stroke A Guideline for Healthcare Professionals From the American Heart Association/American Stroke Association. Stroke 2013; 44: 870–947.
40 Albers GW, Thijs VN, Wechsler L, Kemp S, Schlaug G, Skalabrin E et al. Magnetic resonance imaging profiles predict clinical response to early reperfusion: The diffusion
25 and perfusion imaging evaluation for understanding stroke evolution (DEFUSE) study.
26
Figure legends
Figure 1. a) Experimental protocol. Ischaemic stroke induction by Middle Cerebral Artery
occlusion (MCAo). MRI protocol acquisition started 20 minutes after MCAo, lasting for 53 minutes at day 0. Reperfusion took place 90 minutes after MCAo. MRI acquisition was repeated 21 days after (duration 20 minutes); finally the animals were euthanized for histological analyses; n = 10 rats. b) Representative image of regions of interest (ROIs) delineated on the ADC (apparent diffusion coefficient) map: ROIs measured at day 0: LesionD0, ContraD0, hemisphere (H) ipsilateral (ipsi) HIpsiD0, and HContraD0. ROIs measured at day 21: LesionD21, ContraD21, HIpsiD21, and HContraD21. ROI Mismatch was delineated on the CBF (cerebral blood flow) map; ROI Hypoxia was delineated on the StO2
(brain tissue oxygen saturation) map.
Figure 2. a) Evolution of the apparent diffusion coefficient (ADC) map of a rat brain from
one animal during middle cerebral artery occlusion at day 0 (D0) and 21 days after (D21). b) Volume of the cerebral hemispheres: Ipsilateral (HIpsi) and contralateral to the lesion (HContra) at D0 and D21, and volume of the altered zone detected by diffusion MRI during middle cerebral artery occlusion. Region of interest (ROI) LesionD0 at day 0 and at D21 (LesionD21) over the 9 slices of ADC map. *Difference between the MR diffusion alteration volume at D0 and D21 detected by Wilcoxon Signed-Rank test (p=0.02). c) Correlation between the volumes of ROI Lesion at day 0 and day 21 r2=0.93, p<0.001, y=1.202x +7.435
(n = 10).
Figure 3. a) Representative images of multiparametric MRI post-ischaemic stroke. Six MRI
parameters were mapped: apparent diffusion coefficient (ADC); cerebral blood flow (CBF); blood volume fraction (BVf); vessel size index (VSI); Vessel density (VD) and brain tissue
27 oxygen saturation (StO2). The grey scale bar represents the range of values of each map. 3.2
Comparison of values of each MRI parameter: b) ADC, c) CBF, d) BVf, e) VSI, f) VD and g) StO2 within each region of interest (Contra, Mismatch, LesionD0 and Hypoxia) at Day 0.
*Significant difference detected by paired Student t-test comparison (for ADC, CBF, BVf, VSI and StO2 maps) or by Wilcoxon Signed-rank (for VD map) p<0.05, n = 10.
Figure 4. a) Volume of Lesion at day 0 and at day 21. Representative images of the MRI
maps at day 0 (D0) (StO2, brain tissue oxygen saturation map) and at day 21 (ADC D21). b)
Comparison of the volume of the ROI Hypoxia and LesionD21 over 5 slices expressed in mean and the standard error of mean (SEM). No significant differences were detected between the volume occupied by the ROI LesionD21 (34.66mm3±12.87) and ROI Hypoxia
(24.29mm3±9.57) (p=0.05) 0. c) Correlation between the volume of ROI Hypoxia vs.
LesionD21; the correlation coefficient was r2=0.67, p=0.005, y=0,63x +0,98 (n = 10).
Figure 5. Quantitative correlation between in vivo and ex vivo evaluation. a) Representative
images of apparent diffusion coefficient (ADC) at day 21 (used to define ROI LesionD21) and haematoxylin erythrosine (HE) staining (used to define ROI NecrosisD21). b) Correlation between the size of ROI LesionD21 and ROI NecrosisD21. Dashed line represents identity; solid line represents the limiar. Pearson coefficient correlation was r2=0.85, p=0.001, y=1,04x
28
Table 1. Physiological data
Day 0 (mean±SD) Day 21 (mean±SD) SaO2 (%) 95.55±4.06 392.19±20.5* 98±1.35 334.5±38.9 Hr (bpm) Br(brpm) 64.07±9.3* 51.5±6.97
Physiological variables during magnetic resonance imaging acquisition. Saturation of oxygen (SaO2), heart
rate (HR), beats per minute (bpm); breathing rate (BR), breaths per minute (brpm). Data are expressed as mean ± standard deviation (SD), n=10. * Significant difference detected by paired Student t-test p<0.05.
Table 2. Magnetic Resonance Imaging parameter values in each Region of interest Regions of interest (mean ± SEM)
MRI parameters Contra LesionD0 Mismatch Hypoxia
ADC (µm2/s-1) 763±15.6 576.7±16.3 742±7.5 563±16.1# CBF (mL/100g/min) 153±4.6 46±5.1 61±5.2 31±2.0# BVf (%) 4± .1 2.± .1 3± .1 2± .1# VSI (µm) 7± .6 10±.9 8± .7 9± .8 VD (mm-2) 289±39.9 147±40.8 230±41.4 139±51.1# StO2 (%) 70±1.5 47±1.4 60±2.2 22± .6#
Magnetic resonance imaging (MRI), apparent diffusion coefficient (ADC); cerebral blood flow (CBF); blood volume fraction (BVf); vessel size index (VSI); vessel density (VD) and brain tissue oxygen saturation (StO2). Significant
differences detected by paired Student t-test comparison (for ADC, CBF, BVf, VSI and StO2 maps) or by Wilcoxon
Signed-rank (for VD map). In bold, ROIs different from LesionD0; # from ROI Mismatch. For all MRI parameters evaluated, the ROIs Mismatch, LesionD0 and Hypoxia were different from ROI Contra, except for the ROI mismatch in ADC. Data are expressed as mean and standard error of mean (SEM) p<0.05.
29 Figure 1
30 Figure 2
31 Figure 3
32 Figure 4
33 Figure 5