Publisher’s version / Version de l'éditeur:
ASTM Special Technical Publication, 361, pp. 390-397, 1965-06-01
READ THESE TERMS AND CONDITIONS CAREFULLY BEFORE USING THIS WEBSITE.
https://nrc-publications.canada.ca/eng/copyright
Vous avez des questions? Nous pouvons vous aider. Pour communiquer directement avec un auteur, consultez la première page de la revue dans laquelle son article a été publié afin de trouver ses coordonnées. Si vous n’arrivez pas à les repérer, communiquez avec nous à PublicationsArchive-ArchivesPublications@nrc-cnrc.gc.ca.
Questions? Contact the NRC Publications Archive team at
PublicationsArchive-ArchivesPublications@nrc-cnrc.gc.ca. If you wish to email the authors directly, please see the first page of the publication for their contact information.
NRC Publications Archive
Archives des publications du CNRC
This publication could be one of several versions: author’s original, accepted manuscript or the publisher’s version. / La version de cette publication peut être l’une des suivantes : la version prépublication de l’auteur, la version acceptée du manuscrit ou la version de l’éditeur.
Access and use of this website and the material on it are subject to the Terms and Conditions set forth at
A transducer to measure pore water pressures in soil tests
Burn, K. N.
https://publications-cnrc.canada.ca/fra/droits
L’accès à ce site Web et l’utilisation de son contenu sont assujettis aux conditions présentées dans le site LISEZ CES CONDITIONS ATTENTIVEMENT AVANT D’UTILISER CE SITE WEB.
NRC Publications Record / Notice d'Archives des publications de CNRC:
https://nrc-publications.canada.ca/eng/view/object/?id=29e9c164-12e2-4b72-b4c7-b5001f7ef3bc https://publications-cnrc.canada.ca/fra/voir/objet/?id=29e9c164-12e2-4b72-b4c7-b5001f7ef3bc
A 1'RANSDUCER TO MEASURE PORE WATER PRESSURES I N SOIL TESTS BY K. N. BURN'
A pressure transducer with very small volume compliance has been adapted to measure and record the pore water pressures which develop during loading tests on saturated soil specimens in the laboratory. The technique described uses an unbonded, strain gage type of pressure transducer. Details are given
of the ancillary electrical circuitry, the method of mounting, and the calibra- tion of the system.
Pore pressures which are generated in soil specimens during laboratory triaxial tests are usually measured by balancing them against pressures applied from hand pumps. Accurate measurements of pressure are obtained only if the flow of water into or out of the specimen is negligible. This is generally attained by controlling, within certain visual limits, a slug of mercury trapped inside a tube of small diameter between the internal and external fluid systems. Because this is a manual operation it requires con- tinuous attention.
Electronically controlled devices which generate pressure as required to balance the pore pressures developed in the soil specimen are a ~ a i l a b l e . ~ Such instru- ments require a good deal of mainte- nance, and they respond too slowly for some tests. These disadvantages led to the search for a closed system device which would be sufficiently sensitive to measure small pressure changes with
negligible changes in volume. Such a device has beell used a t the Bureau of Reclamation for some years.3
Within recent years a variety of electro-mechanical devices, known as transducers, have been developed. One of these, designed to measure fluid pres- sures against a small diaphragm, was found to be suitable for measuriilg pore water pressures in the laboratory. The resulting system requires little attelltion and makes it possible to record pres- sures-a great advantage when conduct- ing long-term tests.
This paper describes an automatic recording system of this kind installed in the Soil Mechanics Laboratory, Division of Building Research, National Research Council, and includes brief descriptions of the pressure transducer, the pressure block in which it is housed, the circuitry connecting the transducer to the re- corder, and the calibration of the equipment.
1 Research officer, Soil Mechanics Section,
Division of Building Research, National Re- H. J. Gibbs, J. W. Hilf, mT. G. Holtz, and
search Council, Ottawa, Canada. F. C. Walker, "Shear Strength of Cohesive
A. D. M. Penman, "Shear Characteristics Soils," Am. Soc. Civil Engrs., Research Con- of a Saturated Silt Measured in Triasial C o ~ n - ference on Shear Strength of Coliesive Soils, pression," Geotechnigtae, Vol. 3, No. 8, p. 312. Boulder, Colo., June, 1960, pp. 33-162.
FIG. 1-Pressure Transducer. This fiessure ti.ansdhcer was selected
PRESSURE TRANSDUCER DISCONNECT
ASSEMBLY
C A B L E
FIG. 2-Section Through Pressure Block.
A pressure transducer is an electro- mechanical device that can convert minute displacements to proportional changes in electrical potential. In this case the physical displacements are those of the center of a small diaphragm that take place when pressures are applied to one side of it. The center of the dia- phragm is linked to a group of four un- bonded strain gages of equal length; two increase and two decrease in length as
because of its small size and extra sensi- tivity. I t is model No. PA 208 TC-100f 350 from Statham Instrument, Inc. o Calif. (Fig. 1). Some important design features are:
1. Barrel diameter,
+
in.-active di- ameter, 0.300 in.2. Pressure range is 0 to 100 psi with a
permissible 100 per cent overload. 3. I t is temperature compensated over
a range of -65 to +250 F. 4. The Wheatstone bridge has a
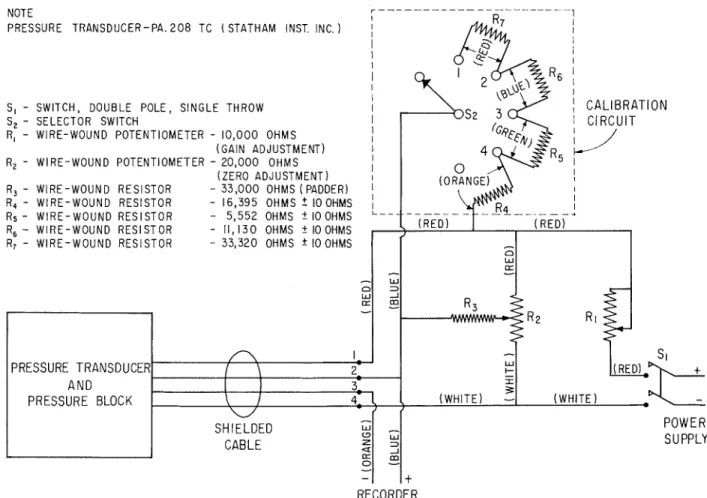
R7 - WIRE-WOUND RESISTOR - 3 3 , 3 2 0 OHMS + 10 OHMS
-
0 W rr-
NOTE IPRESSURE TRANSDUCER-PA. 2 0 8 TC ( STATHAM INST INC )
I I I I I I
S, - SWITCH, DOUBLE POLE, SINGLE THROW I
S, - SELECTOR SWITCH I
I
R, - WIRE-WOUND POTENTIOMETER - 1 0 , 0 0 0 OHMS I
(GAIN ADJUSTMENT) I
I
R, - WIRE-WOUND POTENTIOMETER - 2 0 , 0 0 0 OHMS
(ZERO ADJUSTMENT) I I 0 w
R, - WIRE-WOUND RESISTOR - 3 3 , 0 0 0 OHMS (PADDER)
%
R4 - WIRE-WOUND RESISTOR - 16 3 9 5 OHMS i IOOHMS 0
- 5;552 OHMS + OHMS L - - -
w
Rs - WIRE-WOUND RESISTOR rS
R, - WIRE-WOUND RESISTOR - 11,130 OHMS
+
I 0 OHMS / I/)-
W 3 --Im
I
\
I _-
n W (r-
1
$
2
W R2 R 1 ul II)2
5
PRESSURE TRANSDUCER AND PRESSURE BLOCK RECORDERFIG. 3-Electrical Circuit for Pressure Transducer Used in 1Zecording Pore ii'ater Pressures.
-
8
E I 3 , ( W H I T E )-
0, ( W H I T E ) 2--
3-kk-
POWER SUPPLY,+
t\
I
4--
SHIELDED CABLE w2
[r 0-
- ,2
m
nominal resistance of 350 ohm with an output of 4 mv/v input.
5. ~ecau'e strain gages are used, the resolution is infinite and limited only by the nature of the reading instrument or recorder.
6. The nonlinearity and hystereses are less than &0.75 per cent of full scale.
- -
7. One of the most important features in this particular application is the very small volume change required to activate the instrument. Full- scale pressure produces a volume change at the diaphragm of only 0.2 X 1 e 6 in.3 or 0.0033 mm3.
A pressure block, shown in Fig. 2, was designed to provide a small volume of water continuous with the pore water of the test specimen and in contact with the diaphragm of the transducer. Two holes penetrate a small chamber in the block, one of which is used as a connection to the test cell and the other as a vent for flushing air bubbles from the water sys- tem. 0 rings are used to make the connec- tions watertight.
A shut-off valve for the chamber is provided in the form of a screw, which tightens down on a miniature 0 ring to a fixed position when the head of the screw comes in contact with the outer surface of the pressure block. The transducer is held in a fixed position in the block by a clamping system over a shoulder on the transducer. Watertightness is achieved by incorporating an 0 ring in this posi- tive position clamping arrangement.
To eliminate corrections to the final readings caused by positive or negative heads of water between the pressure block and the specimen under test, the pressure block is mounted on a stand which permits vertical adjustments from
23
to 14+ in. above base level.ELECTRICAL CIRCUIT
The electro-mechanical properties of the pressure transducer required for the design of the electrical circuit are listed on the data sheet supplied by the manu- facturer. A drawing of the circuit is shown in Fig. 3. The main circuitrj- follows the arrangement outlined by the manufacturer. As the output voltage to the recorder is directly proportional to the input voltage, the gain can be con- trolled by a rheostat. Zero settings are adjusted by means of a high-shunt resist- ance across the input terminals to which a wiper and a buffer resistance are con- nected in series through one of the out- put terminals.
Although the transducer itself is tem- perature compensated, the external circuitry is slightly but noticeably af- fected by temperature changes particu- larly during the warm-up period. I t is also affected by slight variations in power supply. I t is therefore necessary periodically to check the gain against a given pressure increment. This, of course, cannot be accomplished by applying pressure to the diaphragm of the trans- ducer without also applying it to the test specimen. A check calibration is accom- plished by keying a shunt resistor across one arm of the bridge, thus causing a n imbalance in the circuit and producing an output signal which can then be ad- justed by the gain rheostat. The actual magnitude of this signal depends upon the value of resistance and can be cal- culated to simulate any given pressure interval. A calibration factor supplied b y the manufacturer is used to calculate the magnitude of the shunt resistor.
Rather than use only one resistor to check the gain over a limited range, a series of resistors were installed in the circuit to check the gain over pressure ranges of 1, 2, 3, and 4 kg/cm2 or ap- proximately 15, 30, 45, and 60 per cent of the full-scale range of the transducer.
The calibration factor which the manufacturer supplies relates output voltage change to a given pressure incre- ment a t any input voltage. As it was anticipated that pore water pressures no higher than 4 kg/cm2 might be generated in most of the testing, it was deemed adequate to check the calibration against a single mercury coIumn avaiIable in the laboratory which could register pressures slightly in excess of 3 kg/cm2. Measure ments were made a t pressure intervals up to 3 kg/cm%nd calibration factors calculated. They varied by slightly more than 1 per cent but differed from that of the manufacturer by as much as 5 per cent.
This led to a little unexpected diffi- culty in determining the shunt resist- ances for that part of the circuit desig- nated Calibrate. The values of the resistors had to be determined by trial and error rather than from the calibra- tion factor.
PROCEDURE FOR OPER.ATIOK I N
TRIAXIAL SHEAR TESTS The pressure block should be inverted (with the valve on the bottom) and con- nected by the copper tube to the bottom plate of the triaxial cell. Deaired water should be run from the cell until both copper tube lines are filled. The valve should then be closed and the pressure chamber allowed to fill with water. This can be accomplished by lowering the block below the level of the lower bearing plate of the triaxial cell. At this stage the pressure transducer should be inserted, displacing both water and air, and secured in place by the O ring, washer, and retaining nut which should be turned until a positive pressure is encountered.
Taking care not to loosen the connec- tion to the test cell, the pressure block should be returned to its upright posi- tion, that is, pressure transducer below.
If there are any air bubbles in the system they will rise to the tip of the conically shaped pressure chamber. The valve should then be released and the system flushed again from the triaxial cell end. When there are no bubbles flowing through, the valve should be tightened down until it meets a positive resistance. The hexagonal head should be in contact with the upper surface of the pressure block.
The triaxial cell is then ready to re- ceive the test s~ecimen. which should be mounted in the usual manner. When this is done the height of the pressure block should be adjusted so that the diaphragm of the pressure transducer will be a t the same level as the base of the test speci- men. A mark on the side of the pressure block shows the position of the dia- phragm.
Finally, the connection to the electrical circuit can be made by fitting the discon- nect assembly to the end of the pressure transducer. The positions are clearly marked 1 , 2 , 3 , and 4. The switch and the recorder chart should then be turned on. (The recorder should be started some time in advance to give it time to warm up. Two hr is considered a minimum, and i t is best left overnight.) The pore water pressure should be adjusted to zero using the mercury manometer and the position of the appropriate recorder points ad- justed by means of the knob on the variable resistor marked Zero.
The scale selected can be adjusted by shunting into the circuit 1, 2, 3, or 4 k g / c m q Y turning the knob marked Calibrate to the appropriate position and adjusting the knob marked Gain until the recorder prints the point in the cor- rect position on the chart.
As large a pressure difference as possi- ble should be chosen commensurate with the selected scale. I t will be necessary to check these adjustments two or three times since the Gain adjustment has a
noticeable but small effect on the Zero used when recording pore water pressures setting.
EXPERIENCE WITH OPER.ATION
The system has performed satisfac- torily in undrained triaxial shear testing. Actual response time appeared to be limited only by that of the recorder. Any time lag in the system was undetectable by visual observation and of little con- sequence in testing a t ordinary or pro- longed rates of strain.
The transducer and a pen recorder were then used in a series of consolida- tion tests in which an attempt to measure pore water pressures with time was made. I n the original design an attempt was made to reduce the volume of the pore water line and increase its rigidity as much as possible, but the effects of flexibility of the system as described by Whitman et a14 became obvious when the pen trace failed to record pressures greater than 75 to 80 per cent of the applied pressure increment and only reached the peak about 3 to 4 sec after the application of the load. Some im- provements have since been made, but further work is necessary for the success- ful application of this system to measur- ing pore water pressures in drained com- pression tests.
A six-volt wet cell battery was first
4 1 1 . V. 'Ul'hitman, A. 31. liichaldson, and
K. .4. ISealy, "Tirne Lags in Pore P1.essul.e
7vIeasurements," P ~ o c e e d i n g s , Fifth International Conference on Soil Mechanics and Foundation Engineering, Paris, Vol. 1, 1961, pp. 407-411.
in triaxial specimens, and it operated reasonably well. However, it was neces- sary to make minor gain adjustments several times during a test. This arrange- ment had one great disadvantage when the equipment was subsequently used in special consolidation tests. Without a full power supply of 7v it was not possible to use a chart scale of 1 kg/cm2 equal to 10 mv output, which seemed the most suitable scale for the study.
Banks of dry and mercury cell bat- teries were tried and used but these did not provide a sufficiently constant power supply. A 12-v wet cell with a guarded 7-v take-off was then used and found to be much better but was finally replaced by a regulated d-c power module, the output of which varied by not more than f0.05 per cent of
7
v. The installation of this unit has practically eliminated all need for periodic adjustments of zero and gain.The author wishes to acknowledge with appreciation the assistance of D. C. MacMillan in the installation of this equipment and M. Bozozuk for general observations on the performance of the equipment in consolidation testing. This paper is a contribution of the Division of Building Research, National Research Council, Canada, and is published with the approval of the Director of the Division.
DISCUSSION
L. BARDENI-T~~ use of pressure transducers is a most promising method of measuring pore pressures, whether in short term undrained triaxial tests or in more prolonged tests where automatic recording is obviously a great advantage.
I have used transducers similar to the type described in the paper, and also a much smaller and more sensitive type, for measuring pore pressures in the triaxial test.
A stabilized d-c supply is essential and will give a constant gain and an almost negligible zero drift over periods of many days. There is, therefore, no need for the ancillary circuit and the adjustments during test described by the author, which were only necessary because batteries were used as the d-c supply.
The very small sensitive transducer referred to above is based on the piezo- resistance characteristics of quartz crys- tals. The entire transducer is about the size of a pea and so has a very small volume change under pressure. I t has a full scale, 100 psi, output of 500 mv, com- pared with 40 mv for most transducers, and when used with a small driver unit which supplies constant current as well as constant voltage, it is extremely stable.
The null method of pore pressure measurement requires some flexibility in the system for it to be efficient. A com- pletely rigid system would hunt too much. However the closed transducer
1 Lecturer in engineering, hlanchester Uni- versity, Illnnchester, England.
3
circuit should be as rigid as possible, and the transducer should preferably be con- nected directly to the cell base. The volume of the connecting water should be a minimum and no air bubbles should be present.
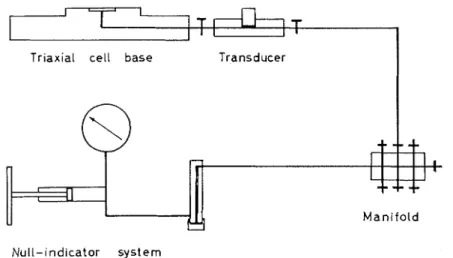
The author's method of connecting his transducer housing to the cell base by a length of flexible copper tube does not seem advisable. Also, from my own experience, the suggested method of deairing is not always reliable and there is no method of checking for air bubbles. To ensure complete deairing it is best to leave the water under a pressure of about 100 psi overnight and then to flush through to prevent the air from coming out of the solution again when the pressure drops. I t is highly desirable to incorporate some device for checking the compliance of the deaired system; I use the system illustrated in Fig 4. One null indicator can be used to check a whole bank of transducers.
The author uses a chart recorder as his output device. This is an excellent device for long term tests when auto- matic recording is really necessary. How- ever for short-term tests a digital volt- meter is very accurate and easy to use, and for automatic recording it can print out tabulated results on an electric typewriter.
I agree that, provided the system is correctly deaired, the response time is excellent, but it is unlikely to be so quick as to be limited only by that of the re- corder for all types of soil. The system always possesses some compliance (often
of the order of 1 X l W G h3/psi), and with a clay of lolv compressibility and permeability the response time must be appreciable.
The value of the compliance of the transducer described in the paper is given as 0.2 X in.3 for full scale pressure (100 psi). Should this value not be 0.2 X h 3 / p s i ?
Barden pointed out, virtually eliminates the need for an ancillary circuit to check amplification. This circuitry is, however, still extremely convenient in selecting the correct amplification for visual re- cording of pressures on a chart.
The manufacturer's calibration chart, giving the compliance of the transducer, was not interpreted correctly. The
r 1
I T A I T
1 "
Triaxial cell base Transducer
Null-indicator system
FIG. &Device for Checking Compliance of Deaired System.
I n conclusion, I would like to express my support for the author's advocacy of the u& of transducers for pore pressure measurement.
K. N. BURK (azttl~or's c1o~ztre)-Mr. Barden's comments on my equipment
-
. .
and the description of the pore pressure measuring apparatus he has developed - ..are very useful and sincerely appreciated. Shortly after writing this paper and before the conference, I procured a 7-v stabilized d-c supply which, as Mr.
figure given in the paper is not for full- scale load, but for each psi change in pressure. Although this is still a very small volume, it is considerably larger than that required to activate a solid state transducer.
I am also indebted to Mr. Barden for his observations on difficulties of de-air- ing the pressure system. I thank him for sharing these thoughts and for describing the technique he uses to reduce this problem.