XII. COMMUNICATIONS BIOPHYSICS
Prof. W. A. Rosenblith Dr. N. Y-S. Kiang J. W. Davis***
Prof. M. Eden Dr. T. T. Sandel N. Gothard
Prof. M. H. Goldstein, Jr. Dr. Eda Berger Vidale J. L. Hall II Prof. W. T. Peake Dr. T. Watanabeff S. L. Levine Prof. W. M. Siebert Aurice V. Albert R. G. Markttt
Dr. J. S. Barlowt J. Allen C. E. Molnar$$$
Dr. M. A. B. Braziert H. Blatt Clare Monck
W. A. Clark, Jr. R. M. Brown D. F. O'Brien
Dr. B. G. Farley$ J. F. Buoncristiani A. P. Paul
Margaret Z. Freeman A. H. Crist C. C. Robinson
Dr. G. L. Gerstein R. R. Capranical$ R. W. Rodieck
Dr. R. D. Hall** T. F. Weiss
A. THE GENERATION OF HANDWRITING
In an earlier report (1) and in subsequent elaborations (2, 3) a formal description of the generation of cursive English writing has been presented. These descriptions per-mit us to express a handwritten word as a finite sequence of strokes. However, this theory stopped short of describing how to generate a specific continuous function that would be recognized by a reader of English as an acceptable word.
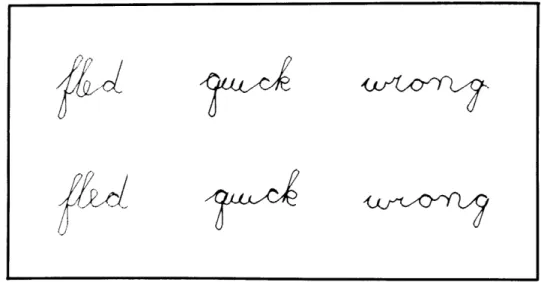
The first attempt to produce a written word with the use of the formal stroke repre-sentation associated a Markov process with each stroke. A program was written to test this procedure on the TX-0 computer. Figure XII-1 shows some representative words written by the computer.
The outlines of this Markov-process generation may be stated as follows: The letter was generated by selecting successive points in a large square array (256 X 256). The first point was chosen arbitrarily. The first stroke of the word determines the second point in the walk (for most strokes it is directly above the first point and we illustrate the method with the stroke r ). The next point is chosen from among the set of fifteen points indicated by X in Fig. XII-2. The probabilities for these choices were weighted in a way that depends on the particular stroke that is being generated. For the stroke
*
This work was supported in part by the U.S. Air Force under Contract AF19(602)-4112.
Research Associate in Communication Sciences from the Neurophysiological Laboratory of the Neurology Service of the Massachusetts General Hospital: Dr. Brazier is now at the Brain Research Institute, University of California at Los Angeles.
IStaff Member, Lincoln Laboratory, M. I. T.
Postdoctoral Fellow of the National Institute of Mental Health.
"Research Associate in Communication Sciences; also at the Massachusetts Eye and Ear Infirmary. ICommunications Development Training Program Fellow of the Bell Telephone Laboratories,
Incorporated.
National Science Foundation Cooperative Fellow. tttNational Science Foundation Graduate Fellow. "Staff Associate, Lincoln Laboratory, M. I. T.
Samples produced by Markov process. * * * * X *
XX
X
*
*xx
txx
* X*
X •Fig. XII-2. Choice points for third step in Markov process.
0
•
6(®
3
•
.*®®
.
2
* * 0 2 * * * * 0*****
** * * * * * * * * * 0Fig. XII-3. Fourth step in Markov process.
the third point is constrained to the subset of points that are encircled. The process is continued; in each case the same distribution function is applied to a different subset of accessible points. Figure XII-3 illustrates the choice of a fourth point. Finally, a
stopping rule that depends on the stroke that is being generated specifies when the con-trol of the walk is to be taken over by another stroke. Several stopping states were used: (a) the nt h point was generated in a stroke directly below the point n - 1; (b) the number of points in a stroke reached some arbitrary number k; (c) the nth point was located on some row, f rows below the initial point in the stroke. The word is then continued with the next stroke determining the constraints on the random walk.
It can be seen that the words generated in this way are legible but do not resemble the writing of an accomplished penman. In an attempt to produce a more facile hand-writing another procedure was adopted.
/7
Fig. XII-1.
* 0 0
* * ®
2
J01272
1
1
O-t
G-tLA
,
Lft
In this second procedure each stroke is represented by a parametric equation of the form dxd= A cos a t + B dt x x x dy dt A sin a t + B
dt y
y
y
The range of each stroke is nn < t
<
(n+m) Tr. As a consequence, there are no dis-continuities in the first derivative at the transition from one stroke to another.The physical interpretation of certain of the parameters is clear. Thus, Bx (the ramp) controls the spacing of strokes across the paper, and A is the height of the stroke. In English handwriting, certain of these parameters are constant in almost all cases. Thus a is almost always 1; a is either 1 or 2; B is zero except for some
y x y
capital letters.
The TX-0 computer was programmed to generate a plot of x against y from an input of typewritten words. An example of this graph is given in Fig. XII-4.
M. Eden, A. P. Paul References
1. M. Eden and M. Halle, Characterization of cursive writing, Quarterly Progress Report No. 55, Research Laboratory of Electronics, M. I. T., Oct. 15, 1959, pp. 152-156.
2. M. Eden, On the formalization of handwriting, American Mathematical Society Symposium on the Structure of Language and its Mathematical Aspects, New York, April 14-16, 1960.
3. M. Eden and M. Halle, The characterization of cursive writing, Fourth London Symposium on Information Theory, 1960, edited by C. Cherry (in press).
B. CORRELATION ANALYSIS OF EEG CHANGES FOLLOWING UNILATERAL INTRACAROTID INJECTION OF SODIUM AMYTAL
[This report is based on a paper read at the Meeting of the Eastern Association of Electroencephalographers, Ste. Marguerite, Quebec, Canada, Feb. 23-25, 1961.]
In Quarterly Progress Report No. 54, a report (1, 2) was included on a comparison, by means of autocorrelation and crosscorrelation analysis, of EEG activity recorded from homologous locations on the scalp in man. Illustrative results were included for normal subjects and for two patients with unilateral cerebral tumors. It was pointed out that, on the average, the results for normal subjects indicated a considerable degree of similarity and synchrony for EEG's recorded from homologously located electrodes on the two sides of the scalp in the parieto-occipital regions. This conclusion was drawn
(XII. COMMUNICATIONS BIOPHYSICS)
from the fact that the peaks of crosscorrelograms for normal subjects appeared at zero
delay and the crosscorrelograms were symmetrical with respect to positive and negative
delays (3).
For the two patients for whom results were included, the crosscorrelograms
also showed a peak at zero delay, but the curves were not symmetrical with respect to
the direction of time shift,
T(ref. 4).
In the present report, results of recordings made from a patient during the unilateral
intracarotid injection of sodium amytal are described.
The magnetic tape recordings of
the EEG were made at the Montreal Neurological Institute in collaboration with
Dr. R. L. Rovit and Dr. P. Gloor.
The procedure of injection of sodium amytal was
carried out as a part of a test to determine cerebral dominance (5 -8).
Two control recordings were made before injection of the drug, and one was made
LEFT
RIGHT
-It
AUTOCORRELOGRAMS
CROSSCORRE LOGRA.M
I SEC
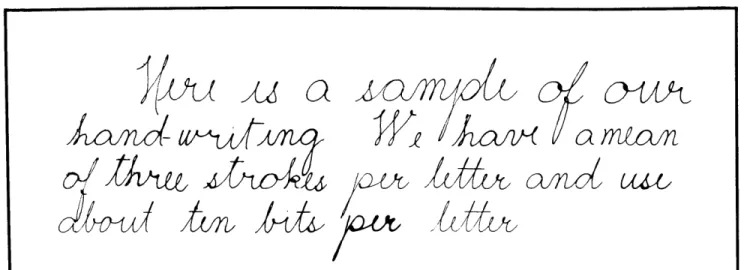
Fig. XII-5.
Autocorrelograms and crosscorrelogram for a 1-minute EEG recording
before drug injection. A 6-sec portion of the corresponding EEG ink
trace is shown below. (The gains of the correlator for the computation
of the autocorrelograms were higher by a factor of 2 for each channel
than for the crosscorrelogram.
Gain settings for the correlograms in
subsequent figures are the same as for the crosscorrelogram of this
figure.)
subsequently.
Figure XII-5 shows autocorrelograms and crosscorrelograms for the
patient in the resting state, before any injection. A 60-sec recording interval was used
for this analysis (and for subsequent analyses) of which only a 6-sec sample of the EEG
ink tracing is shown here. That there is a great deal in common between the EEG from
the two sides in the resting state is clearly evident from inspection of the ink traces.
This similarity is reflected in the similarity of the autocorrelograms. An average
domi-nant frequency of approximately 7. 2 cps obtained.
The crosscorrelogram for the two
sides is shown in the center of Fig. XII-5; the peak in the crosscorrelogram appears at
zero delay, and the envelope of the correlogram is symmetrical with respect to this point.
The results for a recording that was made after an injection of 2 cc of normal saline
as a control for subsequent drug injections were essentially the same as those in
Fig. XII-5; the average dominant frequency remained about the same (7. 0 cps).
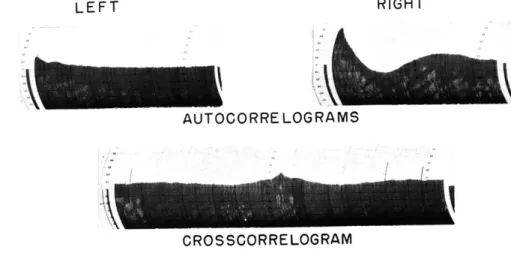
In Fig. XII-6 correlograms are shown for a 1 -minute recording made immediately
after the injection of 75 mg of sodium amytal (in 1. 5 cc of saline) into the right common
LEFT
RIGHT
AUTOCORRELOGRAMS
CROSSOORRELOGRAM
I SEC-"
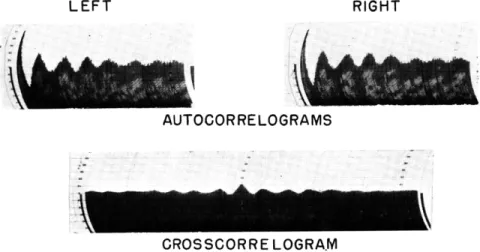
Fig. XII-6.
Autocorrelograms and crosscorrelogram for the 1-minute EEG recording
immediately following injection of 75 mg of sodium amytal into the right
carotid artery.
(XII. COMMUNICATIONS BIOPHYSICS)
carotid artery. The activity on the left side (the uninjected side) now shows an average
dominant frequency of 8. 0 cps and is seen to be appreciably less rhythmic, as indicated
by the rapid decay, with increasing delay, in the positive and negative excursions of the
autocorrelogram.
For the right side, the slowly falling base line of the autocorrelogram
indicates the appearance of slow activity (lower frequencies), which corresponds to that
seen in the ink tracings below.
The crosscorrelogram for the two sides indicates that
the sides are still closely related and that the degree of rhythmicality of the activity
common to the two sides is now less than that for the preinjection control recordings.
This fact is indicated by the presence of only one recurrent positive peak in the
cross-correlogram of either side of zero delay.
After a respite, to permit the EEG to return to its control state, 200 mg of sodium
amytal were injected.
An analysis of the 1-minute recording made immediately after
injection is shown in Fig. XII-7.
"Slow" activity of very high amplitude is seen to be
present in the ink trace for the injected (right) side, and this activity is reflected in a
markedly altered autocorrelogram for the right side (contrast with Fig. XII-6).
The
LEFT
RIGHT
AUTOCORRE LOG
RAMS
CROSSCORRELOGRAM
I~-
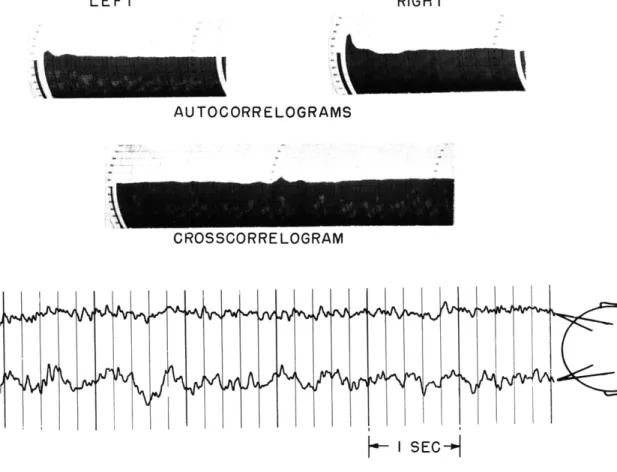
SEC-Fig. XII-7.
Autocorrelograms and crosscorrelogram for the 1-minute EEG recording
immediately following injection of 200 mg of sodium amytal into the right
carotid artery.
169
1-autocorrelogram indicates a considerable amount of irregular activity at approximately
1. 5 cps.
The autocorrelogram for the left side, however, shows almost no change from
that in Fig. XII-6, except possibly for a somewhat greater slope in the base line at the
beginning.
The crosscorrelogram for the two sides for 200 mg of the drug is seen to be
rather similar to that for 75 mg, except that the two peaks on either side of zero delay
are very poorly defined in comparison with Fig. XII-7.
The location of these two peaks
in the crosscorrelogram indicates the presence of activity common to the two sides at
a frequency of approximately 8. 2 cps, a figure that is quite close to that of 8. 0 cps for
the 75-mg dose.
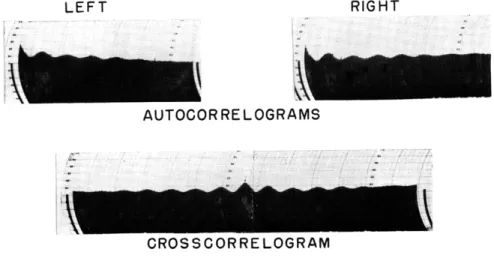
After another waiting period, a 1-minute recording was made to serve as a
post-injection control; the results of this recording are shown in Fig. XII-8.
The
correlo-gram and the ink traces in this figure are seen to be very similar to those for the two
control recordings for which results are shown in Fig. XII-5.
The EEG activity for
the two sides is once again more rhythmic (as indicated by the larg*r number of
suc-cessively recurring peaks in the correlograms as the delay increases), and the average
LEFT
RIGHT
AUTOCORRELOGRAMS
CROSSCORRELOGRAM
I-I
SEC
-- I
Fig. XII-8.
Autocorrelograms and crosscorrelogram for a 1-minute recording
made after the EEG had returned to its normal (preinjection) state.
-:
:x_
1'1~5~~~~
-::
;
-:R
I
-(XII. COMMUNICATIONS BIOPHYSICS)
dominant frequency is, again, 7. 2 cps.
Correlation analysis for these EEG recordings has shown that there are marked unilateral changes following sodium amytal injection, especially after injection of the larger dose of 200 mg of the drug; nevertheless, a common component of activity remains which occurs both synchronously and bilaterally. In particular, the crosscor-relograms are symmetrical about the point of zero delay, despite some changes in their forms from those of the control recordings. The crosscorrelograms for the recordings following injection of the drug are therefore more similar to those for normal subjects than to those for the patients with unilateral cerebral tumors. A symmetrical form of the crosscorrelogram suggests a symmetry in time of the EEG with respect to any arbi-trary point in time; this appears to be the case for normal subjects and for this patient under the influence of unilateral sodium amytal injection, but not for the patients with
cerebral tumor cited above.
The results for the present patient also suggest a slight "alerting" effect of the drug, as evidenced by a slight increase in the frequency of the EEG in the resting state and a decrease in the degree of rhythmicality, or persistence, of EEG activity on the unin-jected side. Whether this effect is due to a transcallosal or subcortical mechanism cannot be stated. However, it appears unlikely that this effect would result from small amounts of the drug that reach the contralateral side from the injected side in the short time immediately after injection.
J. S. Barlow
References
1. J. S. Barlow and Margaret Z. Freeman, Comparison of EEG activity recorded from homologous locations on the scalp by means of autocorrelation and crosscorrela-tion analysis, Quarterly Progress Report No. 54, Research Laboratory of Electronics, M. I. T., July 15, 1959, pp. 173-180.
2. J. S. Barlow and M. Z. Freeman, Comparison of EEG activity from different locations on the scalp by means of autocorrelation and crosscorrelation analysis, EEG Clin. Neurophysiol. 11, 618-619 (1959). (Abstract.)
3. J. S. Barlow, Autocorrelation and Crosscorrelation analysis in electroencepha-lography, Trans. IRE, Vol. ME-6, pp. 179-183, 1959.
4. Communications Biophysics Group of Research Laboratory of Electronics and W. M. Siebert, Processing Neuroelectric Data, Technical Report 351, Research Labo-ratory of Electronics, M. I. T., July 7, 1959, p. 48.
5. R. L. Rovit, J. Hardy, and P. Gloor, Electroencephalographic effects of intra-carotid amobarbital on epileptic activity, Arch. Neurol. 3, 642-655 (December
1960).
6. R. L. Rovit, P. Gloor, T. Rasmussen, Experiences with the use of intracarotid sodium amytal as a diagnostic tool in patients with cerebral seizures, EEG Clin. Neurophysiol. 12, 549 (1960).
(References continued on following page)
7. J. Wada and T. Rasmussen, Intracarotid injection of sodium amytal for the lateralization of cerebral speech dominance, Experimental and Clinical Observations, J. Neurosurg. 17, 266-282 (1960).
8. R. L. Rovit, P. Gloor, and T. Rasmussen, Effect of intracarotid injection of sodium amytal on epileptiform EEG discharges: A clinical study, Trans. Amer. Neurolog. Assoc., 1960, pp. 161-165.
C. A COMPARISON OF SOME STATISTICAL PARAMETERS OF THE ELECTROENCEPHALOGRAMS OF MONOZYGOTIC TWINS
Previous studies have indicated that the electroencephalograms of monozygotic twins are quite similar (1, 2). Some authors have even stated that the EEG can be used as a criterion for monozygotism (3). The present study (4) shows that although the mono-zygotic twins considered here do not have identical EEG, the differences between the EEG of any pair of these monozygotic twins are significantly less than the differences between the EEG of randomly selected individuals.
1. Experimental Procedure
The population of subjects consisted of five pairs of identical male twins between the ages of 18 and 21. Their monozygoticity was established from the obstetrical record of their birth and blood grouping studies at Peter Bent Brigham Hospital, Boston, Massachusetts. In this report the twin pairs will be referred to as (PL, ML), (CF, JF),
(LS, KS), (DC, JC), and (BYS, BRS).
The subjects were seated in a dark soundproof chamber and asked to relax and keep their eyes closed. No external visual or auditory stimuli were presented. All of the EEG were recorded on FM magnetic tape from standard bipolar electrode positions 8-10 (right parieto-occipital area). Each experiment consisted of four 4-minute recording intervals interspersed with three rest periods. Four experiments were performed on
each subject.
2. Data Reduction Techniques
Two essentially different data reduction techniques were used to analyze the EEG: autocorrelation (5) and rhythmic burst detection (6). In each case the computation was carried out at Lincoln Laboratory, M. I. T., on the TX-2 digital computer. It took approximately 10 minutes to perform both analyses for 3. 5 minutes of EEG data.
a. Autocorrelation Analysis
Previous work (7) has suggested that a narrow-band Gaussian noise model might be a useful description of the EEG for those physiological conditions in which the alpha
II
A
r
__ DkC77
.. .. . ... / . , -----hr
..~
~
z_-- JF I _.. .. .. ... . . .... i.7)- - i_ 7Z,--I r - 1 71 .,, _ , ... . ... . L S 7 / / -- 4 W ... .. . . .- , .. . . ... ... ... .... . . . . - . .. -C-. F.b§....
W
..
i.
M,14
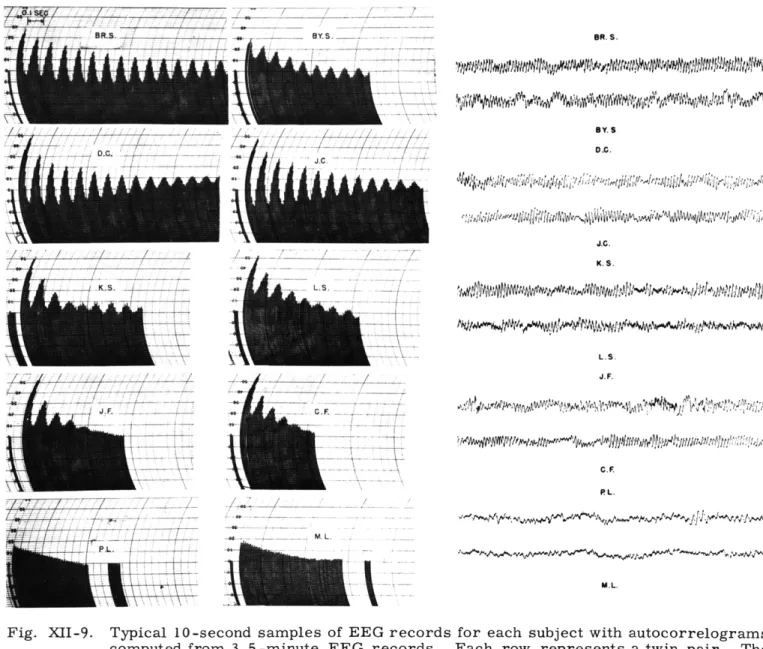
J.C. K.S. /; C.F. P L. M.L.Fig. XII-9.
Typical 10-second samples of EEG records for each subject with autocorrelograms
computed from 3. 5-minute EEG records. Each row represents a twin pair. The
pairs of autocorrelograms were ranked by inspection according to the rate of decay
of the envelope.
BR. S.
BY.S D.C.
rhythm appears. If such a model is assumed for the data, the form of the autocorrela-tion funcautocorrela-tion becomes
(T) = Ce cos W T
O
An estimate of p,
p',
was calculated from the autocorrelograms (estimates of the autocorrelation functions computed from finite time samples of data). Figure XII-9 illus-trates both a 10-second sample of the EEG of each subject and a typical autocorrelogram computed from 3. 5 minutes of EEG data. The autocorrelograms are arranged in five rows, each row representing data for one twin pair. The columns were ranked by inspection according to the rate of decay of the envelope of the autocorrelogram (P'). This display indicates three broad classifications of the EEG. The top two twin pairs (BRS, BYS) and (JC, DC) are classified as "high alpha"; the two middle twin pairs (CF, JF) and (LS, KS) as "medium alpha"; and the bottom twin pair (PL, ML) as "no alpha. "Figure XII-10 illustrates the mean
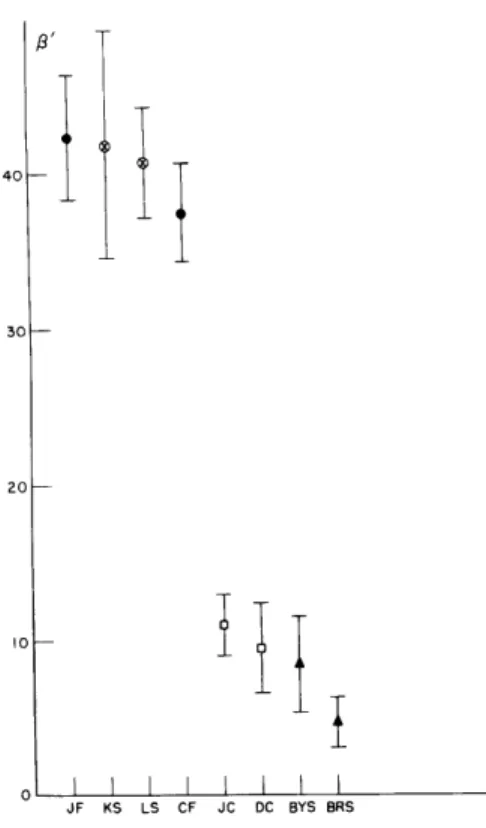
P'
and the 95 per cent confidence limits, calculated from all of the data for each subject. The subjects are ranked on the abscissa in decreasing order ofP'
with one symbol used for both members of a twin pair. Thisfigure quantitatively confirms the visual classifications made in Fig. XII-9. (The twin pair classified as "no alpha" was not included in Fig. XII-10.)
b. Rhythmic Burst Detection
The computer was programmed to detect and mark a discrete set of events through-out an EEG record (6). We defined these events, called bursts of alpha rhythm, as portions of an EEG record that meet three criteria with respect to amplitudes,
zero-crossing intervals, and the number of successive zero-zero-crossing intervals. Figure XII-11 illustrates a portion of EEG data and marks produced by the computer. The top row of points indicates peaks or maxima; the bottom row indicates valleys or minima; and the center row indicates zero crossings. In order for a portion of the EEG record to
qualify as a burst of alpha rhythm, three criteria must be met:
(a) The peak-to-peak amplitude must be larger than a given value. (b) The interval between zero crossings must be within a given range. (c) There must be at least k successive zero crossings.
If these criteria are met, a burst of alpha rhythm is marked and indicated by an upward deflection in the base line.
Various properties of this rhythmic -burst activity are averaged over a record to give a set of descriptive statistics of the EEG. The following statistics were used in this analysis:
(i) Percentage-of-burst-activity curve. This curve is determined by plotting the percentage of burst activity against each of 9 different values of the amplitude parameter (AP) with the two remaining criteria held constant. The mean and 95 per cent confidence
40
30
20
10
-JF KS LS CF JC DC BYS BRS
Fig. XII-10. The mean decay of the envelope of the auto-correlogram, P', and 95 per cent confidence limits plotted for each subject. The subjects are ranked on the abscissa; one symbol is used for both members of a twin pair.
Fig. XII-11.
An example of rhythmic bursts of alpha rhythm
with computer markings.
The top row of points
marks the occurrence of peaks; the bottom row,
of valleys; and the center row, of zero crossings.
Upward deflections in the computer markings at
the bottom of the figure indicate the portions of
the EEG data defined as rhythmic bursts of alpha
rhythm. (Adapted from B. G. Farley et al. (6).)
175
. .. .
'.%
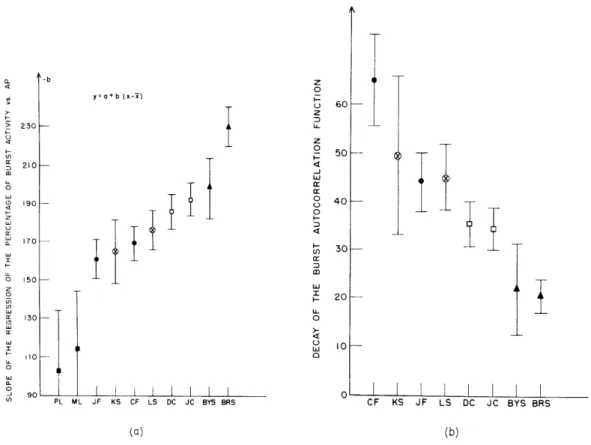
limits were calculated from the set of all curves for each subject, to obtain his com-posite percentage-of-burst-activity curve. The mean slope of this curve and 95 per cent confidence limits were determined from a linear regression analysis (8). This statistic is, in some sense, a measure of the shape of the bursts of alpha rhythm. Figure XII-12a illustrates the results of the regression analysis for each subject. The subjects are ranked along the abscissa according to decreasing slope, the same symbol being used for members of the same twin pair. The members of each twin pair are adjacent to each other, except for one permutation that occurs between the twin pairs (KS, LS) and (JF, CF). The probability of this particular order in a randomly paired population of subjects is approximately 4/1000. This ranking of subjects is similar to that obtained with i'; this indicates that these two statistics are correlated.
(ii) Autocorrelation of the burst function. This function is defined as a function that has the value one during the occurrence of a burst of alpha rhythm, and zero elsewhere. The autocorrelated burst function proved to be approximately linear when plotted on semilogarithmic coordinates; this implies that it is exponential as a function of time
y=a+b (x-) 60-50 40 30 20
iTll
-I I JF LS DC I I I CF KS JF LS DC JC BYS BRSFig. XII-12. (a) Mean slope of the curve for the percentage of burst activity versus AP. (b) Mean decay of the burst autocorrelation function. In both parts, 95 per cent confidence limits are plotted. The subjects are ranked on the abscissa; the same symbol is used for members of the same twin pair.
230 [ 210 170 150- 130-110 I L I I L I I I I I PL ML JF KS CF LS DC JC BYS BRS
(XII. COMMUNICATIONS BIOPHYSICS)
delay. For each of the subjects, the decay of this time function, together with the 95 per cent confidence limits, was determined by a linear regression analysis and plotted in Fig. XII-12b. This statistic provides information on the length of bursts and their rela-tion in time. The subjects are ranked on the abscissa in order of decreasing values of this statistic. The twin pair classified as "no alpha" was again excluded. The ranking of the subjects according to this statistic is, again, similar to that with 3'. This sug-gests that all of the statistics mentioned, thus far, are correlated, and hence are
measures of related aspects of the EEG.
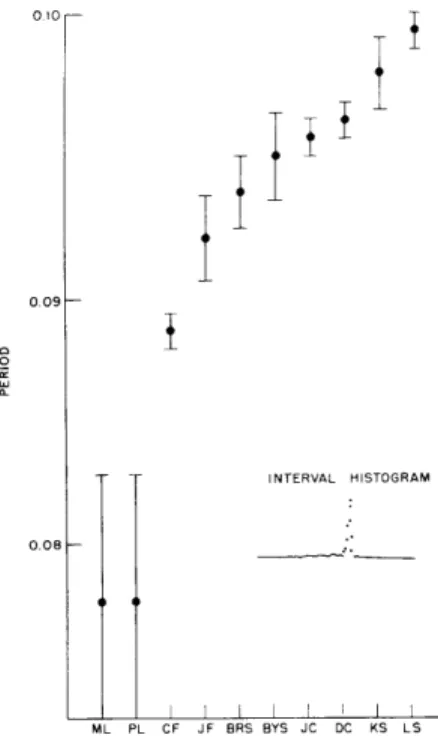
(iii) Period of the alpha frequency. A histogram of zero-crossing intervals was compiled for each EEG record. A typical histogram is illustrated in the lower right-hand corner of Fig. XII-13. The mode of this histogram is assumed to be half the period of the dominant rhythmic component (alpha frequency) in an EEG record. The mean alpha period and 95 per cent confidence limits were calculated for each subject and plotted in Fig. XII-13; the subjects are ranked on the abscissa in order of increasing alpha period.
In this ranking members of the same twin pair are always adjacent to each other. The probability of this order with 10 randomly paired subjects is approximately 1/1000.
0.09
INTERVAL HISTOGRAM
0.08
-ML PL CF JF BRS BYS JC DC KS LS
Fig. XII-13. Mean alpha period of each subject with 95 per cent confidence limits. The subjects are ranked on the abscissa; members of the same twin pair are always adjacent to each other. Inset: Typical zero-crossing interval histogram. The value of the mode of this histogram is assumed to be one-half of the alpha period.
Furthermore, the ordering of the subjects according to this statistic is different from the orderings of the subjects according to the previously mentioned statistics. This
suggests that the alpha period is a measure of another aspect of the EEG and adds an additional dimension to the classification of the EEG. It is interesting to note that twin pairs (JF, CF) and (LS, KS) whose positions were interlaced in the previous rankings now have their positions separated by four subjects.
3. Discussion of Results
The EEG of 5 pairs of identical twins were analyzed by means of the following statis-tics: the decay of the autocorrelogram of the EEG (p'), the slope of the percentage-of-burst-activity curve, the autocorrelated burst function, and the alpha period.
All of the data for a subject were used to obtain a mean for each statistic. Subjects were then ranked according to the magnitudes of the means. The members of the same twin pair were, in most of the cases, adjacent to each other in the ranking. The hypothesis tested was that the differences between the EEG of these monozygotic twins are significantly less than the differences between the EEG of randomly selected indi-viduals. This hypothesis was accepted because under the null hypothesis the probabilities of obtaining the observed rankings, were less than or equal to 0.004. The null hypothesis in the present instance assumes the existence of a randomly paired population of subjects.
The ranking of the subjects for the first three statistics is similar. Hence, these statistics are correlated and are probably measures of related properties of the EEG. The most useful of these statistics is P'. It is useful in the sense that it distinguishes the subjects at the highest level of significance.
The ranking of subjects on the basis of their alpha period is different from the ranking for the other statistics. Thus, this statistic provides an additional dimension of information for the EEG. The narrow-band Gaussian noise model also predicts that the alpha period and
P'
represent two distinct properties of the EEG.More generally, these results illustrate the use of computational techniques by means of which one can describe a physiological waveform, as complex and irregular as the electroencephalogram, by means of a reduced set of variables. Certain statistical parameters can be estimated from this set and used to assess the similarity of the EEG of twins.
S. L. Levine
References
1. W. G. Lennox, E. L. Gibbs, and F. A. Gibbs, The brain wave pattern, an hereditary trait, J. Hered. 36, 233-243 (1945).
(XII.
COMMUNICATIONS BIOPHYSICS)
2. Mary A. B. Brazier, The Electrical Activity of the Nervous System (Macmillan Company, New York, 1st edition, 1958).
3. M. Beaussart, R. Dellhay, and Lille M. Fontan, Contribution of the EEG to the study of monozygotic twins, EEG Clin. Neurophysiol. 11, 395 (1959).
4. S. L. Levine, The Electroencephalogram of Identical Twins, S. M. Thesis, Department of Electrical Engineering, M. I. T., January 1961.
5. J. S. Barlow, Autocorrelation and crosscorrelation analysis in electroencepha-lography, Trans. IRE, Vol. ME-6, pp. 179-183, 1959.
6. B. G. Farley, L. S. Frishkopf, W. A. Clark, and J. T. Gilmore, Computer Techniques for the Study of Patterns in the Electroencephalogram, Technical Report 337, Research Laboratory of Electronics, M. I. T., Nov. 6, 1957.
7. T. F. Weiss, Some Properties of the Finite Time Sample Autocorrelation of the Electroencephalogram, S. M. Thesis, Department of Electrical Engineering, M. I. T., January 1959.
8. A. Hald, Statistical Theory with Engineering Applications (John Wiley and Sons, Inc., New York, 1955).
D. A CATEGORY OF CELLS IN THE CAT'S COCHLEAR NUCLEUS DEFINED BY ELECTROPHYSIOLOGICAL EXPERIMENTS
The cochlear nucleus receives the projections of the primary auditory nerve fibers, and thus is presumably the first location in which there is extensive opportunity for the information carried by these primary units to be coded and recoded. Neuro -anatomical studies of this region reveal a wide variety of cell types and connections (1). Any attempt to assess the functional significance of these neural elements awaits an adequate catalog of the response patterns of particular units to a broad selection of acoustic signals. Our preliminary work on the electric activity of single units in the cat's cochlear nucleus as recorded with metal-filled micropipettes (2) has indeed revealed a wide assortment of
such response patterns. However, one constellation of characteristic properties appears so consistently that it must be considered typical of a particular class of neurons. These characteristics are:
1) There is no spontaneous activity.
2) The click responses have 3-5 msec latencies that place the action spike on the falling phase of a characteristic negative gross response as recorded by the same microelectrode. This gross response corresponds roughly to the N2 component that is
recorded at the periphery.
3) The frequency of firing as a function of click rate is as shown in Fig. XII-14. Several features of interest may be noted. The firing rate is maximum (approximately 60-70 spikes/sec) when the rate of stimulation is 100/sec. At higher click rates the
spike rate decreases sharply with increasing stimulus rate. At a rate of 500 clicks/sec the unit is either silent or fires at a very low rate. At still higher click rates the unit
180 (40 DB RE VDL) 100 80 60 40 20 SPONT 5 10 20 50 100 200 CLICKS/SEC 180 160 140 120 100 80 60 40 20 500 1000 2000 (25 DB RE VDL) SPONT 5 10 20 50 100 200 500 1000 2000 CLICKS/SEC
Spike rate plotted as a function of click rate for two units that belong to
the category of units discussed in this report. The spike rates are based
on spike counts for 1-minute samples for each stimulus condition. (VDL
stands for the visual detection level of an N
1response as recorded by a
gross electrode placed near the round window.)
200r I 80 160 I 40 120 I , UNIT 173-3 (20 DB RE VDL) SPONT 5 10 20 50 100 200 CLICKS/SEC 500 1000 2000
Fig. XII-15. Spike rate plotted as a function of click rate for another type of unit. Note that there is a high rate of spontaneous firing; also, the rate of spikes increases to approximately 180/sec for a click rate of approximately 200/sec, and the number of spikes per second remains fairly constant at higher rates of stimulation. Contrast this behavior with that shown in
Fig. XII-14. Fig. XII-14.
UNIT K-187-5
CLICKS/ SEC 1.2 I0 oo0 200 300 400 500 1000 SPONTANEOUS11111,11,
i
I I I I I111111111111111111111111
r II
IP - l lt ll l .. . .MIMMl I H Nil l l IMMM iMMINi iM iil t iiM i il lt i t imm INMM I t I il t ilthmI l mi i m i l itti I n ill illm tim n mll i I ittilita ni d iml i l i I iitill i mIIiiiiuliltilttlltitmI iIlml it it IIi i i tiim H illml l it i MSIIt i iIJJiIl IIM i lit ili i t
I I I II
I
II
1 L . ...
..
1
---NEGATIVE POLARITY CLICKS 0.1 MILLISEC DURATION 40 db re VDL 100 msec
S100
v
Fig. XII-16.
Responses to clicks presented at different rates for a unit whose behavior is plotted in Fig. XII-14. Note that the very small broad negative deflections (upward) are synchronized with the dots that representtimes of click presentations. These are especially evident in the 100/sec trace and represent the gross
click rate
M. Nc
NS MI-2i a a1eW 87MI -4l10/sec
512 .of
6ervals
256W6
SI 1 0 0 128 256 msec no. MlI-12 5I12100/sec
1
256
1536
0
No. WI 18172ME r 0 S 256200/sec
.1 26 e~
6 7M4-i? F- 64 I 23300/sec
1536
512
0
DOG rl-2C YYi 64-87nM 89M400/seo
128
0 32 64 mrecFig. XII-17.
Histograms of interspike intervals of the same data from which
Fig. XII-16 was obtained.
Ordinates show the numbers of intervals;
abscissas, the time durations of the intervals. (Click intensity, -50 db
re 2 volts, peak-to-peak, into the earphone.)
(XII. COMMUNICATIONS BIOPHYSICS)
remains silent. This functional relation between spike rate and click rate appears to be invariant over a wide range of stimulus intensities and anesthesia levels. Contrast this behavior with that shown in Fig. XII-15 which comes from another type of unit.
4) As Fig. XII-16 shows, at a click rate of 10/sec the firings occur essentially in a one-to-one relationship with the stimulus. At 100 clicks/sec and at still higher rates there is evidently a considerable amount of skipping in the sequence of spikes. The interspike interval histogram (3) of these data (Fig. XII-17) reveals that the spikes occur only at multiples of the stimulus intervals. The probability that the unit will fire in response to an individual click decreases as stimulus rate increases. Also, the proba-bility is small that spikes will have time intervals unrelated to the periods of the
stimulus.
5) The response to a continually present noise or to a tone of appropriate frequency consists of repeated scattered firings. The mean rate of such firing increases with the intensity of the noise (or tone) and remains at a fairly constant rate as the sound is left
on - at least at moderate intensities.
6) When bursts of tone are used as stimuli tuning curves may be obtained by determining the threshold for firing at different frequencies. This type of unit has been maximally sensitive at frequencies such as 2 kc, 5 kc, or 7 kc, but we do not have enough data to specify the entire range of maximum
sen-sitivity.
Although we must await histological evidence to localize our electrode placements more precisely, we have tried to place our electrodes in the ventral cochlear nucleus. We believe that the aforementioned characteristics are representative of a well-defined
category of units whose functional significance we do not know. Our procedure in probing for units makes use of clicks at a constant low rate as test stimuli. Our results thus obtained allow us to predict that if a unit responds to each click, exhibits no spontaneous activity, and if the spike rides on the falling phase of the N2 gross response, the unit's
firing patterns will show all of the other characteristics. Thus far, we have made careful observations on approximately 6 units, and fragmentary observations on many more without finding any indications to the contrary.
N. Y-S. Kiang
References
1. R. Lorente de No, Anatomy of the eighth nerve. III. General plan of structure of the primary cochlear nuclei, Laryngoscope 43, 327-350 (1933).
2. R. M. Dowben and S. E. Rose, A metal-filled microelectrode, Science 118, 23 (1953).
3. G. L. Gerstein and N. Y-S. Kiang, An approach to the quantitative analysis of electrophysiological data from single neurons, Biophys. J. 1, 15-28 (1960).
E.
A VERSATILE ANALOG COMPUTER FOR NEUROPHYSIOLOGICAL RESEARCH
In recent years, attempts to study neuroelectric activity in a quantitative manner
have led to the use of a variety of types of measures for quantization (1, 2). With regard
to means of computation, two general approaches have been followed. First,
special-purpose devices, usually of an analog type (3, 4), less often of a digital type (5), have
been constructed to perform one particular type of computation, but because of the
rapidly changing technology, such devices are likely to become outmoded in a relatively
short time.
Second, large general-purpose digital computers, especially programmed
for processing of neuroelectric data in particular ways (6), have been utilized. Although
these general-purpose computers have great flexibility and speed, they are very
expen-sive, and because of their very nature cannot be installed in a neurophysiological
labo-ratory. They are, therefore, more likely to be located in data-processing facilities.
Another approach to the problem is that of the design and construction of a versatile,
or multipurpose, analog device that is sufficiently small and inexpensive to be operated
in the average laboratory. It is the purpose of this brief report to describe such a
device.
The present computer is an outgrowth of an earlier special-purpose analog
device (3,7) and of the experience gained with it. Standard units (Tektronix Type 161 pulse
generators and Type 162 waveform generators) are extensively employed, together with
specially designed modular units.
For analysis of electrophysiological signals, the
computer must be operated in conjunction with a magnetic tape loop, onto which the
original data are recorded. However, the output from signal-generating equipment
(noise generators, etc.) can be processed directly without the intermediary of magnetic
tape.
Among the possible forms of computation, for which pulse techniques are extensively
used, are:
1) Autocorrelation (8, 9, 10)
2) Crosscorrelation (8, 9, 10)
3) Averaging of evoked responses (3)
4) Variability of evoked responses (more strictly, variability of signal used to obtain
the average for the preceding computation) (1, 3, 11)
5) Co-variability of two simultaneously recorded evoked responses (for example,
from two locations)
6) Amplitude distribution function of a signal
Funds for the construction of this computer were provided by a grant from the
National Institute of Neurological Diseases and Blindness (B369 Physiology) to
Dr. Mary A. B. Brazier at the Massachusetts General Hospital.
(XII. COMMUNICATIONS BIOPHYSICS)
7) Amplitude distribution function for specified points in time (for example, at a specific time interval after a stimulus, for a series of stimuli) (1, 11, 12)
8) Post-stimulus time histogram for action potentials of single units (6), or histo-gram of reaction times
9) Time-interval histogram for single-unit activity (6), or other pulse data (for example, histogram of subjective estimates of time intervals)
10) Interval histogram of base-line crossings of a signal (13).
For all of these forms of computation, the determination is made point by point (if a tape loop is used, one point for each revolution of the loop). After it is started, the computer is entirely automatic in its operation until a given curve is completed. A variety of write-out methods can be used; these include the use of a dc-coupled oscil-loscope together with a Polaroid camera, an X-Y plotter, or a strip (chart) recorder.
In addition to its use for the processing of electrophysiological data, various units of the computer can be used for other purposes; this possibility is facilitated by the modular construction used. For example, trains of randomly recurring pulses can be generated from a noise input. Moreover, various kinds of simulation (mock-up) experi-ments are possible (14); for example, the study of some characteristics of nonlinear oscillators and their entrainment by external signals (15).
A report will be prepared for publication in which full details and schematic diagrams of the computer will be included.
J. S. Barlow
References
1. Communications Biophysics Group of Research Laboratory of Electronics and W. M. Siebert, Processing Neuroelectric Data, Technical Report 351, Research
Laboratory of Electronics, M. I. T., July 7, 1959.
2. Conference on Computer Techniques in EEG Analysis. Brain Research Institute, University of California Medical Center, Los Angeles, California, October 29-30, 1960. (Summary Proceedings in EEG Clin. Neurophysiol. Supplement, in press.)
3. J. S. Barlow, A small electronic analogue averager and variance computer for evoked potentials of the brain, Medical Electronics; Proc. Second International Confer-ence on Medical Electronics, Paris, June 24-27, 1959.
4. V. A. Kozhevnikov, Photoelectric method of selecting weak electrical responses of the brain (detection, determination of average responses) (in Russian) Fiziol. Zhur. (S. S. S. R.) 44, 801-809 (1958).
5. W. A. Clark, Jr., Average response computer (ARC-1), Quarterly Progress Report, Research Laboratory of Electronics, M. I. T., April 15, 1958, pp. 114-117.
6. G. L. Gerstein and N. Y-S. Kiang, An approach to the quantitative analysis of electrophysiological data from single neurons, Biophys. J. 1, 15-28 (1960).
7. J. S. Barlow, A small electronic analog averager and variance computer for evoked potentials of the brain, Quarterly Progress Report No. 55, Research Laboratory of Electronics, M.I.T., Oct. 15, 1959, pp. 158-170.
(References continued on following page)