ORIGINAL ARTICLE
Protocol requirements and diagnostic value of PET/MR
imaging for liver metastasis detection
Caecilia S. Reiner&Paul Stolzmann&Lars Husmann&Irene A. Burger&
Martin W. Hüllner&Niklaus G. Schaefer&Paul M. Schneider&
Gustav K. von Schulthess&Patrick Veit-Haibach
Received: 21 August 2013 / Accepted: 28 November 2013 / Published online: 18 December 2013 # Springer-Verlag Berlin Heidelberg 2013
Abstract
Purpose To compare the accuracy of PET/MR imaging with that of FDG PET/CT and to determine the MR sequences necessary for the detection of liver metastasis using a trimodality PET/CT/MR set-up.
Methods Included in this single-centre IRB-approved study were 55 patients (22 women, age 61±11 years) with suspected liver metastases from gastrointestinal cancer. Imaging using a trimodality PET/CT/MR set-up (time-of-flight PET/CT and 3-T whole-body MR imager) comprised PET, low-dose CT, contrast-enhanced (CE) CT of the abdomen, and MR with T1-W/T2-W, diffusion-weighted (DWI), and dynamic CE imaging. Two readers evaluated the following image sets for liver metastasis: PET/CT (set A), PET/CECT (B), PET/MR including T1-W/T2-W (C), T1-W/T2-W with either DWI (D) or CE imaging (E), and a combination (F). The accuracy of each image set was determined by receiver-operating charac-teristic analysis using image set B as the standard of reference.
Results Of 120 liver lesions in 21/55 patients (38 %), 79 (66 %) were considered malignant, and 63/79 (80 %) showed abnormal FDG uptake. Accuracies were 0.937 (95 % CI
89.5 – 97.9 %) for image set A, 1.00 (95 % CI
99.9– 100.0 %) for set C, 0.998 (95 % CI 99.4 – 100.0 %)
for set D, 0.997 (95 % CI 99.3– 100.0 %) for set E, and 0.995
(95 % CI 99.0– 100.0 %) for set F. Differences were
signif-icant for image sets D– F (P <0.05) when including lesions
without abnormal FDG uptake. As shown by follow-up
im-aging after 50– 177 days, the use of image sets D and both
sets E and F led to the detection of metastases in one and three patients, respectively, and further metastases in the contralat-eral lobe in two patients negative on PET/CECT (P= 0.06). Conclusion PET/MR imaging with T1-W/T2-W sequences results in similar diagnostic accuracy for the detection of liver metastases to PET/CECT. To significantly improve the char-acterization of liver lesions, we recommend the use of dynam-ic CE imaging sequences. PET/MR imaging has a diagnostdynam-ic impact on clinical decision making.
Keywords Liver metastasis . Hepatology . Oncology . PET/MRI . PET/CT . Multimodality imaging
Introduction
Metastatic disease limited to or predominantly in the liver is increasingly treated with a local therapeutic approach
includ-ing resection, ablation, or embolization [1–3]. These recent
advances in treatment, especially the implementation of atyp-ical parenchyma-sparing resections together with neoadjuvant chemotherapy, have reduced mortality and thereby increased the number of patients who are candidates for hepatic surgery. The 5-year overall survival rate after resection of hepatic
colorectal liver metastases has increased to 35 % [4]. This
improved outcome is not only attributable to improved C. S. Reiner
:
P. Stolzmann:
P. Veit-HaibachDiagnostic and Interventional Radiology, University Hospital Zurich, Zurich, Switzerland
P. Stolzmann
:
L. Husmann:
I. A. Burger:
M. W. Hüllner:
N. G. Schaefer:
G. K. von Schulthess:
P. Veit-HaibachNuclear Medicine, University Hospital Zurich, Zurich, Switzerland N. G. Schaefer
Oncology, University Hospital Zurich, Zurich, Switzerland P. M. Schneider
Visceral and Transplant Surgery, University Hospital Zurich, Zurich, Switzerland
P. Stolzmann (*)
Division of Nuclear Medicine, University Hospital Zurich, Raemistrasse 100, 8091 Zurich, Switzerland
therapeutic management [5] but also to accurate diagnosis for
patients selection by means of PET and CT [6,7]. PET/CT
facilitates the selection of appropriate patients with a tumour load restricted to the liver or who have only limited
extrahe-patic disease [8]. This directly translates into better survival
after liver resection since extrahepatic tumour is detected in an
additional one of four patients [8]. Besides detection of
extra-hepatic disease, exact localization and detection of all extra-hepatic disease is crucial for local therapeutic approaches. With re-spect to the detection of liver metastases, PET/CT regularly comprises abdominal contrast-enhanced (CE) CT, which is the primary imaging modality with reported sensitivities
rang-ing up to 85 % [9]. Despite such high sensitivities, MR
imaging outperforms CECT in the hepatic assessment of metastatic disease, especially in patients with small lesions because of increased contrast resolution and multiparametric
imaging [10,11].
For these reasons, an integrated approach using PET/MR imaging might result in improvements over PET/CT in the
detection of metastases [12,13]. However, the MR imaging
techniques needed in the clinical setting to significantly im-prove the detection and characterization of liver metastases in PET/MR imaging remain uncertain.
In this study, we compared the diagnostic accuracy of PET/ MR imaging with that of PET/CT and determined MR se-quences necessary for the detection of liver metastases using a trimodality PET/CT/MR set-up.
Materials and methods
Patients
This study followed the principles of the Declaration of Hel-sinki and was approved by the institutional review board and the ethics review board. All patients gave written informed consent.
This was a prospective, single-centre, observational, cross-sectional study. Between March 2012 and March 2013, 55 consecutive patients were enrolled (33 men and 22 women;
mean age 61±11 years, range, 32– 79 years), all of whom
presented with malignancies that primarily metastasize to the liver (colorectal carcinoma in 41 patients, pancreatic carcino-ma in 5, gastrointestinal strocarcino-mal tumour in 4, cholangiocellular carcinoma in 3, and gastroesophageal carcinoma in 2). The inclusion criterion was referral for FDG PET/CT as part of a clinically indicated oncological baseline staging or restaging at our institution (55 patients). General exclusion criteria for CECT were pregnancy, renal insufficiency and hypersensitiv-ity to iodine-containing contrast material. Exclusion criteria for MR imaging were pacemakers, metallic implants, and severe claustrophobia as well as renal insufficiency. None of the patients was excluded on the basis of these criteria.
PET/CT imaging
All patients fasted for at least 4 h before injection of a standard dose of 300 MBq. The glucose level was measured before scanning. None of the patients showed elevated glucose levels (<8 mmol/L). After a standardized uptake time of 60 min, patients were placed on a dedicated CT- and MR-compatible examination table in the supine position. PET/CT and MR imaging was performed on a trimodality PET/CT/MR set-up (full ring, time-of-flight Discovery PET/CT 690, 3 T Discov-ery MR 750; both GE Healthcare, Waukesha, MI). PET and unenhanced low-dose CT data were acquired from the mid-thigh to the vertex of the skull. PET data were acquired in 3-D time-of-flight mode with a scan duration of 2 min per bed position, an overlap of bed positions of 23 % and an axial field of view of 153 mm. The emission data were corrected for attenuation using the low-dose CT data and iteratively recon-structed (matrix size 256×256, Fourier rebinning) using VUE Point FX (GE Healthcare) with three iterations (18 subsets).
CECT and non-enhanced CT data for diagnostic interpre-tation and for attenuation correction were acquired using a 64-slice CT scanner. First, a low-dose CT scan was performed using the following parameters: 40 mAs, 140 kVp, 0.5 s/tube rotation, pitch 1.7, slice thickness 3.75 mm. This CT scan was performed during breath-holding in the non-forced expiratory position. Subsequently, abdominal CECT was also performed during breath-holding in the non-forced expiratory position after intravenous injection of 100 mL iopromide contrast material (Visipaque 320, iodine 320 mg/mL; Amersham Health, Munich, Germany). Imaging parameters were as
fol-lows: 100– 200 mAs attenuation-based tube current
modula-tion (auto mAs), 120 kVp, 0.5 s/tube rotamodula-tion, pitch 1.7, slice thickness 2.00 mm. The total average imaging time for PET/CT was 14±4 min.
All CT images of the abdomen were reconstructed using adaptive iterative reconstruction with a soft-tissue convolution kernel at a standardized window setting (window width 350 HU, window level 50 HU). CT images were additionally displayed with a dedicated liver window setting (window width 150 HU, window level 100 HU) to improve soft-tissue contrast between normal liver soft-tissue and liver lesions.
PET/MR imaging
MR imaging data were acquired using a dedicated radiofre-quency coil (32 Channel torso coil; GE Healthcare). The imaging protocol included transverse T2-weighted (T2-W) fast spin-echo sequence with periodically rotated overlapping parallel lines with enhanced reconstruction (PROPELLER; GE Healthcare). For diffusion-weighted imaging (DWI), a spin-echo single-shot echo-planar imaging sequence was used with diffusion-sensitizing gradients applied along the x, y, and z axes (i.e. isotopic) before and after 180° pulses; these images
were used to synthesize isotopic transverse images (b values
0, 400, and 800 s/mm2). T1-W data were acquired with a 3-D
dual-echo fast spoiled gradient-recalled-echo pulse sequence (liver accelerated volume acquisition, LAVA-Flex; GE Healthcare) before and after administration of contrast mate-rial. Imaging was performed during the hepatic arterial, portal venous and extracellular phases after the intravenous injection of gadodiamide (Omniscan; Amersham Health, Munich, Ger-many) at a dose of 0.1 mmol/kg body weight and a flow rate of 2 mL/s, followed by a 20-mL saline bolus. An online two-point Dixon-based technique with a dedicated phase correc-tion algorithm was used to decompose and extract water-only (i.e. fat-suppressed) images from the dual-echo acquisition.
MR acquisition parameters are provided in Table1.
Image analysis
Images were analysed and postprocessed on a dedicated work-station (Advantage Windows, version 4.6; GE Healthcare).
Two experienced readers (two physicians, one holding board certifications in both nuclear medicine and radiology, and the other a board-certified radiologist, with 10 and 7 years experience in abdominal imaging, respectively) evaluated all image sets in consensus and random order. Six image sets
were analysed for each patient (Table2):
Set A: PET and unenhanced low-dose CT images Set B: PET, unenhanced low-dose CT and CECT images Set C: PET with T1-W and T2-W images
Set D: PET with T1-W, T2-W and DWI images Set E: PET with T1-W, T2-W and CE T1-W images Set F: PET with T1-W, T2-W, DWI and CE T1-W images
During the evaluation of image sets C– F, the readers had
available the PET part of the PET/CT dataset, the nonfused
MR images as well as any possible fused PET/MR images. To minimize any recall bias, the reading sessions were separated by at least 2 weeks. Neither reader was aware of the results of other imaging studies or clinical information including sur-gery findings or histopathological examinations. All images of each image set were evaluated in random order. Malignant liver lesions were diagnosed on PET when abnormal focal FDG uptake was observed on PET images not attributable to physiological accumulations. On CT, any hypodense liver lesion with ill-defined margins, appearing hypoperfused or with irregular peripheral enhancement was defined as
metastasis [14].
On MR imaging, a liver metastasis was defined as a lesion with ill-defined borders, irregular shape or signal intensity not consistent with fluid on non-enhanced T1-W and T2-W im-ages and features not consistent with haemangioma, adenoma
or focal nodular hyperplasia [15]. Regarding DWI, any
dis-tinct focus with increased signal intensity compared to the signal intensity of the surrounding normal liver parenchyma was considered a malignant lesion if the ADC values of the lesion were equal to or lower than the ADC values of the healthy surrounding tissue and signal characteristics on T1-W and T2-W images were not consistent with a benign lesion
[15,16]. On CE MR images liver lesions were defined as
metastases if enhancement criteria previously described and not typical of haemangioma, adenoma or focal nodular
hyper-plasia were present [17]. Liver lesions were graded on a
five-point confidence scale ranging from definitely benign (grade 1) through indeterminate lesions (grade 3) to definitely malignant (grade 5) according to the features mentioned above.
The nuclear medicine physician and the radiologist were told to rely upon criteria from daily practice and decide whether a lesion visible on PET, CT or MRI images, or all images, was benign or malignant. Segmental liver anatomy
was used for location [18]. The maximum diameter of the
lesion was measured with an electronic calliper tool provided by the software.
Potential diagnostic impact
Results of PET/CECT were considered the standard of refer-ence for the assessment of malignant liver lesions on a per-lesion and per-patient basis. In patients with liver per-lesions on
image set A and sets C – F that were not detected by the
standard of reference (i.e. false-positive), additional character-ization of malignant liver lesions was based on follow-up
imaging after 50– 177 days (median 139 days) by repeated
PET/CECT or MR imaging. Liver lesions that were detected by the standard of reference but missed on image set A and
sets C– F were classified as false-negative. A radiologist who
was not involved in the data reading retrospectively reclassified such liver lesions according to the aforementioned imaging features and taking change in FDG uptake, change in Table 1 Acquisition parameters for diagnostic MR sequences
Parameter T2-W FSE DW SS-EPI T1-W 3-D FSPGRa
Repetition time/echo time (ms) 16,000/90 13,000/63 4.3/2.3
Flip angle (°) 140 90 14
Inversion time (ms) NA 110 NA Section thickness/increment (mm) 6.0/7.0 6.0/7.0 5.0/2.5 Parallel imaging acceleration factor 2 2 2 Receiver bandwidth (kHz) 125 250 166 Contrast material administration No No Yes Acquisition time <6 min 2 min 15 s T2-W FSE T2-weighted fast spin-echo sequence, DW SS-EPI diffusion-weighted single-shot echo planar imaging, T1-W 3-D FSPGR T1-weight-ed three-dimensional fast spoilT1-weight-ed gradient-recallT1-weight-ed-echo pulse sequence; NA not applicable
a
lesion size, or appearance of new lesions into account if
present [19].
A potential diagnostic impact was defined as any newly discovered malignant liver lesion in a segment that was neg-ative for malignant liver lesions on images of set B.
Statistical analysis
Sample size was determined on a per-lesion basis. By includ-ing more than 78 (i.e. 79) malignant liver lesions, a McNemar test with a type I error of 0.05 had >80 % power (81 %) to detect an increase in sensitivity and specificity of 17 % and
3 %, respectively [12]. Quantitative data are expressed as
means±standard deviation if normally distributed (as tested using the Shapiro-Wilk test), or as medians with ranges if nonnormally distributed. Categorical data are given as abso-lute numbers and percentages.
The mean diameter of malignant liver lesions (i.e. only those lesions that were graded 4 or 5) with abnormal FDG uptake were compared with the mean diameter of those with-out abnormal FDG uptake using an independent samples t test. The sensitivity, specificity, positive predictive value and negative predictive value were calculated from chi-squared tests of contingency. The 95 % confidence intervals were calculated from binomial expressions. Diagnostic formance is presented and compared on a lesion and a per-patient basis (i.e. at least one malignant liver lesion in the patient) using the nonparametric McNemar test for related variables. A per-lesion analysis was carried out using seg-ments depicted without malignant liver lesions as negative. Image set B served as the standard of reference. Binary values of 0 (benign) and 1 (malignant) were assigned to lesions with a rating of 3 or less and to lesions with a rating of 4 or more, respectively.
A receiver operating characteristic curve was fitted to each reader’s confidence rating for liver lesion characterization. The accuracy was estimated by calculating the area under the receiver operating characteristic curve (AUC).
A P value <0.05 was considered to indicate statistical significance. All statistical analyses were performed using IBM SPSS statistics software (release 21.0; Chicago, IL).
Results
Patients
The primary malignancy was proven in all patients by means of histopathology. The presence of metastatic liver disease was proven by histopathology in 37 patients (67 %) and/or on follow-up imaging in 48 patients (87 %). Of the 55 pa-tients, 39 (71 %) had never had chemotherapy or radiotherapy prior to imaging. The remaining 16 patients (29 %) had chemotherapy between 34 and 709 days before imaging (me-dian 356 days). Of these 16 patients, 8 (50 %) had also previously undergone hepatic surgery for metastasis resection, right hemihepatectomy in 4 (50 %), left hemihepatectomy in 2 (25 %), and segment oriented resection in 2 (25 %, two segments each).
PET/CT
PET/CECT detected a total of 120 liver lesions in 21 of the 55 patients (38 %). All lesions were located in 35 out of 411 present segments (8.5 %), whereas no lesions were detected in 376 segments (91.5 %). Regarding the maximum diam-eter of lesions, 48 lesions were smaller than or equal to
10 mm (mean 7.4 mm, range 3– 10 mm), 72 lesions were
larger than 10 mm (mean 30.4 mm, range 11– 100 mm). Of
these 120 lesions, 79 were rated as malignant (66 %) whereas 41 lesions (34 %) were considered benign by the standard of reference.
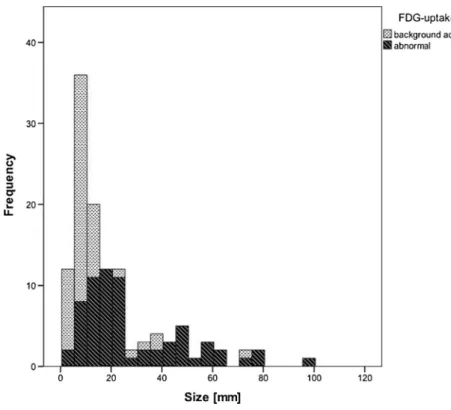
Of the 79 malignant lesions, 63 demonstrated abnormal FDG uptake (80 %). The size distribution of lesions according
to abnormal FDG uptake is shown in Fig. 1. The mean
diameter of malignant lesions with abnormal FDG uptake was significantly (P <0.05) larger than that of lesions without abnormal FDG uptake.
PET/MR imaging
The diagnostic accuracies of the evaluations with the different
image sets are shown in Table3. When plotting the confidence
level with regard to the presence or absence of malignant Table 2 Contents of the image
sets of the six reading sessions
T2-W FSE T2-weighted fast spin-echo sequence, T1-W 3-D DE GRE T1-weighted three-di-mensional dual-echo gradient-recalled-echo pulse sequence, DW SS-EPI diffusion-weighted single-shot echo planar imaging
Image set PET Non-enhanced low-dose CT Contrast-enhanced abdominal CT T2-W FSE Non-enhanced T1-W 3-D DE GRE DW SS-EPI Contrast-enhanced T1-W 3-D DE GRE A ● ● B ● ● C ● ● ● D ● ● ● ● E ● ● ● ● F ● ● ● ● ●
lesions as shown by the standard of reference, the ROC
analyses revealed an AUC of 0.937 (95 % CI 89.5– 97.9 %,
P <0.001) for image set A, 1.00 (95 % CI 99.9 – 100.0 %, P < 0.001) for set C, 0.998 (95 % CI 99.4 – 100.0 %, P <0.001) for set D, 0.997 (95 % CI 99.3 – 100.0 %, P < 0.001) for set E, and an AUC of 0.995 (95 % CI
99.0– 100.0 %, P <0.001) for set F (Fig.2a). Differences in
AUC for liver lesion characterization were more pronounced when only lesions without abnormal FDG uptake were
in-cluded (Fig.2b). In lesions without abnormal FDG uptake,
ROC analyses revealed an AUC of 0.686 (95 % CI
51.0– 86.1 %, P <0.001) for image set A, 0.994 (95 % CI
97.9 – 100.0 %, P <0.001) for set C, 0.973 (95 % CI
92.9 – 100.0 %, P <00.001) for set D, 0.955 (95 % CI
90.6– 100.0 %, P <0.001) for set E, and an AUC of 0.946
(95 % CI 88.4– 100.0 %, P <0.001) for set F. As compared to
the standard of reference, differences in accuracy were signif-icant for image set A (P <0.001), set D (P <0.05), set E (P <0.01), and set F (P <0.01) when including lesions without abnormal FDG uptake only.
Potential diagnostic impact
Image set A produced 20 false-negative and 4 false-positive ratings (P <0.01). Image sets C to F were not associated with
false-negative ratings (Fig. 3), but produced false-positive
ratings in 8 of 55 patients (15 %) compared with the standard of reference: set C produced 1 false-positive rating (P =1.00), set D produced 6 (P <0.05), set E produced 11 (P <0.01), and
set F produced 12 (P <0.001).Additional malignant liver le-sions were detected on follow-up imaging in one patient using image set D and in the same three patients using both image sets E and F, which were negative using image set B including PET/CT and CECT. Malignant liver lesions in the contralat-eral hepatic lobe were detected in two patients with colorectal
cancer using image sets D – F (Fig. 4). Thus, additional
lesions were identified in a total of five patients.
In the remaining three patients (change in confidence rating from grade 3 to 4 in all) with additional metastases on PET/ MR imaging, additional lesions were located in segments that were already rated as positive for malignancy using image set B. Thus, the rate of detection of malignant liver lesions was significantly higher with image set F than with either set C (P< 0.001) or set D (P< 0.05). The detection rate was also found to be significantly superior with image set E than with set C (P< 0.01). No significant differences were found when comparing the evaluations with image sets E and F (P >0.05), sets C and D or sets D and E (P >0.05). Thus, the addition of contrast medium improved the diagnostic detection rate sig-nificantly, while the addition of diffusion weighting did not improve the detection rate compared to CE PET/MRI imaging.
In the per-patient analysis, no significant differences were found among the evaluations with the different image sets regarding detection of malignant liver lesions (P >0.05 for all); however, a potential impact on patient management was achieved in 5 of 55 patients (10 %) using image sets E and F.
Fig. 1 Size distribution in relation to abnormal FDG uptake. Malignant lesions with abnormal FDG uptake were significantly larger than those without
Discussion
The decision to surgically resect or locally treat primary or secondary liver malignancies is based on both technical and oncological criteria, mainly related to number, size and
ana-tomical location of metastases [1]. Thus, more accurate
detec-tion and localizadetec-tion of liver metastases with one image set as compared with another may result in a change in therapeutic management. To the best of our knowledge, our results for the first time show the potential use of PET/MR imaging for the detection of liver metastases in oncological patients and dem-onstrate the necessary MR sequences in the clinical setting using a trimodality PET/CT/MR setup.
Only a few studies have compared lesion detection and characterization between PET/CT and retrospectively fused PET and MR imaging studies (hereon referred to as PET−MR
in contrast to integrated PET/MR) [12,13]. In line with these
studies, our results similarly indicate that in the characteriza-tion of liver metastases PET/MR imaging has a better rate of detection with higher confidence than PET/CECT. PET/MR with DWI or dynamic CE MR sequences demonstrated a significantly higher accuracy in the detection of liver metas-tases than both PET/CECT and PET/MR with T1-W and T2-W sequences alone. The higher accuracy of DT2-WI and CE MR imaging as compared with T1-W and T2-W imaging in the detection of liver lesions can be explained by the higher
lesion-to-liver contrast in the former sequences [20,21].
Al-though there is evidence that DWI and PET/CT show a similar accuracy in predicting pathological response, the combined use of DWI and PET may improve the specificity of the examination, as demonstrated in patients with breast cancer
[22]. However, in our study the rates of detection of liver
metastases with PET/MR with DWI compared to PET/MR with CE MR images were similar (detection rates with image sets D and E not significantly different), which is in line with the findings of previous studies comparing DWI and CE MR
imaging [15]. Notably, no additional benefit was found when
DWI was added to dynamic CE MR images. The addition of contrast medium had the highest impact on the diagnostic detection rate, while the addition of DWI appeared inferior (detection rates with image sets D and C not significantly different, but the detection rate with set E was superior to that with set C). Therefore, we recommend dynamic CE MR sequences be added to provide higher confidence in lesion characterization (i.e. changes from indeterminate to malignant
grading) rather than lesion detection [23].
The improved detection of liver metastases with PET/MR imaging was pronounced in those with small malignant liver lesions, which were regularly not associated with abnormal FDG uptake. The difficulties in detection of liver lesions smaller than 10 mm by PET/CT are attributed to the fact that small liver metastases usually do not show abnormal FDG uptake, and even on PET/CECT lesion-to-liver contrast can be
Ta b le 3 Diagnostic performance u sing the d if ferent image sets w ith image set B as the st andard of reference Im age se t Les ion-based analys is P atient-based analysis Sensi tivi ty (%) (95 % CI ) S p eci fic ity (% ) (95 % CI ) PPV (% ) (95 % CI ) NP V (%) (95 % CI ) Ac cur acy (% ) (9 5 % CI ) Sens itiv ity (%) (95 % CI ) S p ec ifi cit y (%) (95 % CI ) PP V (%) (95 % CI ) NPV (%) (95 % CI ) Acc u ra cy (%) (95 % CI ) A 7 5 (0.64 – 0.84) 99 (0.98 – 1) 94 (0.85 – 0.98) 95 (0.93 – 0.97) 95 (0.93 – 0.97) 8 6 (0.65 – 0.79) 97 (0.84 – 1) 95 (0.75 – 1) 91 (0.77 – 0.98 ) 9 3 (0.82 – 0.98) C 100 (0.95 – 1) 100 (0.99 – 1) 9 9 (0 .9 3 – 1) 100 (0.99 – 1) 100 (0.99 – 1) 1 0 0 (0.85 – 1) 97 (0.84 – 1) 96 (0.78 – 1) 100 (0.8 9 – 1) 98 (0.90 – 1) D 100 (0.95 – 1) 99 (0.97 – 1) 93 (0.85 – 0.97) 100 (0.99 – 1) 99 (0.97 – 1) 1 0 0 (0.85 – 1) 97 (0.84 – 1) 96 (0.78 – 1) 100 (0.8 9 – 1) 98 (0.90 – 1) E 100 (0.95 – 1) 97 (95 – 0.99 ) 8 8 (0.79 – 94) 100 (0.99 – 1) 98 (0.96 – 0.99) 1 0 0 (0.85 – 1) 90 (0.76 – 0.98) 88 (0.68 – 0.98) 100 (0.8 8 – 1) 95 (0.85 – 0.99) F 100 (0.95 – 1) 97 (95 – 0.99 ) 8 7 (0.78 – 93) 100 (0.99 – 1) 98 (0.96 – 0.99) 1 0 0 (0.85 – 1) 90 (0.76 – 0.98) 88 (0.68 – 0.98) 100 (0.8 8 – 1) 95 (0.85 – 0.99) PP V positive p redictive v alue, NPV negative predictive v alue
too low for adequate lesion detection. These results are in line with those reported previously demonstrating a significantly higher diagnostic confidence with retrospectively fused PET– MR images than with PET/CT in subcentimetre metastases
[12,13]. In these latter studies, PET–MR data however were
created virtually by retrospective image fusion of PET and MR scans which were acquired with different scanners and at different time points with up to 30 days between scans. In our study, we used a trimodality PET/CT/MR set-up that is of particularly high interest for comparison and diagnostic
evaluation all three modalities since data are acquired in a single measurement session without the need for patient repo-sitioning. Also, in one of the studies mentioned above intra-venous contrast material was not administered but low-dose
non-enhanced CT only was used [12]; however, CECT is
known to affect liver metastasis detection [24].
With respect to patient selection for potentially curative surgical resection, even the presence multiple metastases in
both liver lobes is no longer a contraindication [7]. Therefor,
imaging assessment affects patient outcome and is a sine qua Fig. 2 Receiver operating
characteristic curves for the different image sets adjusted for the confidence levels of the two readers for liver lesion characterization with image set B as the standard of reference including all lesions (a) and Including only lesions without abnormal FDG uptake (b). Note the pronounced differences between image sets
non for the use of such treatment regimens [1]. As proven by imaging follow-up, PET/MR including DWI allowed the de-tection of liver metastasis in one additional patient, whereas the addition of dynamic CE MR imaging led to the detection
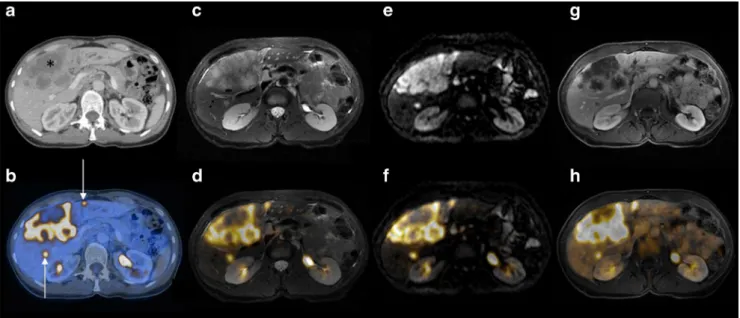
of additional liver metastases in three patients who were rated negative on PET/CECT. Moreover, MR imaging with either DWI or CE MR detected metastases in contralateral hepatic lobes in two patients with colorectal cancer with crucial Fig. 3 A 65-year-old patient with multiple liver metastases due to colon
cancer. a, b Contrast-enhanced abdominal CT imaging: the CT image (a) clearly shows one large confluent lesion (asterisk) and the fused PET/CT image (b) shows two smaller hypodense lesions (arrows) that demon-strate abnormal FDG uptake. c–h MR imaging: all lesions are clearly
visible on T2-W (c) and DW MR images (e) as well as on the corre-sponding fused PET/MR images (d and f, respectively); T1-W images show rim enhancement after administration of contrast material (g) in lesions of abnormal FDG uptake (h)
Fig. 4 A 57-year-old patient with liver metastases due to rectal cancer. a , b Hepatic metastasis with abnormal FDG uptake is clearly seen in segment II on both the PET/MR image with T2-weighting (a arrow) and the PET/CT image after contrast material administration (b arrow). c, d No lesion or abnormal FDG uptake is apparent in hepatic segment V on the CECT image (c liver window setting) or the PET/CT image (d). e, f The T2-W MR image shows one additional suspicious subcentimetre lesion (e arrowhead) with metabolic activity comparable to that of
normal liver tissue on fused the PET/MR image (f). g The lesion is similarly delineated on the DW MR image (arrowhead). Metastasis was confirmed by growth on follow-up imaging 4 month later as well as by intraoperative biopsy performed during segment-oriented resection of segment II. h Percutaneous radiofrequency ablation (arrow) was subsequently performed but metastasis was not locally controlled with recurrence anteriorly as shown on the MR image obtained 2 months after treatment
importance to potentially curative treatment. Thus, PET/MR imaging led to a potential diagnostic impact in 10 % of the patients in our cohort irrespective of extrahepatic disease.
Regarding whole-body staging for extrahepatic metastatic disease, preliminary studies have indicated that PET/MR im-aging with T1-W and T2-W sequences yields accuracies
sim-ilar to that of PET/CT [25, 26]. For a potential PET/MR
imaging strategy, we therefore suggest that T1-W and T2-W imaging suffice if extensive extrahepatic disease is detected,
whereas dynamic CE MR– or at least DWI – should be added
for accurate local hepatic assessment in patients with non-extensive disease. Diagnostic T1-W and T2-W images may be acquired during or prior to PET while further MR sequences of the abdomen could simply be added immediately after
involving less than 10 min additional scan time [27] which
would reduce scanner time and increase patient throughput. Thus we believe that dedicated PET/MR imaging is an in-triguing one-stop-shop technique for patients with cancer of the gastrointestinal tract and potentially metastatic liver disease.
Last but not least, MR sequences suitable not only for diagnostic purposes but also for attenuation correction have to be acquired when imaging with novel hybrid PET/MR
scanners [28]. Our experiments comprised Dixon-based
T1-W imaging that has been shown to enable accurate MR-based attenuation correction in most soft tissues without affecting either the quantification of FDG uptake or study interpretation
[29,30].
Limitations
Our protocol did not include either multiphase CT scanning
(i.e. arterial and portal venous) or dual time point PET [31]. In
addition, we did not administer a hepatocyte-specific contrast material (e.g. gadolinium-ethoxybenzyl-diethylenetriamine pentaacetic acid) that is known to improve the sensitivity for
detecting liver metastases [12]. The study was conducted in a
rather heterogeneous and small patient population. However, all primary tumours originated from the gastrointestinal tract and primarily metastasized to the liver. We focused on evalu-ation of the liver, because PET/MR is thought to be especially beneficial in this organ, and targeted therapies for liver metas-tases require exact staging of liver disease. Last but not least, imaging and not histopathology served as the standard of reference. An independent histopathological gold standard could not be obtained in all patients for ethical and practical reasons.
Conclusion
PET/MR imaging with T1-W and T2-W sequences results in a diagnostic accuracy for liver metastases similar to that of PET/CECT imaging. To significantly improve the
characterization of liver lesions, we recommend the use of dynamic CE imaging sequences. When application of contrast medium is not possible (e.g. in a patient with renal failure), the addition of DWI might be considered as an alternative. As-sessment by PET/MR imaging has a diagnostic impact on clinical decision making.
Conflicts of interest This research project was partly supported by an institutional research grant from GE Healthcare. Patrick Veit-Haibach received IIS Grants from Bayer Healthcare and Siemens Medical Solu-tions as well as speaker fees from GE Healthcare. Gustav von Schulthess is a consultant at Icon plc., a grant recipient from GE Healthcare and received speaker fees from GE Healthcare. The authors declare no other conflicts of interest.
References
1. Clavien PA, Petrowsky H, DeOliveira ML, Graf R. Strategies for safer liver surgery and partial liver transplantation. N Engl J Med. 2007;356:1545–59.
2. Kennedy TJ, Cassera MA, Khajanchee YS, Diwan TS, Hammill CW, Hansen PD. Laparoscopic radiofrequency ablation for the manage-ment of colorectal liver metastases: 10-year experience. J Surg Oncol. 2013;107:324–8.
3. Mayo SC, de Jong MC, Bloomston M, Pulitano C, Clary BM, Reddy SK, et al. Surgery versus intra-arterial therapy for neuroendocrine liver metastasis: a multicenter international analysis. Ann Surg Oncol. 2011;18:3657–65.
4. Malik HZ, Hamady ZZ, Adair R, Finch R, Al-Mukhtar A, Toogood GJ, et al. Prognostic influence of multiple hepatic metastases from colorectal cancer. Eur J Surg Oncol. 2007;33:468–73.
5. Poon RT, Fan ST, Lo CM, Liu CL, Lam CM, Yuen WK, et al. Improving perioperative outcome expands the role of hepatectomy in management of benign and malignant hepatobiliary diseases: analysis of 1222 consecutive patients from a prospective database. Ann Surg. 2004;240:698–708; discussion 708–10.
6. Juweid ME, Cheson BD. Positron-emission tomography and assess-ment of cancer therapy. N Engl J Med. 2006;354:496–507. 7. Selzner M, Hany TF, Wildbrett P, McCormack L, Kadry Z, Clavien
PA. Does the novel PET/CT imaging modality impact on the treat-ment of patients with metastatic colorectal cancer of the liver? Ann Surg. 2004;240:1027–34; discussion 1035–6.
8. Fernandez FG, Drebin JA, Linehan DC, Dehdashti F, Siegel BA, Strasberg SM. Five-year survival after resection of hepatic metastases from colorectal cancer in patients screened by positron emission tomography with F-18 fluorodeoxyglucose (FDG-PET). Ann Surg. 2004;240:438–47; discussion 47–50.
9. Valls C, Andia E, Sanchez A, Guma A, Figueras J, Torras J, et al. Hepatic metastases from colorectal cancer: preoperative detection and assessment of resectability with helical CT. Radiology. 2001;218:55–60.
10. Niekel MC, Bipat S, Stoker J. Diagnostic imaging of colorectal liver metastases with CT, MR imaging, FDG PET, and/or FDG PET/CT: a meta-analysis of prospective studies including patients who have not previously undergone treatment. Radiology. 2010;257:674–84. 11. Scharitzer M, Ba-Ssalamah A, Ringl H, Kolblinger C, Grunberger T,
Weber M, et al. Preoperative evaluation of colorectal liver metastases: comparison between gadoxetic acid-enhanced 3.0-T MRI and contrast-enhanced MDCT with histopathological correlation. Eur Radiol. 2013;23:2187–96.
12. Donati OF, Hany TF, Reiner CS, von Schulthess GK, Marincek B, Seifert B, et al. Value of retrospective fusion of PET and MR images in detection of hepatic metastases: comparison with 18F-FDG PET/ CT and Gd-EOB-DTPA-enhanced MRI. J Nucl Med. 2010;51:692–9. 13. Yong TW, Yuan ZZ, Jun Z, Lin Z, He WZ, Juanqi Z. Sensitivity of PET/MR images in liver metastases from colorectal carcinoma. Hell J Nucl Med. 2011;14:264–8.
14. Rappeport ED, Loft A, Berthelsen AK, von der Recke P, Larsen PN, Mogensen AM, et al. Contrast-enhanced FDG-PET/CT vs. SPIO-enhanced MRI vs. FDG-PET vs. CT in patients with liver metastases from colorectal cancer: a prospective study with intraoperative con-firmation. Acta Radiol. 2007;48:369–78.
15. Hardie AD, Naik M, Hecht EM, Chandarana H, Mannelli L, Babb JS, et al. Diagnosis of liver metastases: value of diffusion-weighted MRI compared with gadolinium-enhanced MRI. Eur Radiol. 2010;20: 1431–41.
16. Mannelli L, Bhargava P, Osman SF, Raz E, Moshiri M, Laffi G, et al. Diffusion-weighted imaging of the liver: a comprehensive review. Curr Probl Diagn Radiol. 2013;42:77–83.
17. Namasivayam S, Martin DR, Saini S. Imaging of liver metastases: MRI. Cancer Imaging. 2007;7:2–9.
18. Couinaud C. Leading principles for controlled hepatectomies (author’s transl). Chirurgie. 1980;106:136–42.
19. Wahl RL, Jacene H, Kasamon Y, Lodge MA. From RECIST to PERCIST: evolving considerations for PET response criteria in solid tumors. J Nucl Med. 2009;50 Suppl 1:122S–50S.
20. Parikh T, Drew SJ, Lee VS, Wong S, Hecht EM, Babb JS, et al. Focal liver lesion detection and characterization with diffusion-weighted MR imaging: comparison with standard breath-hold T2-weighted imaging. Radiology. 2008;246:812–22.
21. Bipat S, van Leeuwen MS, Comans EF, Pijl ME, Bossuyt PM, Zwinderman AH, et al. Colorectal liver metastases: CT, MR imaging, and PET for diagnosis– meta-analysis. Radiology. 2005;237:123–31. 22. Park SH, Moon WK, Cho N, Chang JM, Im SA, Park IA, et al. Comparison of diffusion-weighted MR imaging and FDG PET/CT to
predict pathological complete response to neoadjuvant chemotherapy in patients with breast cancer. Eur Radiol. 2012;22:18–25. 23. Hamm B, Mahfouz AE, Taupitz M, Mitchell DG, Nelson R, Halpern
E, et al. Liver metastases: improved detection with dynamic gadolinium-enhanced MR imaging? Radiology. 1997;202:677–82. 24. Kinkel K, Lu Y, Both M, Warren RS, Thoeni RF. Detection of hepatic
metastases from cancers of the gastrointestinal tract by using nonin-vasive imaging methods (US, CT, MR imaging, PET): a meta-analysis. Radiology. 2002;224:748–56.
25. Drzezga A, Souvatzoglou M, Eiber M, Beer AJ, Furst S, Martinez-Moller A, et al. First clinical experience with integrated whole-body PET/MR: comparison to PET/CT in patients with oncologic diagno-ses. J Nucl Med. 2012;53:845–55.
26. Quick HH, von Gall C, Zeilinger M, Wiesmuller M, Braun H, Ziegler S, et al. Integrated whole-body PET/MR hybrid imaging: clinical experience. Invest Radiol. 2013;48:280–9.
27. Martinez-Moller A, Eiber M, Nekolla SG, Souvatzoglou M, Drzezga A, Ziegler S, et al. Workflow and scan protocol considerations for integrated whole-body PET/MRI in oncology. J Nucl Med. 2012;53: 1415–26.
28. Catana C, van der Kouwe A, Benner T, Michel CJ, Hamm M, Fenchel M, et al. Toward implementing an MRI-based PET attenuation-correction method for neurologic studies on the MR-PET brain prototype. J Nucl Med. 2010;51:1431–8.
29. Martinez-Moller A, Souvatzoglou M, Delso G, Bundschuh RA, Chefd’hotel C, Ziegler SI, et al. Tissue classification as a potential approach for attenuation correction in whole-body PET/MRI: evalu-ation with PET/CT data. J Nucl Med. 2009;50:520–6.
30. Eiber M, Martinez-Moller A, Souvatzoglou M, Holzapfel K, Pickhard A, Loffelbein D, et al. Value of a Dixon-based MR/PET attenuation correction sequence for the localization and evaluation of PET-positive lesions. Eur J Nucl Med Mol Imaging. 2011;38:1691–701. 31. Dirisamer A, Halpern BS, Schima W, Heinisch M, Wolf F, Beheshti M, et al. Dual-time-point FDG-PET/CT for the detection of hepatic metastases. Mol Imaging Biol. 2008;10:335–40.