HAL Id: cea-02915401
https://hal-cea.archives-ouvertes.fr/cea-02915401
Submitted on 14 Aug 2020
HAL is a multi-disciplinary open access archive for the deposit and dissemination of sci-entific research documents, whether they are pub-lished or not. The documents may come from teaching and research institutions in France or abroad, or from public or private research centers.
L’archive ouverte pluridisciplinaire HAL, est destinée au dépôt et à la diffusion de documents scientifiques de niveau recherche, publiés ou non, émanant des établissements d’enseignement et de recherche français ou étrangers, des laboratoires publics ou privés.
Investigating the relationships between chemical element
concentrations and discharge to improve our
understanding of their transport patterns in rural
catchments under subtropical climate conditions
Cláudia A.P. de Barros, Tales Tiecher, Rafael Ramon, Danilo dos Santos,
Marcos Bender, O. Evrard, Sophie Ayrault, Jean P.G. Minella
To cite this version:
Cláudia A.P. de Barros, Tales Tiecher, Rafael Ramon, Danilo dos Santos, Marcos Bender, et al.. Investigating the relationships between chemical element concentrations and discharge to improve our understanding of their transport patterns in rural catchments under subtropical climate conditions. Science of the Total Environment, Elsevier, 2020, pp.141345. �10.1016/j.scitotenv.2020.141345�. �cea-02915401�
1
Investigating the relationships between chemical element concentrations
1
and discharge to improve our understanding of their transport patterns in
2
rural catchments under subtropical climate conditions
3
Cláudia A P de Barrosa, Tales Tiechera, Rafael Ramona, Danilo R dos 4
Santosb, Marcos A Benderc, Olivier Evrardd, Sophie Ayraultd & Jean P G 5
Minellab 6
a
Soil Department, Federal University of Rio Grande do Sul (UFRGS), Interdisciplinary 7
Research Group on Environmental Biogeochemistry (IRGEB), Bento Gonçalves Ave. 7712, 8
91540-000, Porto Alegre, RS, Brazil, claudia.barros@ufrgs.br, tales.tiecher@ufrgs.br, 9
rafaramon11@gmail.com 10
b
Soil Department, Federal University of Santa Maria (UFSM), Roraima Ave. 1000, 11
97105-900 Santa Maria, RS, Brazil, danilonesaf@gmail.com, jminella@gmail.com 12
c
Agronomist Engineer, EMATER-ASCAR/RS, Botafogo street 1051, 90150-052, Porto 13
Alegre, RS, Brazil, marcosantoniobender@yahoo.com.br 14
d
Laboratoire des Sciences et de l'Environnement (LSCE-IPSL), UMR 8212 15
(CEA/CNRS/UVSQ), Université Paris-Saclay, CEA Saclay, Orme des Merisiers, 91 191 Gif-sur-16
Yvette Cedex, France, olivier.evrard@lsce.ipsl.fr, sophie.ayrault@lsce.ipsl.fr 17
Corresponding Author: Cláudia A P de Barros, e-mail: claudia.barros@ufrgs.br
18 19
Abstract - Solute and particulate elemental concentrations (C) exhibit different
20
responses to changes in discharge (Q), and those relationships are not well 21
understood in subtropical agricultural environments. The objective is to describe 22
the transport processes of different chemical elements during a set of 23
contrasted rainfall events (2011-2015) that occurred in a small rural catchment 24
under subtropical climate. The study was carried out in the Lajeado Ferreira 25
Creek catchment (1.23 km²), southern Brazil. To this end, the concentrations in 26
dissolved organic carbon (DOC), Cl-, NO3-, SO4- , ten chemical elements (in
27
either dissolved or particulate forms) and suspended sediment concentrations 28
2 (SSC) were determined. Metric indices were then calculated to characterize 29
their transport patterns: (i) the best fit slope between log-C and log-Q (β), (ii) the 30
coefficient of variation of C and Q, (iii) shape of the hysteresis loop and 31
hysteresis index, and (iv) the flushing index. All particulate elements along with 32
thedissolved inorganic phosphorus (PO4-3) were shown to be controlled by the
33
sediment dynamics. Geogenic elements (Fe2+, Zn2+, Cu2+, Mn2+, Si4+) showed a 34
dilution effect with increasing Q values, likely because they were mainly 35
transported with subsurface and base flow. Dissolved elements that are mainly 36
supplied with fertilizers (Na+ and Cl-) as well as DOC showed a dilution effect, 37
although they were mainly transported by surface runoff. Finally, a chemostatic 38
behavior was found for those chemical elements (Mg2+, K+, Ca2+, NO3- and
39
SO42-) that are supplied by more than one flow pathways. The results
40
demonstrate that under subtropical climate conditions, the transport of essential 41
nutrients including PO4-3 and metals (in particulate form), are mainly transported
42
with surface runoff. Accordingly, runoff control on cultivated hillslopes should be 43
improved to reduce the potential contaminant supply to the river and to reduce 44
the potentially deleterious impacts that they may cause in downstream regions. 45
46
Keywords: rainfall events; export regimes; solutes; metric indexes; water
47 quality 48 49 50 1. INTRODUCTION 51
The intensification of agricultural activities and the limited adoption of 52
soil and water conservation practices have increased the formation of surface 53
runoff and accelerated soil erosion (Deuschle et al., 2019; Londero et al., 2018), 54
3 sediment, nutrient and metal transport in river systems draining agricultural land 55
around the world (Basu et al., 2010; Minella et al., 2018; Williams et al., 2018). 56
Chemical elements supplied in excess to the streams may originate from 57
anthropogenic activities, including agriculture through the supply of fertilizers 58
and agrochemicals (Thomas et al., 2016), or from natural sources, as the result 59
of rock weathering and leaching (Verheyen et al., 2015). The relationships 60
observed between the chemical element concentrations (C) and water 61
discharge (Q) result from the combined integration of biogeochemical 62
processes, the contribution of the sources, flow pathways, and factors such as 63
lithology, soil type and climate (Godsey et al., 2009; Knapp et al., 2020; 64
Rumsey et al., 2017; Verheyen et al., 2015; Von Freyberg et al., 2017). 65
Quantifying these relationships may contribute to improve our understanding of 66
the transport of solutes and particulate chemical substances from upper 67
catchment parts to the outlet. 68
The source of each element can be identified by reconstructing the 69
hysteresis phenomenon based on the C – Q relationship (Lloyd et al., 2016; 70
Wymore et al., 2019). Hysteresis analyses have been widely used and 71
progressively improved during the last several decades and they provide a 72
powerful technique for identifying the sources of both particle-bound (Duvert et 73
al., 2010; Lawler et al., 2006; Wymore et al., 2019) and dissolved substances 74
(Lloyd et al., 2016; Williams et al., 2018). Hysteresis occurs when 75
concentrations of an element, observed in either dissolved or particulate form, 76
during the rising stage of the hydrograph differ from those concentrations 77
recorded at the same discharge rate during the falling stage. The hysteresis can 78
be observed by the formation of a loop when plotting C vs Q. 79
4 There are three main potential interpretations of a given hysteresis loop 80
(Lloyd et al., 2016). Clockwise hysteresis suggests the rapid mobilization of the 81
chemical element of interest and the proximity of its source to the catchment 82
outlet. This situation occurs when higher concentrations are observed during 83
the event rising stage. However, when the loop is counterclockwise (i.e. when 84
the concentration of an element is lower in the rising limb while increasing in the 85
falling limb), the source of the chemical elements is expected to be located far 86
from the catchment outlet. Furthermore, the eight-type hysteresis loop can be a 87
sequence of clockwise and counterclockwise patterns. In addition, Lawler et al. 88
(2006) proposed the hysteresis index (HI) which varies according to the 89
magnitude of the rainfall event itself and, consequently, to the hydrological 90
dynamics of the catchment. 91
Recently, metric indices have been used to evaluate these C - Q 92
relationships, including (i) the best fit slope (β) for the log (C) - log (Q) linear 93
regression (Godsey et al., 2009); (ii) the ratio of the concentration and water 94
discharge coefficients of variation (CVC/CVQ) (Thompson et al., 2011); (iii) and a
95
combination of both indicators (Musolff et al., 2015). The combination of both 96
metric indices (β and CVC/CVQ) results in an unique structure for the
97
interpretation of transport patterns (Musolff et al., 2015): they can be (i) 98
chemostatic (no change in element concentration with the increase or decrease 99
in Q), (ii) they can show a chemodynamic dilution (as Q increases, the 100
concentration of the chemical element is reduced), (iii) or display a 101
chemodynamic enrichment (increase in the concentration of chemical elements 102
with increasing Q). Besides these types of behavior, the flushing index (FI), 103
which ranges between -1 and 1, quantifies the changes in concentrations 104
5 during a rainfall event (Rose et al., 2018; Vaughan et al., 2019). Negative FI 105
values indicate that concentrations decrease during the hydrograph’s rising 106
limb. In contrast, positive FI values indicate increased concentrations during the 107
hydrograph’s rising limb. The interpretation of these indices may reveal the 108
different transport patterns of the chemical elements that may be measured 109
during the monitoring of rainfall events. 110
From this new approach, Rose et al. (2018) distinguished the following 111
transport patterns: dilution for geogenic/exogenous elements (Ca2+, Mg2+, Si4+, 112
Cl-, NO3-); constant pattern for biologically associated solutes (carbon and
113
dissolved nitrogen, NH4+, K+, PO43-); and enrichment for particulate substances
114
(suspended solids and total) in a dataset covering 11 years collected in 115
Pennsylvania (USA). Through the CVC/CVQ ratio and based on a set of
seven-116
year rainfall events monitored in southern Brazil, Piazza et al. (2018) showed 117
that the export dynamics of solutes were similar in agricultural and in native 118
forest catchments. In South Florida, a combined analysis between the CVC/CVQ
119
and β showed that total nitrogen (TN) presented a chemostatic behavior while 120
total phosphorus (TP) was chemodynamic; this was due to a combination of 121
fertilizer doses, low P retention in the soil and high storms (Wan et al., 2017). 122
In subtropical and tropical climate conditions, the relationship between C 123
and Q is not well known at the event-scale. In these environments the annual 124
average rainfall volume is high as well as the kinetic energy (Ramon et al., 125
2017), which can impact the C - Q relations during rainfall events. However, 126
there is little information on the event scale for these climates. Gwenzi et al. 127
(2017) reports the scarcity of information on the scale of hydrological (Q) and 128
biogeochemistry events for tropical climate, more precisely in Africa. In Brazil, 129
6 water quality monitoring programs generally collect samples only four times per 130
year following a routine schedule, due to limited human and financial resources 131
applied in this program, where the measurements do not usually occur during 132
events. Few research efforts sought to understand the influence of climate and 133
land use conditions on the dynamics of solute transport under these 134
environmental conditions (Piazza et al., 2018). Agriculture is the main economic 135
activity in the Southern region of Brazil (CONAB, 2019), resulting in a high 136
pressure on natural resources, especially soil and water. Consequently, the 137
environmental impact of this activity must be a constant concern, where the 138
limited adoption of conservationist agriculture associated with the erosive 139
potential of the rains in the region, increase the degree of soil and water 140
degradation (Didoné et al., 2015; Merten et al., 2015). Therefore, it is important 141
to know the hydrological and biogeochemical behavior of rural catchments in a 142
subtropical climate like in southern Brazil, where there is no prior knowledge on 143
the subject. 144
In this study, we aim to investigate the transport processes of different 145
chemical elements during a set of contrasted rainfall events through the 146
analysis of their C - Q relationships. For this purpose, a program to monitor the 147
transport of chemical elements in a small rural catchment representative of 148
those environments found on the Southern Plateau of Brazil and in neighboring 149
regions, under subtropical climate conditions, was established in the period 150
between 2011 and 2015. 151
152
2. MATERIALS AND METHODS
153
2.1 Study area 154
7 The experimental catchment of the Lajeado Ferreira Creek – Arvorezinha 155
(1.23 km²), is located on the border of the Brazilian southern plateau (Figure 1). 156
This is a typical headwater catchment of the Jacuí River, one of the main 157
tributaries of the Guaíba lake, which supplies drinking water to more than 4 158
million people (Cargnin et al., 2013). Its altitude ranges from 580 to 730 m 159
(Figure 1). The upper third of the catchment has an undulating plateau relief 160
with slopes up to 7%. The middle and lower thirds of the catchment have a 161
much steeper topography with slope gradients often exceeding 15%. 162
The climate is classified as Cfb (subtropical super-humid with no dry 163
season and warm summer) according to Köppen (Alvares et al., 2013). The 164
average annual rainfall is ca. 1,938 mm (15 years, 2002 - 2016) and erosivity 165
index (EI30) is 9,344 MJ mm ha-1 yr-1 (Ramon, 2017). Rainfall is well distributed
166
over the year, although a wetter season with more rainfall events of high 167
intensity can be identified during the spring season with the frequent occurrence 168
of surface runoff. 169
The soil types in the catchment are Acrisols (57%), Cambisols (10%) and 170
Leptosols (33%). The spatial and temporal variability of land use and soil 171
management was determined using a combination of satellite images and field 172
surveys using a handheld Global Positioning System device. Land use and soil 173
management in 2011 included native forest (15% of the total catchment surface 174
area), reforested zones (23.2%), pasture (6.5%), cropland (soybean + tobacco) 175
under minimum tillage (26%), cropland under conventional tillage (13%), fallow 176
(13%) and other minor uses (3.3 %). By 2015, land use and soil management 177
had significantly changed, mainly through an increase in reforested areas 178
(35%), a decrease in cropland under minimum tillage (15%), while the cropland 179
8 surface proportion under conventional tillage increased to 24%, and that under 180
fallow decreased to 2.2%. In contrast, the respective surface areas under native 181
forest, pasture, and other land uses did not change. 182
2.2 Hydro-sedimentary monitoring 183
The Arvorezinha catchment has been monitored since 2002, with the 184
continuous measurement of flow discharge (Q) and suspended sediment 185
concentrations (SSC) at the outlet of the catchment in a Parshall type flume 186
built in concrete with a 1.83 m width in its narrowest part. Water level and 187
turbidity were recorded through a float-type water level sensor (Thalimedes, 188
OTT HydroMet, Germany) and a turbidimeter (Model SL-2000, Solar®, Brazil), 189
respectively. All automatic equipment recorded data every 10 minutes. SSC 190
data were obtained by the turbidimeter properly calibrated with samples 191
collected manually using an isokinetic sampler (US DH-48) during rainfall-runoff 192
events as proposed by Merten et al. (2014). The 10 min interval data was used 193
to calculate the variations of the sediment yield throughout the year. Rainfall 194
intensity and depth have been measured by means of tipping bucket rain 195
gauges and pluviometers, respectively, and their location is shown in Figure 1. 196
The rainfall of the last five days (R5) before the rainfall events analyzed was 197
computed to reflect the antecedent soil moisture conditions (SILVEIRA et al., 198
2000), which is classified into three classes according to rainfall volume: 1) dry 199
when R5 < 36 mm; 2) field capacity when R5 > 36 and < 53 mm; and 3) 200
saturated when R5 > 53 mm. 201
The runoff separation (the separation of surface runoff and base flow 202
contributions) was performed for the 16 rainfall events monitored, using the 203
graphical analysis method of Chow et al. (1988). The onset of the surface runoff 204
9 is determined by the rise of the hydrograph until the moment when the 205
discharge returned to values close to those observed just before the rising limb, 206
thus characterizing the end of the rainfall event. 207
208
2.3 Sampling and chemical analysis 209
During the rainfall - runoff events, 164 water samples were collected at 210
the catchment outlet using a isokinetic sampler. Duplicate samples were 211
collected, one of them to calculate the sediment concentration following the 212
evaporation method according to Shreve and Downs (2005) and the second 213
sample was used for determining the water chemical composition, which is 214 described in section 2.3.1. 215 216 2.3.1 Chemical analysis 217
In the laboratory, an aliquot of the sample was filtered at 0.22 μm to 218
characterize the dissolved fraction. The total element concentration was 219
determined in the non-filtered samples. Then, the particulate fraction was 220
obtained through calculating the difference between total and dissolved 221
concentrations. 222
In the filtered sample, the dissolved organic carbon (DOC) content was 223
determined after mixing an aliquot of the filtered sample with a 1:1 224
sulphochromic solution incubated in an oven for 4 h at 60°C, with a 225
spectrophotometer at 580 nm. Sulphate (SO42−), chlorine (Cl−) and nitrate (NO3
-226
) contents were measured with a high-performance liquid chromatography 227
(HPLC) - Sykam S 135 Ion Chromatography System (U.S. EPA, 1997). Finally, 228
the concentration of dissolved Ca2+, Cu2+, Fe2+, K+, Mg2+, Mn2+, Na+, PO43-, Si4+,
10 and Zn2+ was quantified by Inductively Coupled Plasma - Optical Emission 230
Spectrometry (ICP-OES, Perkin-Elmer) directly in the filtered water sample 231
(U.S. EPA, 1994). 232
Total content in unfiltered samples of water + sediments was assessed 233
after digestion with aqua-regia (U.S. EPA, 1996). In brief, a 20 mL aliquot of
234
unfiltered sample of water + sediment was inserted into Teflon tubes together
235
with 0.5 mL of HCl (37%) and 1 mL of HNO3 (65%), followed by microwave
236
assisted digestion for 9.5 min at a temperature of 182 °C. After that, Ca, Cu, Fe,
237
K, Mg, Mn, Na, P, Si and Zn were quantified using Inductively Coupled Plasma
238
Optical Emission Spectrometry (ICP-OES, Perkin-Elmer) (U.S. EPA, 1997). 239
Then, particulate contents of these elements were obtained by calculating the
240
difference between total and dissolved contents.
241 242
2.4 Data analysis 243
The relationship between the element concentrations and the water 244
discharge was evaluated by means of metric indices: slope (β), CVC/CVQ,
245
qualitative (loop) and hysteresis index. The analyses were performed for the 16 246
rainfall events monitored, evaluating the SSC, DOC, NO3-, SO42-, Cl- and the ten
247
chemical elements analyzed (Ca2+, Cu2+, Fe2+, K+, Mg2+, Mn2+, Na+, Zn2+, PO4-3,
248 Si4+). 249 250 2.4.1 Metric indexes 251
To obtain the β, all Q and C data were log transformed. Accordingly, a β 252
value was obtained for each element for the 16 rainfall events. A negative β 253
value reflects the decrease of element concentration with the increase of Q, 254
11 whereas positive values indicate an increase of both C and Q. When β ~ 0, it 255
indicates a chemostatic behavior of the element. The chemostatic pattern was 256
defined when the β was considered to be significantly different from zero, at α = 257
0.05 if Student's t statistic | t | > 2 (Helsel and Hirsch, 2002; Rose et al., 2018). 258
The coefficient of variation of the concentration in each chemical element 259
was calculated (CVC), as well as the coefficient of variation of water discharge
260
(CVQ). The CVC/CVQ metric index indicates whether the behavior of the element
261
is chemostatic (CVC/CVQ ≤ 0.5), or chemodynamic (CVC/CVQ > 0.5). According
262
to Musolff et al. (2015) both β and CVC/CVQ need to be evaluated in
263
combination. 264
In addition, we also examined hysteresis patterns in dissolved and 265
particulate form of the elements during individual rainfall events, as well as the 266
hysteresis index (HI), with the method of Lawler et al. (2006). The method is 267
based on measuring the width of the hysteresis loop in the central water 268
discharge (Q50), when there is a 50% increment of the Q compared to the
269
beginning of the rainfall event. The Q50 is calculated with equation 1, based on
270
the minimum (Qmin) and maximum water discharge (Qmax) values during the
271 rainfall event. 272 273 (1) 274
Thus, with the Q50 calculated, the chemical element concentration and
275
SCC for the exact corresponding moment was obtained by a coumpound rule of 276
three, using the closest sample collected before and after the Q50 time in the
277
rising and falling limbs. Therefore, HI was calculated according to equations 2 278
and 3, when the concentration in the rising limb - RL is higher than in the falling 279
12 limb - FL (clockwise hysteresis) and RL < FL (counterclockwise hysteresis), 280 respectively. 281 (2) 282 (3) 283
Where: RL is the element concentration in water discharge on the rising 284
limb of the hydrograph and FL is the concentration on the falling limb. 285
286
The Flushing Index (FI) was calculated according to the method of (Vaughan et 287
al., 2019) (Equation 4). The water discharge and the element concentration had 288
to be normalized, according to equations 5 and 6, respectively. 289
290
Where: CQpeak,normal and Cinitial,normal are the normalized elements during
291
the peak and the beginning of each rainfall event, respectively. 292 293 (5) 294 (6) 295
Where: Qi and Ci are the water discharge and element values at time
296
step i, respectively, Qmax and Qmin are the maximum and minimum water
297
13 discharge values during the rainfall event, respectively, and Cmax and Cmin are
298
the maximum and minimum concentrations of each element during the rainfall 299 event, respectively. 300 301 3. RESULTS 302
3.1 Hydro-sedimentary monitoring and element concentration 303
Table 1 shows the main characteristics of the 16 rainfall events 304
monitored between 2011 and 2015. The peak flow varied from 35 to 3,399 L s-1 305
while the maximum suspended sediment concentrations fluctuated from 0.1 to 306
5.4 g L-1. The magnitude of peak flows followed the magnitude of the volume 307
and duration of rainfall (Table 1). However, it is important to consider the effect 308
of the previous events on the hydro-sedimentary dynamics, because even with 309
low rainfall volume, surface runoff generation, sediment and chemical element 310
transport may occur. The rainfall of the last five days (R5) are presented in 311
Table 1. It can be observed that among all the events analyzed, there was no 312
rainfall at all during the previous five days for four events and for five events the 313
R5 was < 36 mm, corresponding to a dry condition. Five other events were 314
classified as having field capacity humidity, and two rain events considered as 315
saturated soil. The SSC during this period (2011-2015) was not high, except for 316
the events that occurred on 18/09/12 and 12/07/15 (Table 1). According to 317
studies conducted in this catchment between 2002 and 2016, the minimum and 318
maximum SCC recorded values are 0 and 13.7 g L-1, respectively (Minella et 319
al., 2018). However, considering the duration and the surface runoff (Qrunoff) of a
320
certain event, the sediment yield (SY) may still be high. An example is the event 321
of 20/07/2011 that presented low average SSC (SSCave - 0.2 g L-1) and a
14 maximum value of 0.6 g L-1, but due to high Qrunoff, generated high SY (24.8
323
ton). The opposite situation was observed for the event that occurred on 324
12/07/2015, where the SSCave was higher, but the SY was lower, because the
325
Qrunoff was much lower. Annual and event-based hydrographs and
326
sedimentographs during sampling can be found in the supplementary material. 327
Figure 2 shows the preferential form of transport of each chemical 328
element. A significant proportion of Ca2+, K+, Na+, and Mg2+ transport occurred 329
in dissolved form (47, 41, 39 and 28% respectively). In contrast, Mn, Fe, P, Cu, 330
Si and Zn were mostly transported in particulate form (99, 97, 91, 90, 85 and 331
79%, respectively). 332
333
Table 1: Hydro-sedimentary variables monitored during 16 rainfall events from 334
2011 to 2015 in the Arvorezinha catchment. 335
336
3.2 Chemical element exports 337
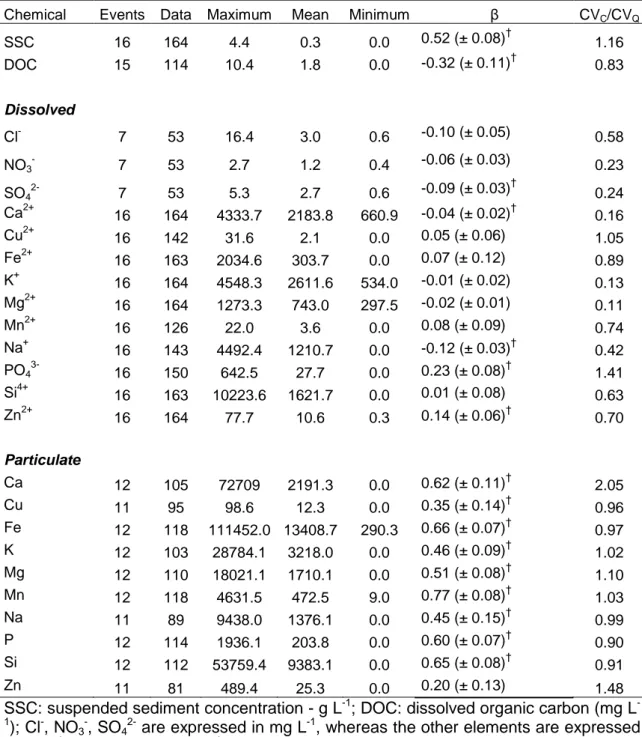
Table 2 shows the number of rainfall events, the number of samples (n), 338
minimum, average, and maximum concentrations for each element. A large 339
number of samples were collected during the rising, peak and falling limbs of 340
the hydrograph resulting in a total of 164 samples, although for some elements, 341
mainly anions, only the samples of a restricted number of events (n= 7) could 342
be analyzed (Table 2). The analyzed samples cover a wide range of 343
concentrations, due to the variability of rainfall events in terms of magnitude and 344
seasonality. 345
15 Table 2: Chemicals, total rainfall events, total of samples, maximum, mean and 347
minimum concentration, log (C) – log (Q) regression slopes (±SE) and CVc/CVQ
348
of dissolved and particulate elements during events from 2011 to 2015 in the 349 Arvorezinha catchment. 350 351 3.2.1 Dilution patterns 352
Analyzing separately the metric indices β and CVC/CVQ, the following
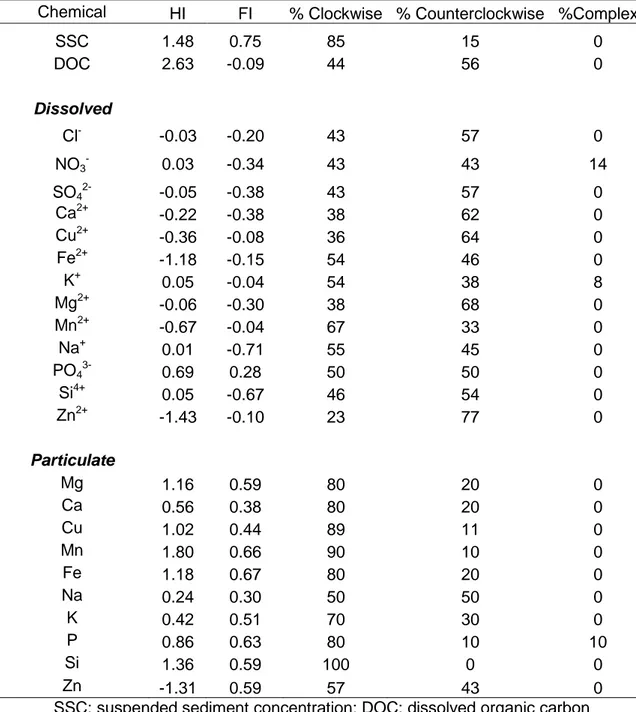
353
results were obtained with β < 0 significantly different from zero (p < 0.05): -354
0.32 ± 0.11 for DOC and -0.12 ± 0.03 for Na+; where their concentration 355
decreased when Q increased (Table 2). Although the β value for Cl- was not 356
significantly different from zero (p < 0.06), its value was also < 0. The CVC/CVQ
357
values obtained for DOC and Cl-, were 0.83 and 0.58, respectively, which are > 358
0.5, indicating a chemodynamic pattern (Table 2). In contrast, for Na+, the value 359
of CVC/CVQ was 0.42, indicating a chemostatic pattern.
360 361
3.2.2 Enrichment patterns 362
For SSC and for the concentrations in particulate form of all the chemical 363
elements analyzed, the β values were > 0 (p < 0.05), with the exception of that 364
obtained for Zn, which was not statistically different from zero (p < 0.13). This 365
behavior indicates an enrichment (Table 2), and it was also observed for PO4
3-366
and Zn2+. Similarly, the CVC/CVQ ratio was > 0.5 for all elements in particulate
367
form, SSC, PO43- and Zn2+, characterizing a chemodynamic pattern. In addition,
368
for some particulate elements (Ca, K, Mg, Mn and Zn) and for PO43-, the
369
CVC/CVQ ratio is ≥ 1, which is classified as a strong chemodynamic pattern.
370 371
16 3.2.3 Chemostatic patterns
372
The concentration of NO3-, SO42-, Ca2+, K+, Mg2+, Cu2+, Fe2+, Mn2+ and
373
Si4+ showed little variations with water discharge, because β ~ 0. All these 374
elements, except for SO42- (β = -0.09 ± 0.03, p < 0.01) and Ca2+ (β = -0.04 ±
375
0.02, p < 0.03), showed no significant difference from zero, at p < 0.05. The 376
chemostatic pattern was confirmed by CVC/CVQ ratio values ≤ 0.5 for NO3-,
377
SO42-, Ca2+, K+ and Mg2+ (Table 2). However, Cu2+, Fe2+, Mn2+ and Si4+ were
378
associated with a CVC/CVQ ratio > 0.5, which would indicate a chemodynamic
379
pattern (Table 2). 380
When the two metric indices are combined, it is possible to obtain better 381
insights into the transport patterns of the analyzed elements (Gwenzi et al., 382
2017) (Figure 3). A major part of the elements was characterized by an increase 383
in their concentration with increasing water discharge (β > 0; CVC/CVQ ≥ 0.5).
384
Furthermore, those elements such as dissolved PO43- and Zn2+ were among
385
those with the strongest chemodynamic behavior (CVC/CVQ ≥ 1). In contrast,
386
those elements with β ~ 0 and CVC/CVQ < 0.5 showed a weak relationship
387
between their concentration and the water discharge, mainly Mg2+, K+, Ca2+, 388
NO3- and SO42- (Figure 3). Na+, Cl- and DOC exhibit a dilution behavior.
389 390
3.3 Hysteresis and flushing analysis 391
The occurrence of a clockwise pattern was more frequent (> 50%) for K+, 392
Fe2+, Mn2+ and Na+, SSC and for all particulate elements (Table 3). PO43- and
393
particulate Na presented equal proportions of clockwise (50%) and 394
counterclockwise (50%) hysteresis behaviors. All particulate elements and SSC, 395
except for Zn, presented positive HI values. Fe2+, Mn2+ and particulate Zn, 396
17 showed negative HI values (-1.18, -0.67 and -1.31, respectively), but the 397
clockwise hysteresis pattern predominated. Among the dissolved chemical 398
elements, only NO3-, K+, Na+, PO43- and Si4+ showed positive HI values,
399
although NO3- did not show a well-defined hysteresis pattern (Table 3).
400
For Cl-, SO42-, Ca2+, Cu2+, Mg2+, Si4+, Zn2+ and DOC, a dominance of
401
counterclockwise patterns occurred (> 50%) which is supported by their 402
negative HI values (Table 3). The only exception was observed for DOC and 403
Si4+ that showed a positive HI value, with the occurrence of a few events with 404
high HI values, resulting in a positive average value. 405
Similarly, all particulate elements and SSC presented positive FI values, 406
indicating that their concentration increased during the hydrograph’s rising limb 407
(Table 3). All the dissolved elements, except for PO43-, together with DOC
408
showed negative values for FI (Table 3), indicating that their concentration 409
decreased during the hydrograph’s rising limb. 410
411
Table 3: Chemicals, mean Hysteresis Index (HI) and Flushing Index (FI) values 412
and percentages of distinct hysteresis patterns during these events monitored 413
from 2011 to 2015 in the Arvorezinha catchment. 414
415
When plotting FI vs HI, additional information may be derived to improve 416
our understanding of the transport and the sources of these elements during the 417
investigated rainfall events (Figure 4). 418
In Figure 4a, the elements with negative FI and positive HI are found 419
(NO3-, Si4+, K+, Na+ and DOC). These elements show a dilution effect and they
420
are supplied by nearby sources, which is particularly well defined for DOC. The 421
18 dilution effect indicates that this element reaches the river from one of the main 422
flow pathways, which is hypothesized to be surface runoff, since organic carbon 423
concentrations are higher in the topsoil layers. However, the slight 424
predominance of the counterclockwise direction for DOC may be surprising 425
(56%, Table 3), as we expected a clockwise predominance when examining the 426
hysteresis behavior alone without considering other indices (Figure 4a). All 427
other elements are characterized by HI values close to zero, suggesting the 428
absence of well-defined hysteresis patterns (clockwise, counterclockwise, or 429
complex). 430
All the elements in particulate form, except Zn, SSC and dissolved PO4
3-431
are characterized by an increase in their concentrations during the rising limb 432
(Figure 4b). Furthermore, the source of these elements is expected to be in the 433
vicinity of the catchment outlet, being delivered during the rising limb and 434
depleted during the falling limb (Figure 4b). Particulate Zn is an exception 435
because its main behavior is counterclockwise according to the HI value (its 436
source is expected to be far from the catchment outlet) (Figure 4d). This 437
analysis suggests that at the beginning of an event there is an increase of these 438
element during the rising limb and it is supplied by more distant sources. 439
However, for most events (57%, Table 3), the particulate Zn shows a clockwise 440
pattern. For most events, the HI value was positive and close to zero for Zn. For 441
only two events the HI values were more negative (-4.69 and -5.65 for the 442
events occurred in 01/10/2011 and 20/09/2013, respectively), which makes the 443
result for this element inconclusive. 444
Cl-, SO42-, Ca2+, Mg2+, Cu2+ and Mn2+ showed a dilution effect and they
445
are likely supplied by distant sources, well characterized for Ca2+, Cu2+, Mn2+, 446
19 Fe2+ and Zn2+ that present more negative values (-0.22, -0.36, -0.67 and -1.18, 447
respectively) (Figure 4c). The other three elements (Cl-, SO42-, Mg2+) were
448
characterized by HI values close to zero (-0.03, -0.05 and -0.06, respectively), 449
suggesting that they are supplied by closer sources during the event, than the 450
other four elements found in Figure 4c. 451
452
4. DISCUSSION
453
The rainfall events investigated in the current research covered a 454
pluriannual period, including different seasons and climatic phenomena. The 455
year 2015 was classified as El Niño (NOAA) for Southern Brazil with annual 456
rainfall exceeding 2,498 mm in the study site (Barros, 2016). In the agricultural 457
crop season of 2011/2012, a La Niña phenomenon was registered, which may 458
cause periods of drought in Southern Brazil (NOAA). Therefore, different 459
hydrological behavior occurs in the catchment and they were covered by the 460
period of sampling. 461
The chemical elements that can be strongly adsorbed by clays and iron 462
oxides, were mainly transported in particulate form, including P, Fe and Mn 463
with 91, 97 and 99%, respectively. In contrast, large proportions of ions such as 464
Ca, K and Na were transported in dissolved form (48, 41 and 39%, 465
respectively). However, it should be noted that these values refer to the average 466
value calculated for the entire set of 16 rainfall events (Figure 2). When 467
analyzing the dissolved and particulate proportions for each individual rainfall 468
event, these proportions can be different. Accordingly, during those rainfall 469
events with high SSC, almost 100% of the elements with a high affinity with 470
sediment particles, such as P, Mn, and Fe, were transported in particulate form. 471
20 For events with lower sediment concentrations, the proportion of these 472
elements in dissolved form increased. In contrast, elements with a low affinity 473
for sediment particles, such as Ca and K, were mainly transferred in dissolved 474
form whatever the SSC conditions observed during the event. 475
Three different transport regimes are described for the analyzed 476
elements in the next sections, namely: (i) chemodynamic - enrichment, (ii) 477
chemodynamic – dilution and (iii) chemostatic. 478
479
4.1 Drivers for enrichment patterns 480
All the elements in particulate form (Ca, Cu, Fe, K, Mg, Mn, Na, P, Si and 481
Zn), as well as SSC and dissolved PO43- showed a concentration enrichment
482
with increased discharges. Botter et al. (2019) observed a similar behavior for 483
total phosphorous (Particulate P + PO43-), which shows higher concentrations
484
with increasing discharges. 485
Sediment availability for transport is dependent on the kinetic energy of 486
rainfall during previous events and on the occurrence of new sediment pulses, 487
that may be triggered by landslides or channel bank erosion (Wymore et al., 488
2019). As the Arvorezinha catchment did not experience any landslide during 489
the study period, the main sediment supply to the stream is associated with the 490
occurrence of interill and rill erosion in cultivated areas (57% of the total 491
sediment) (Tiecher et al., 2015). However, other potential sources were outlined 492
as delivering a significant proportion of sediment and particle-bound elements. 493
Unpaved roads were shown to provide 23% of the sediment (Tiecher et al., 494
2015) with preferential connections with the river network (Barros, 2016). This 495
high connectivity between the roads and the stream systems allows the quick 496
21 delivery of readily available sediment to the stream (Figure 1). These results are 497
consistent with the findings of the current research showing that the sources of 498
particle-bound elements are close from the monitoring station (as these 499
parameters showed a clockwise pattern in > 50% of the events), which may 500
explain the rapid mobilization of the sediment and the elements bound to or 501
contained in the particles (Table 3, Figure 4). 502
PO43- was the only compound in dissolved form that presented the same
503
behavior as the particulate elements (Figure 4). Bender et al. (2018) evaluating 504
the P (dissolved and particulate form) dynamics in the same place of the 505
present study and through eight rain events already verified a strong 506
correspondence between the PO43- behavior with its particulate form. This is
507
likely related to the saturation of soils with the use of high doses of phosphate 508
fertilizers for tobacco cultivation. Pellegrini et al. (2010) showed that sediment 509
eroded from soils cultivated with tobacco were saturated with phosphates and 510
their desorption capacity was extremely high and fast. The dissolved form of 511
nutrients essential to the development of agricultural crops, such as PO43-, is
512
the form that they will be available in the aqueous medium and can trigger new 513
reactions or processes (Tang et al., 2019). In this catchment, a high availability 514
of PO43- is found in water and sediments, as already observed in a previous
515
study (Bender et al., 2018). A study conducted in France and compiling 40-year 516
records of water quality data from 293 monitoring stations showed that the 517
mitigation of phosphorus pollution reduced the concentrations in this substance 518
and altered the corresponding C – Q slopes (Moatar et al., 2017). Therefore, 519
understanding how the transfer of these elements occurs is of fundamental 520
importance, and is linked to the climatic conditions associated with the 521
22 characteristics of the catchment responsible for generating runoff and erosive 522
processes. 523
524
4.2 Drivers for dilution patterns 525
Fe2+, Zn2+, Cu2+ and Mn2+ exhibited an increase in their concentration in 526
the rising limb, but during the event, other flow pathways with low concentration 527
in these elements have reached the catchment outlet and contributed to a 528
dilution phenomenon (Figure 3). All these elements displayed counterclockwise 529
patterns, reflecting their supply by sources that are located far from the 530
catchment outlet (Figure 4c). 531
More specifically, Fe2+, Si4+ and Mn2+ are released by natural weathering 532
processes and they remain in soluble form in the soil water compartment. 533
Previous studies that examined the hydrological dynamics in the Arvorezinha 534
catchment revealed that subsurface and base flows may supply 60 to 80% of 535
the streamflow during a rainfall event in autumn and winter (Barros, 2016; 536
Robinet et al., 2018). Accordingly, the greater frequency of counterclockwise 537
hysteresis behavior patterns may be explained by an important contribution of 538
subsurface flow during rainfall events. 539
Dissolved Cu2+ and Zn2+ showed a similar behavior than Fe2+, Si4+ and 540
Mn2+ (Figures 3 and 4). The increased concentrations measured at the 541
beginning of the rainfall event were likely due to the release of these elements 542
by weathering processes, as young soils (Acrisols, Cambisols and Leptsols) of 543
basaltic origin are found in this catchment.In addition, in this area, low inputs of 544
Cu2+ and Zn2+ are expected from the use of fertilizers and agrochemicals 545
23 (exogenous solutes), which reinforces the different behavior observed 546
compared to that of DOC and dissolved Na+ and Cl-. 547
Na+, Cl- and DOC are preferentially transported with surface runoff, due 548
to their high concentrations in the topsoil layer. The high concentration of Na+ 549
and Cl- in water may be explained using inorganic fertilizers for tobacco 550
cultivation (NaNO3 and KCl), which occupied 15 to 20% of the total catchment
551
surface area between 2011 to 2015. Finally, organic carbon is concentrated in 552
the topsoil layer due to inputs from cover crops; although the levels found may 553
vary depending on land use and soil management (Boix-Fayos et al., 2017; 554 Endale et al., 2017). 555 556 4.3 Chemostatic patterns 557
In general, Mg2+, K+, Ca2+, NO3– and SO4–2 showed a very weak C - Q
558
relationship. Several sources (anthropogenic and geogenic) may supply these 559
elements, which can come from the storage of these solutes in the soil and by 560
surface runoff. Thus, elements such as K+, may not have their concentration 561
altered with the increase of Q, because all flow pathways to the river may have 562
similar concentrations, causing no dilution effect nor enrichment with the 563
changes in the water discharge. In White Clay Creek, Pennsylvania – USA, the 564
K+ was the only element among those analyzed that presented a chemostatic 565
behavior and a complex hysteresis pattern, as it can be considered a biological 566
solute, geological weathering and additional K+ inputs from exogenous sources 567
such as fertilizer (Rose et al., 2018). In Arvorezinha catchment, the production 568
of the tobacco requires high inputs of lime and industrial fertilizers 569
(anthropogenic source) containing K+, NO3– and SO4–2. Both ions have a low
24 bridging energy to clay, oxides, and organic matter, which may facilitate their 571
release into the soil and possibly be transported by subsurface flow towards the 572
catchment outlet. In addition, another fraction of these elements can be carried 573
by surface runoff, due to their higher concentration on the topsoil layer. Na+, 574
NH4+, K+, Mg2+, Ca2+ were already shown to be associated with geogenic
575
sources in a study conducted under a subtropical climate in Brazil (Piazza et al., 576
2018). In Nevada, USA, eight small river catchments were monitored (0.5 to 2.3 577
km2) and during the 8-years study period, Mg2+, K+, Ca2+, Cl-, Na+ and SO4-2
578
revealed a chemostatic behavior under temperate climate, although an opposite 579
situation was observed for NH4+ and NO3- (Hunsaker and Johnson, 2017).
580 581
5. CONCLUSIONS
582 583
The results show the strong correspondence between the magnitude of 584
the rainfall event and the preferred form of transportation of the chemical 585
elements. The water discharge is linked to the magnitude of the rainfall event 586
and the generation of surface runoff, the main responsible for the transport of 587
sediment and potential contaminants to the river. This can be attributed to the 588
strong erosive potential of rainfall in subtropical region combined to use and soil 589
management, that have an impact on the hydrological dynamics of the 590
catchment. Practices that may reduce the supply of water (by surface runoff) 591
and sediment to the river network will also minimize the transport of elements in 592
particulate form (Ca, Cu, Fe, K, Mg, Mn, Na, P, Si and Zn), which is the 593
preferred form of chemical elements transport in this catchment. In the same 594
25 way, PO43- concentration increased with the surface runoff, having the same
595
behavior of particulate elements, preferentially transferred by surface runoff. 596
Most of the dissolved chemical elements are associated to both element 597
sources (geogenic/anthropogenic) and flow pathways (base, subsurface and 598
surface flow). Thus, elements that are not preferably transported by surface 599
runoff, such as geogenic (Fe2+, Zn2+, Cu2+, Mn2+ and Si4+), reduce their 600
concentration with the increase in water discharge, and the dilution process 601
occurs. DOC, Na+ and Cl- also have a dilution regime export (concentrations 602
decrease with the increase of Q). However, their source is anthropogenic 603
through fertilization and soil organic matter and mainly transported by the 604
surface runoff. 605
The chemostatic regime export is linked to chemical elements that are 606
supplied by more than one flow pathway (Mg2+, K+, Ca2+, NO3- and SO42-), due
607
its potential contribution by both geogenic and anthropogenic source. 608
Overall, the results show that despite a small data set, it was possible to 609
understand the transport of some important chemical elements (nutrients, 610
geochemicals and metals) in a subtropical environment and it could be better 611
understood when the different metric indices were used together. These 612
insights are fundamental to design strategies to control surface runoff and 613
erosive process, because as we have observed, they seem to be the main 614
responsible for the chemical elements transport in this region. 615
616
6. ACKNOWLEDGEMENTS
617 618
26 The authors would like to thank to Conselho Nacional de Pesquisa - CNPq, 619
Coordenação de Aperfeiçoamento de Pessoal de Nível Superior - CAPES, 620
Financiadora de Estudos e Projetos - FINEP, government of Rio Grande do Sul 621
state and Sindicato Interestadual da Indústria do Tabaco - SindiTabaco for 622
providing financial support. Furthermore, the authors are grateful to the “Mais 623
Água” project and FAPERGS PRONEX n° 008/2009 projects for their support. 624
625
7. REFERENCES
626 627
Alvares, C.A., Stape, J.L., Sentelhas, P.C., De Moraes Gonçalves, J.L., 628
Sparovek, G., 2013. Köppen’s climate classification map for Brazil. 629
Meteorol. Zeitschrift 22, 711–728. https://doi.org/10.1127/0941-630
2948/2013/0507 631
Barros, C.A.P. de, 2016. Dinâmica Dos Escoamentos Na Modelagem Da 632
Produção De Sedimentos Em Uma Pequena Bacia Rural. PhD thesis. 633
Federal University of Santa Maria. 634
Basu, N.B., Destouni, G., Jawitz, J.W., Thompson, S.E., Loukinova, N. V., 635
Darracq, A., Zanardo, S., Yaeger, M., Sivapalan, M., Rinaldo, A., Rao, 636
P.S.C., 2010. Nutrient loads exported from managed catchments reveal 637
emergent biogeochemical stationarity. Geophys. Res. Lett. 37, 1–5. 638
https://doi.org/10.1029/2010GL045168 639
Bender, M.A., dos Santos, D.R., Tiecher, T., Minella, J.P.G., de Barros, C.A.P., 640
Ramon, R., 2018. Phosphorus dynamics during storm events in a 641
subtropical rural catchment in southern Brazil. Agric. Ecosyst. Environ. 261, 642
93–102. https://doi.org/10.1016/j.agee.2018.04.004 643
27 Boix-Fayos, C., Martínez-Mena, M., Cutillas, P.P., de Vente, J., Barberá, G.G., 644
Mosch, W., Navarro Cano, J.A., Gaspar, L., Navas, A., 2017. Carbon 645
redistribution by erosion processes in an intensively disturbed catchment. 646
Catena 149, 799–809. https://doi.org/10.1016/j.catena.2016.08.003 647
Botter, M., Burlando, P., Fatichi, S., 2019. Anthropogenic and catchment 648
characteristic signatures in the water quality of Swiss rivers: A quantitative 649
assessment. Hydrol. Earth Syst. Sci. 23, 1885–1904. 650
https://doi.org/10.5194/hess-23-1885-2019 651
Cargnin, A.P., De Aveline Bertê, A.M., De Oliveira Lemos, B., De Oliveira, S.B., 652
2013. Atlas socioeconômico do Rio Grande do Sul: quinze anos 653
acompanhando as transformações do estado. Geo UERJ 2. 654
https://doi.org/10.12957/geouerj.2013.8200 655
Chow, V. Te, Maidment, D.R., Mays, L.W., 1988. Aplied Hydrology, McGraw-656
Hil. ed. 657
CONAB, 2019. Acompanhamento da Safra Brasileira. Cia. Nac. Abast. 5, 1– 658
113. 659
Deuschle, D., Minella, J.P.G., Hörbe, T. de A.N., Londero, A.L., Schneider, 660
F.J.A., 2019. Erosion and hydrological response in no-tillage subjected to 661
crop rotation intensification in southern Brazil. Geoderma 340, 157–163. 662
https://doi.org/10.1016/j.geoderma.2019.01.010 663
Didoné, E.J., Minella, J.P.G., Merten, G.H., 2015. Quantifying soil erosion and 664
sediment yield in a catchment in southern Brazil and implications for land 665
conservation. J. Soils Sediments 15, 2334–2346. 666
https://doi.org/10.1007/s11368-015-1160-0 667
28 Duvert, C., Gratiot, N., Evrard, O., Navratil, O., Némery, J., Prat, C., Esteves, 668
M., 2010. Drivers of erosion and suspended sediment transport in three 669
headwater catchments of the Mexican Central Highlands. Geomorphology 670
123, 243–256. https://doi.org/10.1016/j.geomorph.2010.07.016 671
Endale, D.M., Potter, T.L., Strickland, T.C., Bosch, D.D., 2017. Sediment-bound 672
total organic carbon and total organic nitrogen losses from conventional 673
and strip tillage cropping systems. Soil Tillage Res. 171, 25–34. 674
https://doi.org/10.1016/j.still.2017.04.004 675
Godsey, S.E., Kirchner, J.W., Clow, D.W., 2009. Concentration-discharge 676
relationships reflect chemostatic characteristics of US catchments. Hydrol. 677
Process. 23, 1844–1864. https://doi.org/10.1002/hyp.7315 678
Gwenzi, W., Chinyama, S.R., Togarepi, S., 2017. Concentration-discharge 679
patterns in a small urban headwater stream in a seasonally dry water-680
limited tropical environment. J. Hydrol. 550, 12–25. 681
https://doi.org/10.1016/j.jhydrol.2017.04.029 682
Helsel, D.R., Hirsch, R.M., 2002. Statistical Methods in Water Resources, 683
Studies in Environmental Sciences. United States Geological Survey. 684
https://doi.org/10.13140/RG.2.2.36048.10248 685
Hunsaker, C.T., Johnson, D.W., 2017. Concentration-discharge relationships in 686
headwater streams of the Sierra Nevada, California. Water Resour. Res. 687
53, 7869–7884. https://doi.org/10.1002/2016WR019693 688
Knapp, J.L., Freyberg, J. von, Studer, B., Kiewiet, L., Kirchner, J., 2020. 689
Concentration-discharge relationships vary among hydrological events, 690
reflecting differences in event characteristics. Hydrol. Earth Syst. Sci. 691
29 Discuss. 1–27. https://doi.org/10.5194/hess-2019-684
692
Lawler, D.M., Petts, G.E., Foster, I.D.L., Harper, S., 2006. Turbidity dynamics 693
during spring storm events in an urban headwater river system: The Upper 694
Tame, West Midlands, UK. Sci. Total Environ. 360, 109–126. 695
https://doi.org/10.1016/j.scitotenv.2005.08.032 696
Lloyd, C.E.M., Freer, J.E., Johnes, P.J., Collins, A.L., 2016. Technical Note: 697
Testing an improved index for analysing storm discharge-concentration 698
hysteresis. Hydrol. Earth Syst. Sci. 20, 625–632. 699
https://doi.org/10.5194/hess-20-625-2016 700
Londero, A.L., Minella, J.P.G.G., Deuschle, D., Schneider, F.J.A.A., Boeni, M., 701
Merten, G.H., 2018. Impact of broad-based terraces on water and sediment 702
losses in no-till (paired zero-order) catchments in southern Brazil. J. Soils 703
Sediments 18, 1159–1175. https://doi.org/10.1007/s11368-017-1894-y 704
Merten, G.H., Araújo, A.G., Biscaia, R.C.M., Barbosa, G.M.C., Conte, O., 2015. 705
No-till surface runoff and soil losses in southern Brazil. Soil Tillage Res. 706
152, 85–93. https://doi.org/10.1016/j.still.2015.03.014 707
Merten, G.H., Horowitz, A.J., Minella, J.P.G., Moro, M., 2014. Determinação da 708
concentração de sedimentos em suspensão em rios com o uso de 709
turbidímetro. Porto Alegre, Brasil. 710
Minella, J.P.G., Merten, G.H., Barros, C.A.P., Ramon, R., Schlesner, A., Clarke, 711
R.T., Moro, M., Dalbianco, L., 2018. Long-term sediment yield from a small 712
catchment in southern Brazil affected by land use and soil management 713
changes. Hydrol. Process. 32, 200–211. https://doi.org/10.1002/hyp.11404 714
30 Moatar, F., Abbott, B.W., Minaudo, C., Curie, F., Pinay, G., 2017. Elemental 715
properties, hydrology, and biology interact to shape concentration-716
discharge curves for carbon, nutrients, sediment, and major ions. Water 717
Resour. Res. 53, 1270–1287. https://doi.org/10.1002/2016WR019635 718
Musolff, A., Schmidt, C., Selle, B., Fleckenstein, J.H., 2015. Catchment controls 719
on solute export. Adv. Water Resour. 86, 133–146. 720
https://doi.org/10.1016/j.advwatres.2015.09.026 721
Pellegrini, J.B.R., Dos Santos, D.R., Gonçalves, C.S., Copetti, A.C.C., 722
Bortoluzzi, E.C., Tessier, D., 2010. Impacts of anthropic pressures on soil 723
phosphorus availability, concentration, and phosphorus forms in sediments 724
in a Southern Brazilian watershed. J. Soils Sediments 10, 451–460. 725
https://doi.org/10.1007/s11368-009-0125-6 726
Piazza, G.A., Dupas, R., Gascuel-Odoux, C., Grimaldi, C., Pinheiro, A., 727
Kaufmann, V., 2018. Influence of hydroclimatic variations on solute 728
concentration dynamics in nested subtropical catchments with 729
heterogeneous landscapes. Sci. Total Environ. 635, 1091–1101. 730
https://doi.org/10.1016/j.scitotenv.2018.03.394 731
Ramon, R., 2017. Kinetic energy measurement of rainfall and defining a pluvial 732
index to estimate erosivity in Arvorezinha/RS. Master thesis. Federal 733
University of Santa Maria. 734
Ramon, R., Minella, J.P.G., Merten, G.H., de Barros, C.A.P., Canale, T., 2017. 735
Kinetic energy estimation by rainfall intensity and its usefulness in 736
predicting hydrosedimentological variables in a small rural catchment in 737
southern Brazil. Catena. https://doi.org/10.1016/j.catena.2016.07.015 738
31 Robinet, J., Minella, J.P.G., de Barros, C.A.P., Schlesner, A., Lücke, A., 739
Ameijeiras-Mariño, Y., Opfergelt, S., Vanderborght, J., Govers, G., 2018. 740
Impacts of forest conversion and agriculture practices on water pathways in 741
Southern Brazil. Hydrol. Process. 32, 2304–2317. 742
https://doi.org/10.1002/hyp.13155 743
Rose, L.A., Karwan, D.L., Godsey, S.E., 2018. Concentration-discharge 744
relationships describe solute and sediment mobilization, reaction, and 745
transport at event and longer timescales. Hydrol. Process. 32, 2829–2844. 746
https://doi.org/10.1002/hyp.13235 747
Rumsey, C.A., Miller, M.P., Schwarz, G.E., Hirsch, R.M., Susong, D.D., 2017. 748
The role of baseflow in dissolved solids delivery to streams in the Upper 749
Colorado River Basin. Hydrol. Process. 31, 4705–4718. 750
https://doi.org/10.1002/hyp.11390 751
Shreve, E.A., Downs, A.C., 2005. Quality-Assurance Plan for the Analysis of 752
Fluvial Sediment by the U.S. Geological Survey Kentucky Water Science 753
Center Sediment Laboratory. Geol. Surv. Open-File Rep. -1230. 35. 754
SILVEIRA, L., CHARBONNIER, F., GENTA, J.L., 2000. The antecedent soil 755
moisture condition of the curve number procedure. Hydrol. Sci. J. 45, 3–12. 756
https://doi.org/10.1080/02626660009492302 757
Tang, X., Li, R., Wu, M., Zhao, W., Zhao, L., Zhou, Y., Bowes, M.J., 2019. 758
Science of the Total Environment In fl uence of turbid fl ood water release 759
on sediment deposition and phosphorus distribution in the bed sediment of 760
the Three Gorges. Sci. Total Environ. 657, 36–45. 761
https://doi.org/10.1016/j.scitotenv.2018.12.011 762
32 Thomas, Z., Abbott, B.W., Troccaz, O., Baudry, J., Pinay, G., 2016. Proximate 763
and ultimate controls on carbon and nutrient dynamics of small agricultural 764
catchments. Biogeosciences 13, 1863–1875. https://doi.org/10.5194/bg-13-765
1863-2016 766
Thompson, S.E., Basu, N.B., Lascurain, J., Aubeneau, A., Rao, P.S.C., 2011. 767
Relative dominance of hydrologic versus biogeochemical factors on solute 768
export across impact gradients. Water Resour. Res. 47, 1–20. 769
https://doi.org/10.1029/2010WR009605 770
Tiecher, T., Caner, L., Minella, J.P.G., Santos, D.R. dos, 2015. Combining 771
visible-based-color parameters and geochemical tracers to improve 772
sediment source discrimination and apportionment. Sci. Total Environ. 773
527–528, 135–149. https://doi.org/10.1016/j.scitotenv.2015.04.103 774
U.S. EPA, 1997. Method 300.1, Revision 1.0: Determination of Inorganic Anions 775
in Drinking Water by Ion Chromatography. Washington, DC. 776
U.S. EPA, 1996. EPA Method 3050B, Revision 2: Acid Digestion of Sediments, 777
Sludges, and Soils. Washington, DC. 778
U.S. EPA, 1994. Method 200.7, Revision 4.4: Determination of macro and trace 779
elements in rare earth magnesium cast iron by inductively coupled plasma 780
atomic emission spectrometry. Washington, DC. 781
Vaughan, M.C.H., Bowden, W.B., Shanley, J.B., Vermilyea, A., Schroth, A.W., 782
2019. Shining light on the storm: in-stream optics reveal hysteresis of 783
dissolved organic matter character. Biogeochemistry 143, 275–291. 784
https://doi.org/10.1007/s10533-019-00561-w 785
33 Verheyen, D., Van Gaelen, N., Ronchi, B., Batelaan, O., Struyf, E., Govers, G., 786
Merckx, R., Diels, J., 2015. Dissolved phosphorus transport from soil to 787
surface water in catchments with different land use. Ambio 44, 228–240. 788
https://doi.org/10.1007/s13280-014-0617-5 789
Von Freyberg, J., Studer, B., Kirchner, J.W., 2017. A lab in the field: High-790
frequency analysis of water quality and stable isotopes in stream water and 791
precipitation. Hydrol. Earth Syst. Sci. 21, 1721–1739. 792
https://doi.org/10.5194/hess-21-1721-2017 793
Wan, Y., Wan, L., Li, Y., Doering, P., 2017. Decadal and seasonal trends of 794
nutrient concentration and export from highly managed coastal catchments. 795
Water Res. 115, 180–194. https://doi.org/10.1016/j.watres.2017.02.068 796
Williams, M.R., Livingston, S.J., Penn, C.J., Smith, D.R., King, K.W., Huang, C. 797
hua, 2018. Controls of event-based nutrient transport within nested 798
headwater agricultural watersheds of the western Lake Erie basin. J. 799
Hydrol. 559, 749–761. https://doi.org/10.1016/j.jhydrol.2018.02.079 800
Wymore, A.S., Leon, M.C., Shanley, J.B., McDowell, W.H., 2019. Hysteretic 801
response of solutes and turbidity at the event scale across forested tropical 802
montane watersheds. Front. Earth Sci. 7. 803
https://doi.org/10.3389/feart.2019.00126 804
805 806
34 807
Figure 1 – Location of the study site in Brazil and the hydro-sedimentary 808
monitoring within the catchment. 809
810
Figure 2 – Average distribution of chemical elements in dissolved and 811
particulate forms during the rainfall events monitored from 2011 to 2015. 812
813
Figure 3: Plot of log (C) – log (Q) regression slope – β versus CVC/CVQ for all
814
elements determined in the current study. The plotted values correspond to the 815
mean of those measurements conducted on all the samples analyzed during 816
the 2011 – 2015 period. Error bars represent ± 1 Standard Error β. SSC: 817
suspended sediment concentration; DOC: dissolved organic carbon. 818
819
Figure 4: Plots of median hysteresis index versus median flushing index for 820
chemical across all sampled rainfall events from 2011 to 2015. SSC: suspended 821
sediment concentration; DOC: dissolved organic carbon. HI and FI values are 822
normalized considering their maximum value equal to 1. 823
824 825 826
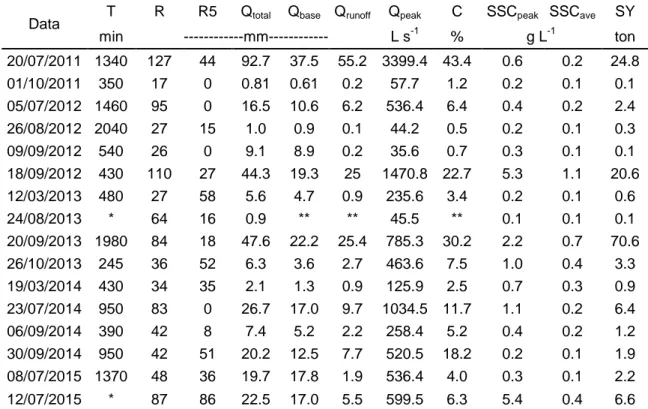
Table 1: Hydro-sedimentary variables monitored during events from 2011 to 2015 in the Arvorezinha catchment.
Data T R R5 Qtotal Qbase Qrunoff Qpeak C SSCpeak SSCave SY min ---mm--- L s-1 % g L-1 ton 20/07/2011 1340 127 44 92.7 37.5 55.2 3399.4 43.4 0.6 0.2 24.8 01/10/2011 350 17 0 0.81 0.61 0.2 57.7 1.2 0.2 0.1 0.1 05/07/2012 1460 95 0 16.5 10.6 6.2 536.4 6.4 0.4 0.2 2.4 26/08/2012 2040 27 15 1.0 0.9 0.1 44.2 0.5 0.2 0.1 0.3 09/09/2012 540 26 0 9.1 8.9 0.2 35.6 0.7 0.3 0.1 0.1 18/09/2012 430 110 27 44.3 19.3 25 1470.8 22.7 5.3 1.1 20.6 12/03/2013 480 27 58 5.6 4.7 0.9 235.6 3.4 0.2 0.1 0.6 24/08/2013 * 64 16 0.9 ** ** 45.5 ** 0.1 0.1 0.1 20/09/2013 1980 84 18 47.6 22.2 25.4 785.3 30.2 2.2 0.7 70.6 26/10/2013 245 36 52 6.3 3.6 2.7 463.6 7.5 1.0 0.4 3.3 19/03/2014 430 34 35 2.1 1.3 0.9 125.9 2.5 0.7 0.3 0.9 23/07/2014 950 83 0 26.7 17.0 9.7 1034.5 11.7 1.1 0.2 6.4 06/09/2014 390 42 8 7.4 5.2 2.2 258.4 5.2 0.4 0.2 1.2 30/09/2014 950 42 51 20.2 12.5 7.7 520.5 18.2 0.2 0.1 1.9 08/07/2015 1370 48 36 19.7 17.8 1.9 536.4 4.0 0.3 0.1 2.2 12/07/2015 * 87 86 22.5 17.0 5.5 599.5 6.3 5.4 0.4 6.6
* Events that lasted more than one day. ** This event was long, and the rainfall was of low intensity; accordingly, during the period of sampling, the flow level did not rise. T = duration of the rainfall, R = rainfall depth, R5 = antecedent rainfall of the last five days, Qtotal= total flow,
Qbase= total base flow, Qrunoff= total surface runoff; Qpeak= peak flow, C = surface runoff
coefficient, SSCpeak= peak suspended sediment concentration, SSCave= average suspended
sediment concentration, SY= sediment yield.