HAL Id: hal-03023526
https://hal.sorbonne-universite.fr/hal-03023526
Submitted on 25 Nov 2020HAL is a multi-disciplinary open access archive for the deposit and dissemination of sci-entific research documents, whether they are pub-lished or not. The documents may come from teaching and research institutions in France or abroad, or from public or private research centers.
L’archive ouverte pluridisciplinaire HAL, est destinée au dépôt et à la diffusion de documents scientifiques de niveau recherche, publiés ou non, émanant des établissements d’enseignement et de recherche français ou étrangers, des laboratoires publics ou privés.
The RUSH2A Study: Best-Corrected Visual Acuity,
Full-Field Electroretinography Amplitudes, and
Full-Field Stimulus Thresholds at Baseline
David Birch, Peiyao Cheng, Jacque Duncan, Allison Ayala, Maureen Maguire,
Isabelle Audo, Janet Cheetham, Todd Durham, Abigail Fahim, Frederick
Ferris, et al.
To cite this version:
David Birch, Peiyao Cheng, Jacque Duncan, Allison Ayala, Maureen Maguire, et al.. The RUSH2A Study: Best-Corrected Visual Acuity, Full-Field Electroretinography Amplitudes, and Full-Field Stim-ulus Thresholds at Baseline. Translational vision science & technology, Association for Research in Vision and Ophthalmology (ARVO), 2020, 9 (9), �10.1167/tvst.9.11.9�. �hal-03023526�
Article
The RUSH2A Study: Best-Corrected Visual Acuity, Full-Field
Electroretinography Amplitudes, and Full-Field Stimulus
Thresholds at Baseline
David G. Birch
1, Peiyao Cheng
2, Jacque L. Duncan
3, Allison R. Ayala
2, Maureen
G. Maguire
4, Isabelle Audo
5,6, Janet K. Cheetham
7, Todd A. Durham
7, Abigail
T. Fahim
8, Frederick L. Ferris, III
9, Elise Heon
10, Rachel M. Huckfeldt
11,
Alessandro Iannaccone
12, Naheed W. Khan
8, Eleonora M. Lad
12, Michel Michaelides
13,
Mark E. Pennesi
14, Katarina Stingl
15,16, Ajoy Vincent
10, and Christina Y. Weng
17, for the
Foundation Fighting Blindness Consortium Investigator Group
*1Retina Foundation of the Southwest, Dallas, TX, USA 2Jaeb Center for Health Research, Tampa, FL, USA
3University of California, San Francisco, San Francisco, CA, USA 4University of Pennsylvania, Philadelphia, PA, USA
5Institut de la Vision, Sorbonne Université, INSERM, CNRS, Paris, France
6Centre Hospitalier National d’Ophtalmologie des Quinze-Vingts, INSERM-DGOS CIC1423, Paris, France 7Foundation Fighting Blindness, Columbia, MD, USA
8University of Michigan, Kellogg Eye Center, Ann Arbor, MI, USA 9Ophthalmic Research Consultants, Waxhaw, NC, USA
10Departments of Ophthalmology and Vision Sciences, The Hospital for Sick Children, The University of Toronto, Toronto, Ontario, Canada 11Massachusetts Eye and Ear, Boston, MA, USA
12Duke University Medical Center, Department of Ophthalmology, Durham, NC, USA 13Moorfields Eye Hospital and UCL Institute of Ophthalmology, London, UK 14Casey Eye Institute - Oregon Health & Science University, Portland, OR, USA
15University Eye Hospital, Center for Ophthalmology, University of Tuebingen, Tuebingen, Germany 16Center for Rare Eye Diseases, University of Tuebingen, Tuebingen, Germany
17Baylor College of Medicine, Houston, TX, USA
Correspondence: Allison R. Ayala,
Jaeb Center for Health Research; 15310 Amberly Drive, Tampa, FL 33647, USA. e-mail:
Received: July 20, 2020 Accepted: September 6, 2020 Published: October 8, 2020 Keywords: Usher syndrome type 2
(USH2A); retinitis pigmentosa; best corrected visual acuity (BCVA); electroretinography (ERG); full-field stimulus test
Citation: Birch DG, Cheng P, Duncan
JL, Ayala AR, Maguire MG, Audo I, Cheetham JK, Durham TA, Fahim AT, Ferris FL III, Heon E, Huckfeldt RM, Iannaccone A, Khan NW, Lad EM,
Purpose: The purpose of this study was to evaluate baseline best corrected visual
acuity (BCVA), full-field electroretinography (ERG), full-field stimulus thresholds (FST), and their relationship with baseline demographic and clinical characteristics in the Rate of Progression in Usher syndrome type 2 (USH2A)-related Retinal Degeneration (RUSH2A) multicenter study.
Methods: Participants had Usher syndrome type 2 (USH2, N = 80) or autosomal
reces-sive nonsyndromic retinitis pigmentosa (ARRP, N = 47) associated with biallelic variants in the USH2A gene. Associations of demographic and clinical characteristics with BCVA, ERG, and FST were assessed with regression models.
Results: In comparison to ARRP, USH2 had worse BCVA (median 79 vs. 82 letters; P <
0.001 adjusted for age), lower rod-mediated ERG b-wave amplitudes (median 0.0 vs. 6.6 μV; P < 0.001) and 30 Hz flicker cone-mediated ERG amplitudes (median 1.5 vs. 3.1 μV;
P = 0.001), and higher (white, blue, and red) FST thresholds (means [−26, −31, −23 dB]
vs. [−39, −45, −28 dB]; P < 0.001 for all stimuli). After adjusting for age, gender, and duration of vision loss, the difference in BCVA between diagnosis groups was attenuated (P = 0.09). Only diagnosis was associated with rod- and cone-mediated ERG parameters, whereas both genders (P = 0.04) and duration of visual loss (P < 0.001) also were associ-ated with FST white stimulus.
Copyright 2020 The Authors
Conclusions: USH2 participants had worse BCVA, ERG, and FST than ARRP participants.
FST was strongly associated with duration of disease; it remains to be determined whether it will be a sensitive measure of progression.
Translational Relevance: Using standardized research protocols in RUSH2A, measures
have been identified to monitor disease progression and treatment response and differ-entiate features of prognostic relevance between USH2 and ARRP participants with
USH2A mutations.
Michaelides M, Pennesi ME, Stingl K, Vincent A, Weng CY. The RUSH2A study: Best-corrected visual acuity, full-field electroretinography amplitudes, and full-field stimulus thresholds at baseline. Trans Vis Sci Tech. 2020;9(11):9,
https://doi.org/10.1167/tvst.9.11.9
Introduction
Variants in the Usher syndrome type 2 (USH2A) gene are among the most common causes of inher-ited retinal degenerations (IRDs).1 Biallelic variants can result in early partial sensorineural hearing loss combined with retinitis pigmentosa (RP) - namely Usher syndrome type 2 (USH2), the most common form of Usher syndrome. In addition, USH2A variants account for 12% to 25% of individuals with nonsyn-dromic autosomal recessive RP (ARRP), thereby also representing the most common cause of ARRP.2,3 Given that treatment trials for USH2A-related retinal degeneration are ongoing, and that additional trials are planned, it is imperative to learn more about the natural history of USH2A-mediated disease in order to select the best outcome measures of change in visual function. The Rate of Progression of USH2A-related
Retinal Degeneration (RUSH2A) study was initiated
in 2017. The goal of this multicenter, international, longitudinal natural history study is to evaluate the role of state-of-the-art testing modalities to determine the most effective and time-sensitive methods for monitor-ing these individuals in future trials. Secondary goals are to identify risk factors that influence the rate of progression, to evaluate relationships among different functional and structural measures, and to identify a pool of well-characterized potential participants for anticipated treatment trials.
Best-corrected visual acuity (BCVA), full-field electroretinography (ERG) and the full-field stimulus threshold (FST) test are three of the outcome measures evaluated in the study herein. BCVA was measured with the Early Treatment of Diabetic Retinopathy Study (ETDRS) eye charts, and the electronic visual acuity (EVA) equivalent, which are in widespread use in clinical trials.4,5 The ERG is among the most widely used measures for diagnosing and following individuals with IRDs and, in the present study, were used to assess rod- and cone-mediated responses at baseline. The ERG was complemented by the FST test, because individuals with moderate to severe visual loss often have an ERG that is unmeasurable.6,7
The objectives of the current report are to describe BCVA, ERG, and FST measures at baseline in the RUSH2A study, to evaluate correlations between these functional measures, and to evaluate their associations with clinical characteristics.
Methods
Study Design
Details of the design of this multicenter, longitu-dinal natural history study (NCT03146078) have been described previously.8 Briefly, 127 participants were enrolled at 16 clinical sites in North America and Europe. The study adhered to the tenets of the Declara-tion of Helsinki and was approved by the instituDeclara-tional review boards (IRBs) or ethics boards associated with each participating site.
Participants were at least 8 years old with a clini-cal diagnosis of rod-cone degeneration associated with at least 2 disease-causing USH2A sequence variants in trans. A committee reviewed all genetic reports to confirm the variants as pathogenic or likely pathogenic. The majority of testing was performed in the “study” eye, defined as the eye with better baseline BCVA. The primary cohort included 105 participants with a baseline ETDRS letter score of 54 or greater (20/80 or better) in the better eye, central visual field at least 10 degrees diameter, and stable fixation. A secondary cohort of 22 participants with ETDRS letter score of 53 or worse (20/100 or worse), central visual field less than 10 degrees diameter, or unstable fixation, was enrolled to complete a baseline visit only. Both cohorts are combined in this baseline cross-sectional report.
Outcome Measures
The visit schedule and testing procedure for this prospective study have been documented previ-ously.8 The primary focus of the current report is baseline BCVA, ERG, and FST measures. All measure-ments were performed by study certified technicians following standardized protocols. Following subjective
refraction, BCVA was measured as the ETDRS letter score on the EVA tester or ETDRS charts.4,5 Only BCVA from study eyes was used for analyses.
Full-field ERG was performed following the International Society for Clinical Electrophysiol-ogy of Vision (ISCEV) protocol.9 The full-field ERG measures in the current analyses included the ampli-tude of the b-wave from the dark adapted dim-flash 0.01 cd.s/m2 ERG response (DA 0.01 ERG), which reflects a rod-driven bipolar cell response; the ampli-tude of the b-wave of the dark adapted standard flash 3.0 cd.s/m2 ERG (DA 3.0 ERG), which arises from a combined response of both rod and cone systems; and the trough-to-peak amplitude of the light-adapted 30 Hz flicker (LA 3.0 flicker ERG), which is cone-driven.
FST was performed on the Espion E3 (Diagnosys
LCC, Lowell, MA). White, blue, and red stimuli were used for FST testing, with a two parameter Weibull function determining the actual threshold, while considering false positives and false negatives.7 In the FST protocol for all three colors, the baseline of 0 dB was defined as 0.1 cd/m2. Thresholds were
measured in triplicates for each color and the averaged result from the three tests were used for each color in order to determine receptor type mediating threshold.
Statistical Methods
The distributions of BCVA, ERG, and FST measures were summarized using means and standard deviations (SDs) or medians and interquartile ranges (IQRs), depending on the distribution of the data. The percentage of eyes with no response on ERG testing was also reported. Correlations among BCVA, ERG, and FST measures were assessed with Spearman corre-lation coefficients.
Associations between participant characteristics and BCVA, ERG, and FST outcomes were assessed. Linear regression models were used to assess the association between each participant characteristic and BCVA score. A stepwise selection method was used to determine a multivariable model for BCVA score. Clinical diagnosis was forced into the model and other factors with P value< 0.05 were considered as statis-tically significant and remained in the final model. Because BCVA scores have a skewed distribution, the ranked normal score transformation of the BCVA score was used as an outcome variable in the regression model. Similar regression models were used for the FST outcomes. All three ERG outcomes had a large propor-tion of zero responses and the b-wave amplitude had a skewed distribution; analyses for these outcomes were performed with generalized linear regression models for the Tweedie distribution and a log link function.10
All analyses were conducted using SAS version 9.4 (SAS Institute, Cary, NC) and reported P values are two-sided.
Results
Study Population
A detailed description of the RUSH2A participant enrollment flow and baseline characteristics was previ-ously published.8 A total of 127 participants were enrolled into the study, with 105 in the primary cohort and 22 in the secondary cohort. The clinical diagno-sis based on the self-reported hearing loss history was USH2 for 80 (63%) participants and ARRP for 47 (37%) participants. The median age was 37 years (IQR = 27 to 44 years) for the USH2 group and 44 years (IQR= 36 to 50 years) for the ARRP group. Overall, 68 of the participants (54%) were women, 113 (89%) were white, and 83 (65%) were enrolled in the US or Canadian sites. The median age at onset of first noticed vision loss was 16 years (IQR= 13 to 22 years) for the USH2 group and 32 years (IQR= 20 to 41 years) in the ARRP group. Among the 122 participants with audiol-ogy testing data, 97% (73 of 75) of the USH2 partici-pants had moderate or worse hearing loss, whereas only 9% (4 of 47) of the ARRP participants had moderate adult-onset hearing loss.
Summary of BCVA, ERG, and FST Findings at
Baseline
Summary of the BCVA, ERG, and FST findings at baseline are provided in Table 1 for the entire study group and stratified by clinical diagnosis. Overall, 75 (59%) of the participants had a baseline BCVA of> 79 letters (≥ 20/25). Fifty-four percent of the USH2 group and 68% of the ARRP group had BCVA> 79 letters. Those with USH2 had significantly worse BCVA scores (median, 79 letters), than those with ARRP (median, 82 letters; P< 0.001 after adjusting for age).
All but one RUSH2A participant had ERG testing. Scotopic responses to a dim-flash (DA 0.01) were unmeasurable in 40 (51%) of participants with USH2 compared with 19 (40%) of those with ARRP. The median rod-driven b-wave amplitude was significantly larger in ARRP than in USH2 (6.6 vs. 0.0 μV, P< 0.001 after adjusting for age; seeTable 1). A lower percent-age of the overall cohort had unmeasurable mixed rod-cone DA 3.0 ERG responses (35%) than DA 0.01 ERG responses (47%; see Table 1). The amplitudes for the DA 3.0 ERG b-wave responses were also significantly larger in ARRP than USH2 (median 11.6 vs. 5.0 μV,
Table 1. Best Corrected Visual Acuity (BCVA), Electroretinography (ERG), and Full-Field Stimulus Threshold (FST) Measures by Clinical Diagnosis
Overall (N = 127) USH2 (N = 80) ARRP (N = 47) P Value
BCVA Letter Score
<69 (< 20/40) 14 (11%) 11 (14%) 3 (6%) 69–73 (20/40) 14 (11%) 9 (11%) 5 (11%) 74–78 (20/32) 24 (19%) 17 (21%) 7 (15%) 79–83 (20/25) 33 (26%) 18 (23%) 15 (32%) ≥84 (≥20/20) 42 (33%) 25 (31%) 17 (36%) Median (IQR) 80 (75, 85) 79 (74, 85) 82 (77, 87) <0.001a ERG Responses
No. with test results 126 79 47
DA 0.01 ERG amplitude (μV)
Unmeasurable, n 59 (47%) 40 (51%) 19 (40%)
Median (IQR) 0.7 (0.0, 7.4) 0.0 (0.0, 5.0) 6.6 (0.0, 19.0) <0.001b DA 3.0 ERG b-wave amplitude (μV)
Unmeasurable, n (%) 44 (35%) 30 (38%) 14 (30%)
Median (IQR) 6.2 (0.0, 15.5) 5.0 (0.0, 11.8) 11.6 (0.0, 64.0) <0.001b LA 3.0 flicker ERG amplitude (μV)
Unmeasurable, n 37 (29%) 25 (32%) 12 (26%)
Median (IQR) 2.0 (0.0, 7.7) 1.5 (0.0, 5.5) 3.1 (0.0, 20.0) 0.001b FST (dB)
No. with test results 93 56 37
White stimulus, mean ± SD −32 ± 13 −26 ± 10 −39 ± 13 <0.001a
Blue stimulus, mean ± SD −36 ± 14 −31 ± 11 −45 ± 14 <0.001a
Red stimulus, mean ± SD −25 ± 7 −23 ± 6 −28 ± 8 <0.001a
aP value calculated using linear regression model, adjusting for age.
bP value calculated using generalized linear regression model with Tweedie distribution, adjusting for age.
P< 0.001 after adjusting for age). The percentage of
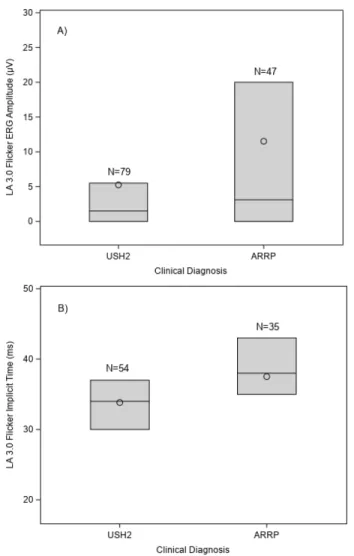
unmeasurable LA 3.0 flicker ERG responses was even lower in the entire cohort (29%), and median ampli-tudes were significantly higher in the ARRP group than the USH2 group (3.1 vs. 1.5 μV, P = 0.001 after adjusting for age; Fig. 1A, Table 1). Compared with normal individuals (typical mean ± SD: 28 ± 2.5 ms),11 participants with ARRP had a delay in LA 3.0 flicker ERG implicit time (mean ± SD: 38 ± 6 ms) that was significantly (P = 0.005) greater than implicit time delay observed in USH2 (mean± SD: 34 ± 6 ms; Fig. 1B). FST was not available at all sites, with 93 participants (73%) undergoing testing. There were significant differences for all three stimuli, white, blue, and red, between clinical diagnosis groups (P < 0.001), with the ARRP group showing lower thresholds (less severely impaired retinal function) than the USH2 group (seeTable 1).Figure 2shows representative FST threshold results from three different participants and a normal subject. Each graph shows the probability of a positive response against the stimulus intensity.
Panel A, (USH2, age 55 years old), with a white thresh-old of −20 dB, represents an example of a participant with primarily cone mediated thresholds, because the thresholds to the photopically matched blue and red were similar. The participant shown in panel B (USH2, age 19 years old) has a threshold to white of −35 dB. The difference in blue and red thresholds was 10 dB, suggesting that rods are mediating the response to the blue (and white) stimulus. The participant shown in panel C (USH2, age 61 years old) had a mean white threshold of −55 dB. Thresholds for the blue stimu-lus were 25 dB lower than thresholds to red, consistent with rod mediation and similar to the blue-red thresh-old difference seen in a normal observer (panel D, age 25 years old).6
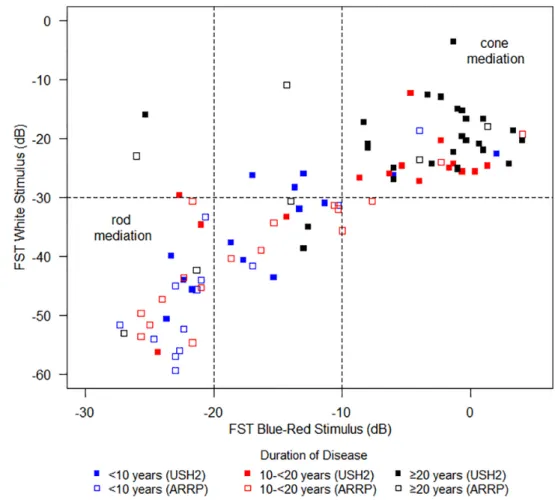
The relationship between FST white stimulus threshold and blue-red threshold difference by duration of vision loss is shown in Figure 3 for all partici-pants. A difference between blue and red FST thresh-olds of ≤ 10 dB appears to indicate cone-mediated dark-adapted thresholds. The upper right region of the
Figure 1. Light-adapted 3.0 flicker Electroretinography (ERG) response by clinical diagnosis. (A) Amplitude; (B) implicit time. The
bottom and top of each box denote the 25th and 75th percentiles, the line inside the box denotes the median and the circle is the mean.
graph shows that approximately 40 of 93 participants (43%) with FST data showed no definite evidence of rod function. For these participants, white thresholds were above −30 dB and blue-red differences around zero, indicating that cones might be primarily mediat-ing FST thresholds. The lower left corner shows partic-ipants with blue-red differences of ≥20 dB indicating rod mediation. Based on these results, the lower limit for cone mediation of the white stimulus appears to be −30 dB. Thus, when a participant has a white thresh-old below −30 dB, we can assume that the patient has rods mediating the threshold. Those with remain-ing rod function are primarily those with< 20 years of reported vision loss (39 of 44), whereas partici-pants with cone-mediated thresholds tended to have> 20 years of reported vision loss (28 of 49).
Figure 2. Full-field stimulus thresholds (FST) threshold results from three different participants and one normal subject. Black,
blue, and red colors represent responses from white, blue, and red stimuli, respectively. (A) Cone-mediated (USH2, age 55 years old); (B) mixed (USH2, age 19 years old); (C) rod-mediated (USH2, age 61 years old); (D) normal (age 25 years old).7
Correlations Among BCVA, ERG, and FST
Measures
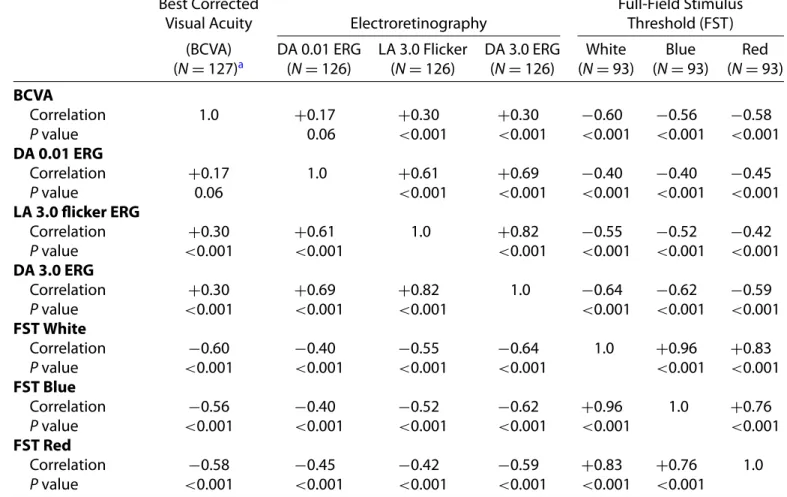
Correlations among BCVA, ERG, and FST measures are shown in Table 2. Not surprisingly, most measures are at least moderately correlated, because all reflect the severity of disease. As expected, there is a low correlation (0.17) of the BCVA with the DA 0.01 ERG, but the correlation with LA 3.0 flicker ERG though stronger, is still a limited correlation (0.30). The FST white threshold was moderately corre-lated with BCVA (−0.60; Supplementary Figure S2) and with LA 3.0 flicker (−0.55) and DA 3.0 (−0.64) ERG (seeTable 2).
Figure 3. Full-field stimulus thresholds (FST) white versus blue-red by duration of disease and clinical diagnosis. Filled symbols
represent USH2 participants and open symbols represent ARRP participants. Blue, red, and black symbols represent duration of disease at
< 10 years, 10 to < 20 years, and ≥20 years, respectively.
Association of Baseline Characteristics with
BCVA
Median (IQR) of BCVA letter score by participant characteristics are shown in Table 3. Several partici-pant characteristics were significantly associated with lower BCVA letter score in univariable analyses: USH2 phenotype (P = 0.03), older age at enrollment (P < 0.001), and longer duration of vision loss (P< 0.001). From the multivariable analysis, age at enrollment, duration of vision loss, and gender were retained in the model, with women having significantly lower VA scores than men. Clinical diagnosis was marginally associated with BCVA letter score after taking other factors into account. Race/ethnicity, smoking status, and dietary supplement use were not associated with baseline BCVA letter score.
Association of Baseline Characteristics with
ERG
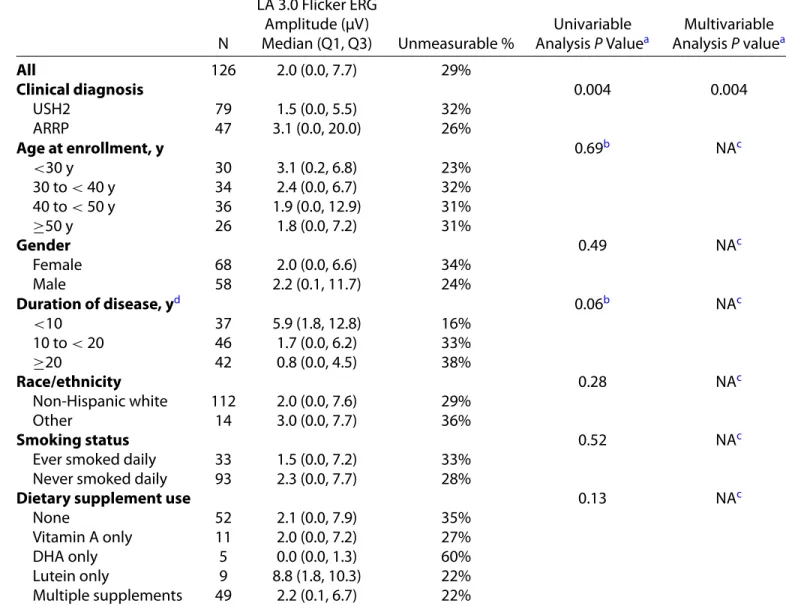
The variables associated with LA 3.0 flicker ERG trough-to-peak amplitude are shown inTable 4.
Clini-cal diagnosis is the only factor that was significantly associated with LA 3.0 flicker ERG response, with the median amplitude in the ARRP group being roughly twice the amplitude in the USH2 group (P = 0.004). As shown in Supplementary Figure S1, age was not associated with DA 0.01 ERG amplitude (panel A), DA 3.0 DA amplitude (panel B), or LA 3.0 flicker tude (panel C). We also analyzed DA 0.01 ERG ampli-tude and LA 3.0 flicker ERG implicit times (data not shown); the only characteristic associated with either of these parameters was clinical diagnosis.
Association of Baseline Characteristics with
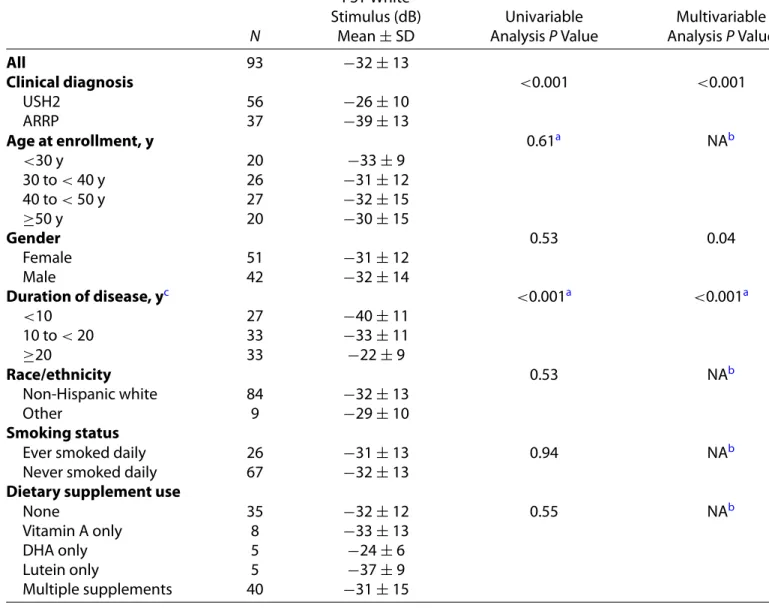
FST
The participant characteristics associated with the white FST thresholds are shown in Table 5. Clinical diagnosis was a strong determinant, with mean thresh-old to white stimulus being 13 dB lower (i.e. better sensitivity) in the ARRP group than in the USH2 group. Duration of vision loss was also strongly associ-ated with white thresholds; participants with≥20 years
Table 2. Spearman Correlation Coefficients Among Best Corrected Visual Acuity (BCVA), Electroretinography (ERG), and Full-Field Stimulus Threshold (FST) Measures
Best Corrected
Visual Acuity Electroretinography
Full-Field Stimulus Threshold (FST)
(BCVA) DA 0.01 ERG LA 3.0 Flicker DA 3.0 ERG White Blue Red
(N = 127)a (N = 126) (N = 126) (N = 126) (N = 93) (N = 93) (N = 93) BCVA Correlation 1.0 +0.17 +0.30 +0.30 −0.60 −0.56 −0.58 P value 0.06 <0.001 <0.001 <0.001 <0.001 <0.001 DA 0.01 ERG Correlation +0.17 1.0 +0.61 +0.69 −0.40 −0.40 −0.45 P value 0.06 <0.001 <0.001 <0.001 <0.001 <0.001 LA 3.0 flicker ERG Correlation +0.30 +0.61 1.0 +0.82 −0.55 −0.52 −0.42 P value <0.001 <0.001 <0.001 <0.001 <0.001 <0.001 DA 3.0 ERG Correlation +0.30 +0.69 +0.82 1.0 −0.64 −0.62 −0.59 P value <0.001 <0.001 <0.001 <0.001 <0.001 <0.001 FST White Correlation −0.60 −0.40 −0.55 −0.64 1.0 +0.96 +0.83 P value <0.001 <0.001 <0.001 <0.001 <0.001 <0.001 FST Blue Correlation −0.56 −0.40 −0.52 −0.62 +0.96 1.0 +0.76 P value <0.001 <0.001 <0.001 <0.001 <0.001 <0.001 FST Red Correlation −0.58 −0.45 −0.42 −0.59 +0.83 +0.76 1.0 P value <0.001 <0.001 <0.001 <0.001 <0.001 <0.001
aAmong 127 participants with VA scores, 126 had ERG results and 93 had FST results; all participants with ERG results had
FST results.
disease duration having a mean threshold 18 dB higher than those with < 10 years disease duration. Gender was only marginally associated with white thresh-olds (P = 0.04). Mean unadjusted gender difference (men and women) in FST white thresholds was only 1.7 dB (95% confidence interval [CI] = −3.7 to 7.0), however, in the final multivariable regression model, mean adjusted gender difference was 4.3 dB (95% CI = 0.2 to 8.5).
Disease Asymmetry
Disease asymmetry between the right eye and left eye was assessed on BCVA letter scores. The mean difference between the right eye and left eye (OD–OS) was−1.0 letters (95% CI = −2.3 to 0.3) and the intra-class correlation coefficient was 0.85. The difference was similar in both the USH2 group (mean= −0.9) and the ARRP group (mean = −1.2). No significant correlation was found between the difference in BCVA
letter scores and gender (P = 0.21) or duration of disease (P= 0.15).
Discussion
The majority of participants enrolled in the RUSH2A study were middle-aged (median age 40 years old),8 with USH2 participants being slightly younger (median 37 years) than the ARRP group (median 44 years). Most participants in the USH2 group (median 79 letters; 20/25) and the ARRP group (median 82 letters; 20/25) retained good BCVA, consis-tent with results from previous studies.12 Sandberg et al.2 found that the majority of 125 patients with
USH2A sequence variants had one to two lines of
acuity loss at 30 years of age and the median age of legal blindness due to decreased BCVA was 65 years. Calzetti et al.13reported acuity better than 20/50 at age 50 in all 14 patients with USH2. Despite the
gener-Table 3. Participant Characteristics Associated With Best Corrected Visual Acuity (BCVA)
N
BCVA Letter Score Median (Q1, Q3) Univariable Analysis P Value Multivariable Analysis P Value All 127 80 (75, 85) Clinical diagnosis 0.03 0.09 USH2 80 79 (74, 85) ARRP 47 82 (77, 87) Age at enrollment, y <0.001a 0.04 <30 y 30 82 (77, 89) 30 to< 40 y 34 80 (76, 84) 40 to< 50 y 37 82 (77, 85) ≥50 y 26 72 (64, 79) Gender 0.09 0.01 Female 68 80 (73, 84) Male 59 80 (75, 86) Duration of disease, yb <0.001a 0.004a <10 37 83 (77, 87) 10 to< 20 46 81 (76, 86) ≥20 43 75 (66, 82) Race/ethnicity 0.44 NAc Non-Hispanic white 113 80 (75, 85) Other 14 80 (75, 81) Smoking status 0.33 NAc
Ever smoked daily 33 82 (77, 84)
Never smoked daily 94 79 (74, 85)
Dietary supplement use 0.59 NAc
None 53 82 (75, 86)
Vitamin A only 11 78 (74, 82)
DHA only 5 77 (76, 80)
Lutein only 9 79 (76, 84)
Multiple supplements 49 79 (72, 85)
aVariable was analyzed as continuous.
bOne participant in the ARRP group was missing age of onset (a participant-reported field based on their awareness of visual
symptoms) and duration of disease (computed based on age of onset and date of enrollment).
cFactors with P values > 0.05 in the stepwise selection process were not included in the final multivariable model.
ally good acuity, we nevertheless found that BCVA in USH2 was significantly worse than in patients with ARRP, despite a slightly younger median age. Others have also reported that acuity is better in nonsyn-dromic patients than synnonsyn-dromic patients at the same age.14Among the participant characteristics evaluated, only age of enrollment, disease duration as measured from reported age of visual loss, and gender were associated with BCVA. The association with gender has not been found previously and has no obvious explanation.
Unlike BCVA, the full-field ERG was severely reduced in our participants. The majority had unmea-surable DA 0.01 ERG responses (mean age 40 years,
range = 14–80), severely limiting the value of this as a prospective measure in clinical trials. Similarly, others have reported unmeasurable DA 0.01 ERGs by age 26 years15 and in 17 of 18 patients in another cohort.13As anticipated in a rod-cone dystrophy, cone responses to LA 3.0 flicker ERG were less affected and remained measurable in the majority of participants at all ages. Similar to other studies,16 the ARRP group had significantly larger LA 3.0 flicker ERG amplitudes than the USH2 group despite being older on average. In a multivariate analysis, no participant characteristic other than clinical diagnosis was associated with LA 3.0 flicker ERG amplitude. Unmeasurable responses were found at all ages and there was only a weak
corre-Table 4. Participant Characteristics Associated With Light-Adapted 3.0 Flicker Electroretinography (ERG) Ampli-tude N LA 3.0 Flicker ERG Amplitude (μV) Median (Q1, Q3) Unmeasurable % Univariable Analysis P Valuea Multivariable Analysis P valuea All 126 2.0 (0.0, 7.7) 29% Clinical diagnosis 0.004 0.004 USH2 79 1.5 (0.0, 5.5) 32% ARRP 47 3.1 (0.0, 20.0) 26% Age at enrollment, y 0.69b NAc <30 y 30 3.1 (0.2, 6.8) 23% 30 to< 40 y 34 2.4 (0.0, 6.7) 32% 40 to< 50 y 36 1.9 (0.0, 12.9) 31% ≥50 y 26 1.8 (0.0, 7.2) 31% Gender 0.49 NAc Female 68 2.0 (0.0, 6.6) 34% Male 58 2.2 (0.1, 11.7) 24% Duration of disease, yd 0.06b NAc <10 37 5.9 (1.8, 12.8) 16% 10 to< 20 46 1.7 (0.0, 6.2) 33% ≥20 42 0.8 (0.0, 4.5) 38% Race/ethnicity 0.28 NAc Non-Hispanic white 112 2.0 (0.0, 7.6) 29% Other 14 3.0 (0.0, 7.7) 36% Smoking status 0.52 NAc
Ever smoked daily 33 1.5 (0.0, 7.2) 33%
Never smoked daily 93 2.3 (0.0, 7.7) 28%
Dietary supplement use 0.13 NAc
None 52 2.1 (0.0, 7.9) 35%
Vitamin A only 11 2.0 (0.0, 7.2) 27%
DHA only 5 0.0 (0.0, 1.3) 60%
Lutein only 9 8.8 (1.8, 10.3) 22%
Multiple supplements 49 2.2 (0.1, 6.7) 22%
aContinuous variable for DA 3.0 flicker amplitude was used as dependent variable. bVariable was analyzed as continuous.
cFactors with P values > 0.05 in the stepwise selection process were not included in the final multivariable model.
dOne participant in the ARRP group was missing age of onset (a participant-reported field based on their awareness of visual
symptoms) and duration of disease (computed based on age of onset and date of enrollment).
lation with BCVA, presumably because most of the cones that contribute to the cone ERG are extrafoveal. Delayed LA 3.0 flicker ERG implicit times are charac-teristic of RP17and were present in virtually all patients in the RUSH2A cohort. The USH2 group had signif-icantly less delays than the ARRP group, presumably because flicker responses in patients with small fields are dominated by foveal cones, which are faster than parafoveal cones.18
FST was originally developed to provide a metric in extremely low vision patients who could not perform
other tests reliably.6,7 FST does not require stable fixation and reflects the global light-sensitivity of the remaining photoreceptors. Although it is a less spatially specific measure compared to, for example, microperimetry or static perimetry, it has been used to provide a key reproducible outcome measure for a registration trial of the gene therapy voretigene neparvovec-rzyl (Luxturna, Spark Therapeutics) for patients with RPE65-related retinal dystrophy.19Here, for the first time, it is being used as a functional measure in a large prospective study. Using blue and
Table 5. Participant Characteristics Associated With Full-Field Stimulus Thresholds (FST) White Stimulus N FST White Stimulus (dB) Mean± SD Univariable Analysis P Value Multivariable Analysis P Value All 93 −32 ± 13 Clinical diagnosis <0.001 <0.001 USH2 56 −26 ± 10 ARRP 37 −39 ± 13 Age at enrollment, y 0.61a NAb <30 y 20 −33 ± 9 30 to< 40 y 26 −31 ± 12 40 to< 50 y 27 −32 ± 15 ≥50 y 20 −30 ± 15 Gender 0.53 0.04 Female 51 −31 ± 12 Male 42 −32 ± 14 Duration of disease, yc <0.001a <0.001a <10 27 −40 ± 11 10 to< 20 33 −33 ± 11 ≥20 33 −22 ± 9 Race/ethnicity 0.53 NAb Non-Hispanic white 84 −32 ± 13 Other 9 −29 ± 10 Smoking status
Ever smoked daily 26 −31 ± 13 0.94 NAb
Never smoked daily 67 −32 ± 13
Dietary supplement use
None 35 −32 ± 12 0.55 NAb
Vitamin A only 8 −33 ± 13
DHA only 5 −24 ± 6
Lutein only 5 −37 ± 9
Multiple supplements 40 −31 ± 15
aVariable was analyzed as continuous.
bFactors with P values > 0.05 in the stepwise selection process were not included in the final multivariable model.
cComputed from age of onset (a participant-reported field based on their awareness of visual symptoms) and date of
enroll-ment.
red stimuli, it was possible to identify participants with primarily rod-mediated thresholds to the white stimulus. White thresholds were strongly associated with clinical diagnosis and duration of vision loss, and weakly associated with gender. It remains to be determined whether unexpected gender differences in BCVA and FST will be present on future visits. The moderate correlation between FST threshold and BCVA was unexpected but may be consistent with the more general finding that cone loss (and reduced BCVA) occurs after substantial loss of rod function. It remains to be determined whether FST will be a sensitive method for following progression in this population.
Acknowledgments
David Birch is supported by an NIH grant EY009076. Isabelle Audo is a member of the French National Rare Diseases network of the eye and the ear, SENSGENE, and the ERN-EYE (European Reference Network for Rare Eye Diseases) and is supported by RHU-Light4deaf [ANR-15-RHU-0001] and IHU FOReSIGHT [ANR-18-IAHU-0001] supported by French state funds managed by the Agence Nationale de la Recherche within the Investissements d’Avenir program. Katarina Stingl is a member of the ERN-EYE (European Reference
Network for Rare Eye Diseases). Jacque Duncan is supported by an unrestricted grant from Research to Prevent Blindness to UCSF and NIH-NEI core grant NEI-EY002162. Abigail Fahim is supported by a NIH K12 grant K12EY022299. Rachel Huckfeldt is supported by Foundation Fighting Blindness (CD-CMM-0918-0747-MEEI). Alessandro Iannaccone and Eleonora M. Lad are supported by an Unrestricted departmental grant to the Duke Eye Center from Research to Prevent Blindness, New York, NY. Michel Michaelides is supported by a grant from the National Institute for Health Research Biomedical Research Centre at Moorfields Eye Hospital National Health Service Foundation Trust and UCL Institute of Ophthalmology. Mark Pennesi is supported by an unrestricted grant from RPB to Casey Eye Institute and a core grant NIH P30EY010572. Ajoy Vincent is supported by Foundation Fighting Blindness USA (CD-CL-0617-0727-HSC).
Disclosure: D.G. Birch, Biogen/Nightstarx (F), Acucela (C), ProQR (F, C), Nacuity (C), AGTC (F, C), Editas (C), 4D Therapeutics (F, C); P. Cheng None; J.L. Duncan, 4D Therapeutics (C), Acucela (F), AGTC (C), DTx Pharma, Inc. (C), Editas (C), Eloxx (C), Gyroscope (C), Biogen/Nightstarx (F, C), ProQR (C), Spark (C), SparingVision (S), Vedere Bio (S), Horama (C); A.R. Ayala None; M.G. Maguire Genentech/Roche (C), Regenera (C); I. Audo Novar-tis (C), SparingVision (C); J.K. Cheetham, AbbVie (I); T.A. Durham None; A.T. Fahim None; F.L. Ferris III, Bausch and Lomb (P, R), Janssen Research & Development, LLC (C) Viewpoint Therapeutics, Inc (C), Genetech (C), Norvo Nordisk (C), Apellis (C), Roche (C), SemaThera PTC Therapeutics (C), Regen-era (C), Novartis (C), Eyevensys (C), Kodiak (C), 4D Molecular (C), Clear Side Biomedical (C); E. Heon None; R.M. Huckfeldt, AGTC (F), Spark (F), Biogen (F), ProQR (F), MeiraGTx (F); A. Iannaccone, Alia Therapeutics (S), ClearView Healthcare Partners (C), Teladoc Health (C), GLG Group (C), Guidepoint (C), Astellas Institute for Regenerative Medicine (C), Roivant Pharma (C), Editas (C), Rhythm Pharma-ceuticals (C), IQVIA (C), Gyroscope (C), Ocugen (C), AGTC (F), AbbVie (F), Acucela (F), ProQR (F), Retinagenix (F), 4D Molecular Therapeutics (F), BridgeBio Pharma/Retinagenix (F); N.W. Khan None; E.M. Lad, Biogen/Nightstarx (C) and Novartis (C); M. Michaelides, MeiraGTx (F), Stargazer Pharma (F), Acucela (F), Astellas (F), ProQR (F), 2CTech (F); M.E. Pennesi, AbbVie/Editas (C), Spark Therapeu-tics (C), Wave Biosciences (C), Astellas Pharmaceu-ticals (C), RegenexBio (C), Iveric (C), Biogen (C), Novartis (C), Adverum (C), Gensight (F), ProQR (F),
Horama (F), Eyevensys (F), Nayan (F) (I), Nacuity (F, I), Ocugen (F, I), Vedere Bio (F, I), SparingVi-sion (F, I), AGTC (C), Sanofi (C); K. Stingl, ProQR (F); A. Vincent, ADVERUM Biotechnologies INC (C); C.Y. Weng, Allergan/AbbVie, Inc. (C), Alcon (C), Alimera Sciences (C), Regeneron (C), Novartis (C), Dutch Ophthalmic Research Center (C)
*The comprehensive list of FFB Consortium
Inves-tigator Group members participating in this proto-col was previously published in Duncan JL, Liang W, Maguire MG, et al. Baseline Visual Field Findings in the RUSH2A Study: Associated Factors and Correla-tion with Other Measures of Disease Severity. Am J
Ophthalmol. 2020; 219:87–100.
References
1. Pontikos N, Arno G, Jurkute N, et al. Genetic basis of inherited retinal disease in a molecularly char-acterized cohort of more than 3000 families from the United Kingdom [In Press]. Ophthalmology, https://doi.org/10.1016/j.ophtha.2020.1004.1008. 2. Sandberg MA, Rosner B, Weigel-DiFranco C,
McGee TL, Dryja TP, Berson EL. Disease course in patients with autosomal recessive retinitis pig-mentosa due to the USH2A gene. Invest
Ophthal-mol Vis Sci. 2008;49(12):5532–5539.
3. García-García G, Aller E, Jaijo T, et al. Novel dele-tions involving the USH2A gene in patients with Usher syndrome and retinitis pigmentosa. Mol Vis. 2014;20:1398–1410.
4. Beck RW, Moke PS, Turpin AH, et al. A com-puterized method of visual acuity testing: adapta-tion of the early treatment of diabetic retinopa-thy study testing protocol. Am J Ophthalmol. 2003;135(2):194–205.
5. Ferris FL, 3rd Kassoff A, Bresnick GH, Bailey I. New visual acuity charts for clinical research. Am
J Ophthalmol. 1982;94(1):91–96.
6. Roman AJ, Cideciyan AV, Aleman TS, Jacob-son SG. Full-field stimulus testing (FST) to quan-tify visual perception in severely blind candidates for treatment trials. Physiol Meas. 2007;28(8):N51– N56.
7. Klein M, Birch DG. Psychophysical assessment of low visual function in patients with retinal degen-erative diseases (RDDs) with the Diagnosys full-field stimulus threshold (D-FST). Doc Ophthalmol. 2009;119(3):217–224.
8. Duncan JL, Liang W, Maguire MG, et al. Base-line visual field findings in the RUSH2A study:
associated factors and correlation with other measures of disease severity. Am J Ophthalmol. 2020;219:87–100.
9. McCulloch DL, Marmor MF, Brigell MG, et al. ISCEV Standard for full-field clinical elec-troretinography (2015 update). Doc Ophthalmol. 2015;130(1):1–12.
10. Kurz CF. Tweedie distributions for fitting semicon-tinuous health care utilization cost data. BMC Med
Res Methodol. 2017;17(1):171.
11. Birch DG, Anderson JL. Standardized full-field electroretinography. Normal values and their variation with age. Arch Ophthalmol. 1992;110(11):1571–1576.
12. Stingl K, Kurtenbach A, Hahn G, et al. Full-field electroretinography, visual acuity and visual fields in Usher syndrome: a multicentre European study.
Doc Ophthalmol. 2019;139(2):151–160.
13. Calzetti G, Levy RA, Cideciyan AV, et al. Efficacy outcome measures for clinical trials of USH2A caused by the common c.2299delG mutation. Am
J Ophthalmol. 2018;193:114–129.
14. Hendriks M, Verhoeven VJM, Buitendijk GHS, et al. Development of refractive errors-What can
we learn from inherited retinal dystrophies? Am J
Ophthalmol. 2017;182:81–89.
15. Schwartz SB, Aleman TS, Cideciyan AV, et al. Disease expression in Usher syndrome caused by VLGR1 gene mutation (USH2C) and comparison with USH2A phenotype. Invest Ophthalmol Vis
Sci. 2005;46(2):734–743.
16. Sengillo JD, Cabral T, Schuerch K, et al. Elec-troretinography reveals difference in cone function between syndromic and nonsyndromic USH2A patients. Sci Rep. 2017;7(1):11170.
17. Berson EL. Retinitis pigmentosa and allied dis-eases: applications of electroretinographic testing.
Int Ophthalmol. 1981;4(1-2):7–22.
18. Birch DG, Fish GE. Focal cone electroretino-grams: aging and macular disease. Doc
Ophthal-mol. 1988;69(3):211–220.
19. Russell S, Bennett J, Wellman JA, et al. Efficacy and safety of voretigene neparvovec (AAV2-hRPE65v2) in patients with RPE65-mediated inherited retinal dystrophy: a randomised, controlled, open-label, phase 3 trial. Lancet. 2017;390(10097):849–860.