HAL Id: hal-02454395
https://hal.archives-ouvertes.fr/hal-02454395
Submitted on 24 Jan 2020
HAL is a multi-disciplinary open access
archive for the deposit and dissemination of sci-entific research documents, whether they are pub-lished or not. The documents may come from teaching and research institutions in France or abroad, or from public or private research centers.
L’archive ouverte pluridisciplinaire HAL, est destinée au dépôt et à la diffusion de documents scientifiques de niveau recherche, publiés ou non, émanant des établissements d’enseignement et de recherche français ou étrangers, des laboratoires publics ou privés.
The influence of semantic processing and response
latency on the SNARC effect
Daniele Didino, Christina Breil, André Knops
To cite this version:
Daniele Didino, Christina Breil, André Knops. The influence of semantic processing and response latency on the SNARC effect. Acta Psychologica, Elsevier, 2019, 196, pp.75-86. �10.1016/j.actpsy.2019.04.008�. �hal-02454395�
1 Title: The influence of semantic processing and response latency on the SNARC effect 1
2 3 4
Daniele Didinoa*, Christina Breila, André Knopsb,c
5 6 7 8
a. Department of Psychology, Faculty of Life Sciences, Humboldt-Universität zu Berlin, 9
Berlin, Germany. 10
b. CNRS UMR 8240, Laboratory for the Psychology of Child Development and Education, 11
Paris, France. 12
c. University Paris Descartes, Sorbonne Paris Cité, Paris, France. 13 14 15 16 * Corresponding author: 17 Daniele Didino 18
Department of Psychology, Humboldt-Universität zu Berlin, Rudower Chaussee 18, 12489 19
Berlin, Germany. E-mail: [email protected] 20
21 22
Competing interests: The authors declare that they have no conflict of interest. 23 24 25 26 27 28 29 30
2
1. INTRODUCTION
1 2
In their seminal paper, Dehaene, Bossini and Giraux (1993) asked participants to classify 3
the parity of numbers by pressing a left- or right-sided key (i.e., parity judgement task). They 4
discovered that relative small numbers elicit faster left-sided responses and large numbers 5
faster right-sided responses. Since then, this Spatial-Numerical Association of Response 6
Codes effect (SNARC; for reviews see Fisher & Shaki, 2014; van Dijck et al., 2015; Wood et 7
al., 2008) has been replicated multiple times. 8
Originally, the SNARC effect has been explained within the framework of the mental number 9
line (MNL) account (Dehaene et al., 1993). The MNL is a semantic long-term memory
10
representation in which numbers are coded on a unidimensional conceptual space, 11
horizontally organized in ascending order from left to right: small numbers are encoded on the 12
left side and large numbers on the right side (Hubbard et al., 2005). This spatial organization 13
is thought to emerge from cultural practices such as writing/reading direction (Göbel, 2015; 14
Göbel, Maier, & Shaki, 2015; Göbel, Shaki, & Fischer, 2011; for a right-to-left spatial orientation 15
of the MNL in non-Western cultures see Shaki, Fischer, & Göbel, 2012; Shaki, Fischer, & 16
Petrusic, 2009). According to the MNL account, the SNARC effect emerges from an 17
isomorphism (i.e., a direct mapping) between the position of a number on this semantic 18
representation and the left-right coordinates of the external response locations. Therefore, a 19
congruent mapping between conceptual (e.g., small numbers) and external space (e.g., left-20
sided responses) generates faster response latencies compared to an incongruent mapping 21
(e.g., small numbers and right-sided responses), and vice versa for large numbers. 22
In the majority of the tasks used to investigate the SNARC effect (e.g., parity judgement 23
task) the magnitude of the number is irrelevant for the decision process (for a list of tasks see 24
Wood et al., 2008). Therefore, the MNL account proposes that the SNARC effect emerges 25
from the interference produced by an automatic activation of the semantic representation of 26
numbers (Dehaene et al., 1993; Nuerk, Wood, & Willmes, 2005). An important question 27
pertains to whether and how the amount of semantic processing (i.e., processing of abstract 28
properties of numbers such as magnitude or parity) required by the task modulates the level 29
of interference generated by the MNL. In line with the MNL account, one would expect that 30
deeper semantic processing of a number leads to a stronger activation of the MNL and in turn 31
more interference (i.e., a stronger SNARC effect) is expected. Wood and colleagues (2008) 32
evaluated this hypothesis in a meta-analysis which was consistent with the MNL account. 33
Tasks requiring deeper semantic processing (e.g., parity judgement and magnitude 34
classification) were associated with a stronger SNARC effect compared to tasks asking to 35
discriminate non-semantic features of the numbers (e.g., color judgement) (see table 1 and 36
3 figure 2 in Wood et al., 2008). However, to the best of our knowledge, no study tested this 1
hypothesis in a within-participant design. 2
The assumption of a direct mapping between the position of a number on the MNL and 3
response location coordinates has been challenged by the dual route model (Gevers et al., 4
2006, 2010; Santens & Gevers, 2008) and the working memory (WM) account (Abrahamse, 5
van Dijck, & Fias, 2016; Fias & van Dijck, 2016; van Dijck & Fias, 2011; van Dijck, Gevers, & 6
Fias, 2009; van Dijck et al., 2012, 2014). Neither of these accounts predicts that the strength 7
of the SNARC effect is affected by the level of semantic processing required by a task. 8
The dual route model (Gevers et al., 2006, 2010; Santens & Gevers, 2008; see also the 9
polarity correspondence account for a similar idea not restricted to number processing, Proctor 10
and Cho, 2006) introduces an intermediate level of processing, between the MNL and the 11
response stage, that codes numbers into binary categories such as magnitude (i.e., small vs. 12
large), parity (i.e., odd vs. even) or other dichotomous features of the stimulus. As the name 13
suggests, this model includes two routes of parallel information processing. The unconditional 14
route codes numbers based on their magnitude and is automatically activated regardless of 15
the task requirements. This route activates the long-term preexisting links between magnitude 16
and space coordinates, that is the associations small–left and large–right. The conditional 17
route codes numbers into a binary category based on task-specific requirements. It activates 18
short-term links between numbers and an arbitrary mapping based on task requirements, such 19
as small–right and large–left (for magnitude) or odd–right and even–left (for parity). The 20
SNARC effect emerges from the congruence, or lack of it, between the response sides 21
activated by the two routes. On the one hand, the conditional route activates a response side 22
based on task-specific mapping. On the other hand, the unconditional route can cooperate or 23
compete to activate the same or the opposite response side, respectively. If the task-related 24
mapping is consistent with the long-term number-space links the two routes cooperate, 25
otherwise they converge on opposite spatial response codes. The response selection process 26
takes longer and response latency is slower when the routes diverge and this generates the 27
SNARC effect. Since both routes are always simultaneously activated independent of the task, 28
the level of semantic processing required by the task should not influence the SNARC effect. 29
According to the dual-route model, however, the strength of the SNARC effect is influenced by 30
the duration of the number processing (Gevers et al., 2006). Namely, the strength of the 31
SNARC effect would increase along with response latency, because longer latency provides 32
the unconditional route with more time to interfere with response selection. Finally, the model 33
also predicts that in magnitude comparison or classification tasks the SNARC effect takes a 34
step-like shape (Gevers et al., 2006), indicating a categorical decision. In tasks that do not 35
require to evaluate the magnitude of a number (e.g., parity judgement task), the SNARC effect 36
is stronger for the extremes of the numerical interval presented in the experiment and thus it 37
4 takes a linear shape (for a review see Wood et al., 2008; but see Schroeder, Nuerk & Plewnia, 1
2017c). On the other hand, in a magnitude classification task, where the numbers have to be 2
compared to a fixed standard (e.g., the numbers 1 to 9 being classified as smaller or larger 3
than 5), the SNARC effect interacts with the distance effect (i.e., the time required to compared 4
two numbers is inversely proportional to their numerical distance; Moyer & Landauer, 1967; 5
Verguts, Fias, & Stevens, 2005). Therefore, the numbers closer to the standard require more 6
time to be classified and thus the unconditional route has more time to interfere with the 7
response selection. This increases the strength of the SNARC effect for numbers in the center 8
of the interval and thus the effect acquires a categorical rather than linear shape (see figures 9
2 and 3 in Gevers et al., 2006). 10
Both the MNL account and the dual-route model assume that the association between 11
numbers and space coordinates are an intrinsic property of the long-term memory 12
representation of number. The working memory (WM) account instead assumes that no spatial 13
information is co-represented together with numbers and that the long-term representation only 14
includes serial order information (Abrahamse, van Dijck, & Fias, 2016; Fias & van Dijck, 2016; 15
van Dijck & Fias, 2011; van Dijck, Gevers, & Fias, 2009; van Dijck et al., 2012, 2014). The 16
number-space association would emerge from a temporary binding of numbers to a spatially 17
oriented template in working memory. Therefore, the WM account proposes that the SNARC 18
effect is produced by this temporary left-to-right orientation that numbers (considered as verbal 19
items) take only after being transferred to a spatial working memory template. Evidence in 20
favor of the coexistence of long-term space-number associations (i.e., spatially oriented MNL) 21
and temporary associations between space and order position in working memory (Ginsburg 22
& Gevers, 2015; Huber et al., 2016; Schroeder, Nuerk & Plewnia, 2017c) can be reconciled 23
with the WM account working assuming that multiple serially ordered sequences of numbers 24
can be simultaneously activated in working memory (Abrahamse, van Dijck, & Fias, 2016). 25
Reverse SNARC-like effect for ordinal non-numerical sequences (e.g., weekdays) under 26
transcranial direct current stimulation (Schroeder, Nuerk & Plewnia, 2017a) also challenges 27
the WM account, but mixed evidence emerged for such effect (Schroeder, Nuerk & Plewnia, 28
2017b). Since the spatial orientation is not a feature of the long-term memory representation 29
but rather emerges from short-term association in working memory, the level of processing 30
required by the task should not affect the strength of the SNARC effect. Therefore, the WM 31
account also predicts no influence of the amount of semantic processing on the strength of the 32
SNARC effect. 33
If one strictly defines “semantic processing” as reflecting the access to and the manipulation 34
of numerical magnitude, the fact that the SNARC effect was originally discovered in a parity 35
judgement task (Dehaene et al., 1993), which does not require magnitude processing, already 36
suggests that the amount of semantic processing required by the task does not influence the 37
5 strength of this effect. Wood and colleagues’ review (2008), which showed that the size of the 1
SNARC effect in magnitude classification and parity judgement tasks is comparable, also 2
provides evidence for a lack of influence of semantic processing. However, although unrelated 3
with numerical magnitude, parity is actually an intrinsic property of both non-symbolic 4
numerosities (reflecting the possibility to divide a set of objects in two subsets with equal 5
cardinality) and symbolic numbers (reflecting the property of being divisible by 2 with no 6
remainder, in the natural numbers set). Therefore, a parity judgement task requires explicitly 7
to process an abstract semantic (unrelated to magnitude) property of the number. Since in 8
both parity judgement and magnitude classification tasks participants are asked to evaluate an 9
intrinsic property of the number, it is plausible to assume that these two tasks do not allow to 10
clearly disentangle the depth of the semantic processing and thus to measure properly its 11
influence on the SNARC effect. Therefore, to investigate the effect of semantic processing on 12
the SNARC effect, it is more convenient to compare tasks requiring deeper semantic 13
processing (e.g., parity judgement and magnitude classification) with tasks in which response 14
selection is not related to semantic features of the numbers (e.g., color judgement and 15
phoneme detection, see description below). In fact, although to some extent the mere 16
presentation of a number may suffice to automatically activate its semantic representation 17
(Dehaene et al., 1998; Koechlin et al., 1999; Naccache & Dehaene, 2001), the automatic 18
processing of semantic information is not compulsory (Kunde, Kiesel & Hoffmann, 2003; 19
Maxfield, 1997). Therefore, we assumed that tasks requiring to assess non-numerical 20
properties of the stimulus (e.g., color judgement and phoneme detection) will evoke a weaker 21
activation of the semantic representation compared to tasks that directly require the 22
discrimination of magnitude or parity. 23
The present study aimed to evaluate whether and how the amount semantic processing 24
required by a task affects the strength of the SNARC effect, as predicted by the MNL approach. 25
Participants performed two tasks requiring semantic number processing (magnitude 26
classification and parity judgement) and two tasks requiring the discrimination of non-semantic 27
features of the numbers (color judgement and phoneme detection). According to the MNL 28
account, a stronger SNARC effect is expected for the magnitude classification task and parity 29
judgement task compared to the other two tasks. According to the dual-route model, the 30
SNARC effect should be modulated by response latency rather than by the amount of semantic 31
processing. Moreover, this model predicts a categorical shape of the SNARC effect for the 32
magnitude classification task and a linear shape for the other tasks. Finally, similar to the dual-33
route model, the WM account does not predict that tasks requiring deeper semantic processing 34
(magnitude classification and parity judgement) generate a stronger SNARC effect compared 35
to those based on more peripheral features of the numbers (color judgement or phoneme 36
detection). 37
6 Further predictions can also be made on the relationship between the SNARC effects 1
evoked in the different tasks1[DD1]. The MNL account assumes the same origin for the SNARC
2
effect regardless of the task. In fact, independently of the task requirements, a common 3
semantic representation is automatically (or deliberately) activated and interferes with the 4
response selection. Given the common origin of this interference, in addition to the expected 5
relationship between SNARC effect and amount of semantic processing, the MNL account also 6
predicts strong correlations between the strength of this effect in the different tasks. The dual-7
route model, on the other hand, assumes that the SNARC effect originates from the 8
competition/cooperation between two routes of parallel information processing. In other words, 9
in different tasks the unconditional route competes or cooperates with distinct conditional 10
routes, which reflect short-term task-specific mappings. Therefore, the dual-route model does 11
not expressly entail a correlation between the SNARC effects of the different tasks. The WM 12
account assumes that the SNARC effect emerges from the temporary spatial orientation that 13
numbers acquire after being loaded in a working memory template. The binding of numbers to 14
this spatial template is both context- and task-specific. Therefore, similar to the dual-route 15
model, the WM account also does not expressly entail a correlation between the SNARC 16
effects evoked by the different tasks. 17 18 19 2. METHOD 20 21 2.1. Participants 22
Thirty-two German-speaking participants took part in the study (22 female; mean age (SD) 23
= 26.7 (4.4), range = 18–35). All participants had normal or corrected-to-normal vision and 24
gave informed consent to participate for course credits or 8€. All participants were right-handed 25
and had no experience with right-to-left writing/reading languages. The study was approved 26
by the Ethics committee at the Department of Psychology of Humboldt-Universität zu Berlin 27
(Nr. 2017–29). 28
29
2.2. Materials, tasks and design
30
The same set of numbers (Arabic digits ranging from 1 to 9, excluding 5) was used in all 31
tasks. Each participant performed four tasks. In the magnitude classification task, participants 32
were asked to decide if the presented number was smaller or larger than the fixed standard 5. 33
In the parity judgement task, were asked to judge if the number was even or odd. In the color 34
judgement task, participants classified the color of the font: numbers 2, 3, 6 and 8 were always
35
printed in red (RGB: 255, 0, 0) and numbers 1, 4, 7 and 9 always in green (RGB: 0, 255, 0). In 36
7 the phoneme detection task, participants decided whether or not any of the phonemes /s/, /z/ 1
and /ʦ/ was included in the German number word corresponding to the presented Arabic digit 2
(for a similar task see Fias, 2001; Fias et al., 1996). This rule was selected to create an arbitrary 3
mapping (i.e., not related to semantic features) between numbers and response sides. 4
Therefore, numbers were divided into two groups based on the presence (1 = /aɪ̯ns/, 2 = /ʦvaɪ̯/, 5
6 = /zɛks/, 7 = /ziːbn̩/) or the absence (3 = /dʀaɪ̯/, 4 = /fiːɐ̯/, 8 = /aχt/, 9 = /nɔɪ̯n/) of these 6
phonemes. Participants were explicitly instructed to base their decision on the phonological 7
feature and ignore the orthography of the word. 8
Four task sequences were created using the following rules: (1) each task must be 9
presented in each position of the sequence only once; (2) each task can follow the other tasks 10
only once. The four sequences were: Magnitude-Color-Phonology; Parity-11
Magnitude-Phonology-Color; Phonology-Parity-Color-Magnitude; Color-Phonology-12
Magnitude-Parity. Each sequence was administered to 8 participants. Each task included two 13
blocks, in which the response mapping was reversed (Table 1). Fifteen participants started all 14
tasks with the response mapping A and 17 participants with the response mapping B (the 15
sample size in the two groups is not equal because of a technical problem). In total, participants 16
performed 8 blocks (4 tasks × 2 response mappings). Following the recommendations of 17
Cipora and Wood (2017), in each block each number was repeated 20 times. Numbers were 18
pseudo-randomly presented with the constraint that the same digit could not be presented on 19
two consecutive trials. Sixteen practice trials preceded each block (each number presented 20
twice in a randomized order) to familiarize with the block-specific response mapping and 21
feedback was provided (no feedback was presented during the test blocks). 22
23
Table 1. The two response mappings used in the tasks. Response mappings A and B
24
were presented in two different blocks in counterbalanced order across participants.
25
Response
mapping Left key Right key
Magnitude task A 1 2 3 4 6 7 8 9 B 6 7 8 9 1 2 3 4 Parity task A 1 3 7 9 2 4 6 8 B 2 4 6 8 1 3 7 9 Phonological task A 1 2 6 7 3 4 8 9 B 3 4 8 9 1 2 6 7 Color task A 2 3 6 8 1 4 7 9 B 1 4 7 9 2 3 6 8 26 2.3. Procedure 27
The same procedure was used in all tasks. Stimulus presentation and response collection 28
were implemented in Matlab, using the Psychophysics Toolbox (Brainard, 1997; Pelli, 1997). 29
Stimuli were presented in the center of the monitor and were 22 mm high and 15 mm wide. 30
Participants sat at approximately 50 cm from the monitor (visual angle: 2.5° × 1.7°). 31
8 Each trial started with a fixation mark (#) presented for 600 ms, followed by an Arabic 1
number, which remained on the screen until the response or for 1300 ms. Participants were 2
instructed to press a key on the left (“left-control” with the left-hand) or right (“enter” on the 3
numpad with the right-hand) side of the keyboard according to the block-specific response 4
mapping (Table 1). The two keys were approximately 40 cm apart. Following the offset of the 5
presented number, the next trial began after an intertrial-interval of 500 ms consisting of a 6
black screen. All stimuli were printed in white against a black background, except for numbers 7
in the color judgement which could be red (RGB: 255,0,0; numbers 2, 3, 6 and 8) or green 8
(RGB: 0. 255, 0; 1, 4, 7, 9). 9
Since participants had to perform eight blocks with different response mappings, a small 10
sheet showing the response mapping was placed under the monitor to help them to remember 11
the block-specific instructions. Participants were asked to respond as fast and accurately as 12 possible. 13 14 15 3. RESULTS 16 17
All analyses[DD2] were performed using R-project software (R Core Team, 2015) and 18
RStudio software (RStudio Team, 2015). Participants had a very high accuracy in all tasks 19
(magnitude classification: mean = 0.97, SD = 0.03, range = 0.82–1.0; parity judgement: mean 20
= 0.95, SD = 0.03, range = 0.87–0.99; color discrimination: mean = 0.97, SD = 0.03, range = 21
0.88–0.997; phoneme detection: mean = 0.94, SD = 0.04, range = 0.84–0.99). Accuracy data 22
are likely affected by a ceiling effect and thus will not be further analyzed. 23
Trials with incorrect responses and with reaction times (RTs) shorter than 200 ms (N = 9) 24
were excluded from the analyses. For each participant and task combination, trials with RT 25
more than 2.5 SD from the participant’s mean were considered outliers and excluded from the 26
analysis (2.9% of the trials). A preliminary analysis on RTs showed that the order of the tasks 27
was not significant and did not interact with other variables. Therefore, order was excluded 28
from the following analyses. All ANOVAs were Greenhouse-Geisser corrected (Greenhouse & 29
Geisser, 1959) when the assumption of sphericity was violated; uncorrected degrees of 30
freedom and epsilon values (εGG) are reported. Effect sizes are reported following the 31
recommendation of Lakens (2013). 32
We also calculated the dRT as mean RTs for the right hand minus mean RTs for the left 33
hand, separately for each target number, task, and participant (see Fias et al., 1996; see also 34
Pinhas, Tzelgov, & Ganor-Stern, 2012; Tzelgov, Zohar-Shai, & Nuerk, 2013). The dRTs were 35
analyzed by means of a regression model: dRT ~ 𝛽𝛽0+ 𝛽𝛽1× Number (Fias et al., 1996). The 36
9 slope (𝛽𝛽1) was interpreted as a measure of the SNARC effect: larger negative values 1
correspond to a stronger effect. 2
3
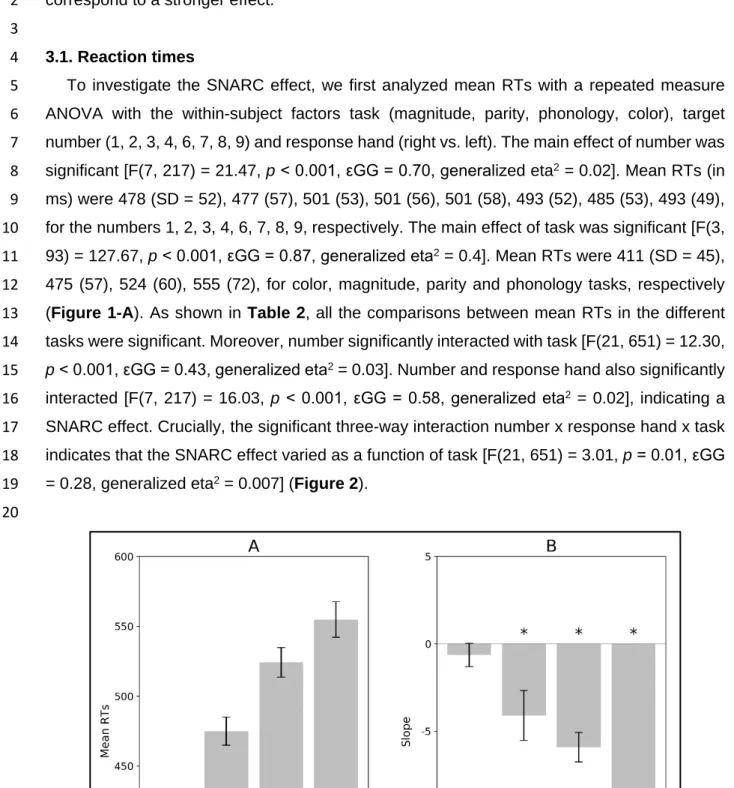
3.1. Reaction times
4
To investigate the SNARC effect, we first analyzed mean RTs with a repeated measure 5
ANOVA with the within-subject factors task (magnitude, parity, phonology, color), target 6
number (1, 2, 3, 4, 6, 7, 8, 9) and response hand (right vs. left). The main effect of number was 7
significant [F(7, 217) = 21.47, p < 0.001, εGG = 0.70, generalized eta2 = 0.02]. Mean RTs (in
8
ms) were 478 (SD = 52), 477 (57), 501 (53), 501 (56), 501 (58), 493 (52), 485 (53), 493 (49), 9
for the numbers 1, 2, 3, 4, 6, 7, 8, 9, respectively. The main effect of task was significant [F(3, 10
93) = 127.67, p < 0.001, εGG = 0.87, generalized eta2 = 0.4]. Mean RTs were 411 (SD = 45),
11
475 (57), 524 (60), 555 (72), for color, magnitude, parity and phonology tasks, respectively 12
(Figure 1-A). As shown in Table 2, all the comparisons between mean RTs in the different 13
tasks were significant. Moreover, number significantly interacted with task [F(21, 651) = 12.30, 14
p < 0.001, εGG = 0.43, generalized eta2 = 0.03].Number and response hand also significantly
15
interacted [F(7, 217) = 16.03, p < 0.001, εGG = 0.58, generalized eta2 = 0.02], indicating a
16
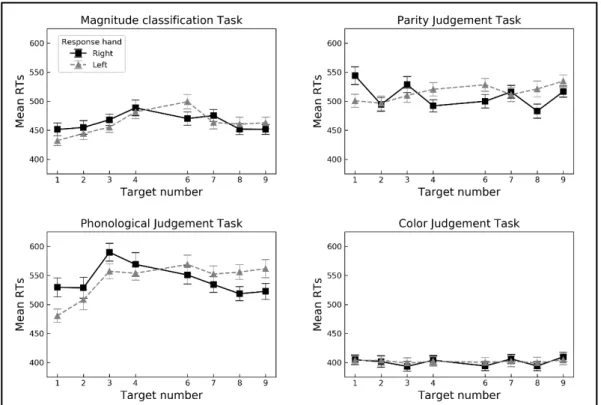
SNARC effect. Crucially, the significant three-way interaction number x response hand x task 17
indicates that the SNARC effect varied as a function of task [F(21, 651) = 3.01, p = 0.01, εGG 18
= 0.28, generalized eta2 = 0.007] (Figure 2).
19 20
21
Figure 1. Mean RTs (panel A) and mean slopes (panel B) across the tasks. Magnitude: magnitude classification
22
task; Parity: parity judgement task; Phonology: phoneme detection task; Color: color judgement task. Error bars
23
represent the standard error of the mean. Mean RTs of the tasks are all significantly different from each other (all
10 ps < 0.001). Except for the difference between magnitude and parity, all the other mean slopes are significantly 1
different from each other (all ps < 0.05). In panel B, asterisks indicate that the mean slope is significantly different
2
from zero (all ps < 0.05).
3 4 5
Table 2. T-tests (one-tailed) comparing the tasks (slope and RTs) against each other and assessing whether
6
the slope distributions were different from zero.
7
Tasks Mean SD t df p-value Cohen’s dz Hedges gav
Reaction times Magnitude vs. Parity ‒ ‒ −8.97 31 < 0.001 1.58 0.82 Magnitude vs. Phonology ‒ ‒ −9.86 31 < 0.001 1.74 1.19 Magnitude vs. Color ‒ ‒ 8.33 31 < 0.001 1.47 1.20 Parity vs. Phonology ‒ ‒ −3.62 31 0.01 0.64 0.44 Parity vs. Color ‒ ‒ 14.41 31 < 0.001 2.55 2.08 Phonology vs. Color ‒ ‒ 15.41 31 < 0.001 2.72 2.33 Slopes Magnitude −4.11 8.10 −2.87 31 0.018 0.51 0.70 Parity −5.92 4.79 −6.98 31 < 0.001 1.23 1.70 Phonology −10.07 8.95 −6.36 31 < 0.001 1.12 1.55 Color −0.64 3.75 −0.97 31 0.273 0.17 0.24 Magnitude vs. Parity ‒ ‒ 1.12 31 0.273 0.20 0.27 Magnitude vs. Phonology ‒ ‒ 3.75 31 0.002 0.66 0.68 Magnitude vs. Color ‒ ‒ −2.47 31 0.029 0.44 0.54 Parity vs. Phonology ‒ ‒ 2.59 31 0.029 0.46 0.56 Parity vs. Color ‒ ‒ −4.90 31 < 0.001 0.87 1.20 Phonology vs. Color ‒ ‒ −5.89 31 < 0.001 1.04 1.34
All p-values have been corrected with Holm’s method. For the calculation of the effect sizes (Cohen’s dz and
8
Hedges gav) refers to Lakens (2013).
9 10 11
12
Figure 2. Mean RTs across numbers as a function of response hand (right-hand in black, left-hand in grey),
13
separately for each task. Error bars represent the standard error of the mean.
14 15 16
11
3.2. Slopes
1
To further investigate how the SNARC effect varies in the different tasks2, the slope3 was
2
analyzed with a repeated measures ANOVA with task (magnitude, parity, phonology, color) as 3
within-subject factor. Slope was significantly influenced by task [F(3, 93) = 13.78, p < 0.001, 4
εGG = 0.87, generalized eta2 = 0.21] (Figure 1-B). Two sets of t-tests were performed to further
5
explore the effect of task on slope (Table 2). First, one-sample t-tests, separately computed 6
for each task, were used to assess whether the slope distributions were significantly less than 7
zero. As shown in Figure 1-B and Table 2, the slopes for the magnitude classification task, 8
the parity judgement task, and the phoneme detection task were significantly different from 9
zero. The slope distribution for the color judgement task was not significantly different from 10
zero, suggesting the absence of a SNARC effect. 11
Second, two-sample t-tests were used to compare the slope distributions for the different 12
tasks. Except for the magnitude vs. parity comparison, all comparisons were significant (Table 13
2). These results confirm that there was no SNARC effect for the color judgement task, a
14
medium effect for the magnitude classification and the parity judgement tasks, and the 15
strongest effect for the phoneme detection task. It is worth noting that the pattern of results for 16
the slopes (i.e., the strength of the SNARC effect) mirrors the RT distributions (see panels A 17
and B in Figure 1). The similarity between the results of RTs and of slopes suggests that the 18
SNARC effect is due to the differences in latency rather than to the level of semantic 19
processing. This is also suggested by the unexpected pattern in the slopes: the phoneme 20
detection showed the strongest SNARC effect and the magnitude classification and parity 21
judgement tasks a smaller effect (Figure 1-B). The relationship between the slope distributions 22
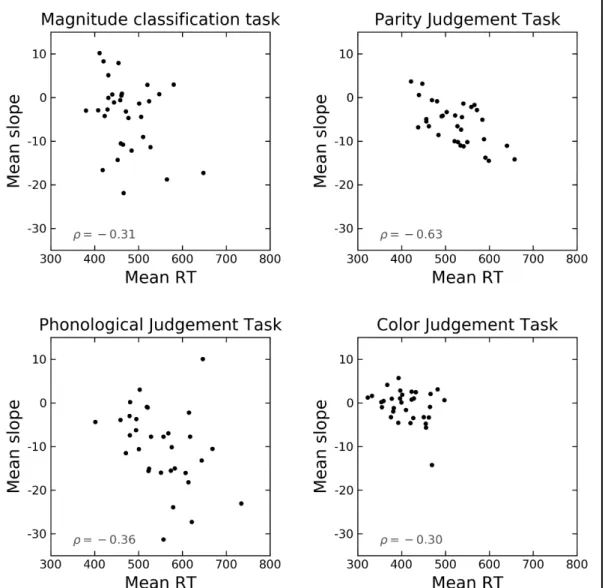
of the different tasks were further investigated with Pearson's correlation coefficient (Table 3 23
and Figure 3). In line with previous studies (ρ = 0.08 in Georges, Hoffmann, & Schiltz, 2017 24
and ρ = 0.2 in Georges, Hoffmann, & Schiltz, 2018), the magnitude classification and the parity 25
judgement tasks did not correlate. The only significant positive correlation emerged between 26
the magnitude classification and phoneme detection tasks. Although this correlation is 27
2 Split-half reliability was computed for each task. Trials were odd-even half-split based on the order of
appearance, separately for each participant, block (response mapping A vs. B) and relevant category (i.e., magnitude classification task: smaller vs. larger than 5; parity judgement task: even vs. odd; phoneme detection task: with vs. without the phonemes; color judgement task: red vs. green). Then, the participant’s slope was calculated for each of the two halves. Finally, the Pearson correlation coefficients (𝑟𝑟𝑆𝑆) between the slopes of the
two halves of each task were calculated and corrected with the Spearman-Brown formula: 𝑟𝑟𝑆𝑆𝑆𝑆= 2𝑟𝑟𝑆𝑆⁄(1 + 𝑟𝑟𝑆𝑆).
The Spearman-Brown corrected correlation coefficients were: rSB = 0.86 for the magnitude classification task; rSB
= 0.83 for the parity judgement task; rSB = 0.79 for the phoneme detection task; rSB = 0.58 for the color judgement
task. These coefficients are comparable to or higher than those reported in previous studies (Cipora & Nuerk, 2013; Georges, Hoffmann & Schiltz, 2017, 2018). These results indicated excellent reliability for the magnitude classification task, the parity judgement task and the phoneme detection task, and poor reliability for the color judgement task, which may be due to the absence of a SNARC effect for this task.
12 consistent with the MNL account, it does not fully support the expected strong correlations 1
between the SNARC effects. 2
3
Table 3. Pearson’s correlation coefficients between slope distributions of the four tasks
4
(below the diagonal) and between slope and RT distributions (the diagonal).
5
Magnitude Parity Phonology Color
Magnitude −0.31 + (−0.59, 0.04) – – – Parity (−0.30, 0.40) 0.06 (−0.80, −0.36) −0.63* Phonology 0.45* (0.12, 0.69) 0.24 (−0.11, 0.55) (−0.63, −0.02) −0.36* Color (−0.09, 0.57) 0.27 (−0.35, 0.35) −0.002 (−0.18, 0.50) 0.18 −0.30 + (−0.60, 0.06) The 95% confidence intervals are presented in parentheses. + p < 0.1, * p <0.05.
6 7
8
Figure 3. Scatter plots of the correlation between the SNARC effects of the four tasks. Dots represent the
9
participant’s mean slope. Magnitude: magnitude classification task; Parity: parity judgement task; Phonology:
10
phoneme detection task; Color: color judgement task. Pearson’s correlation coefficients (ρ) are reported in the upper
11
right corner.
12 13
13 1
Figure 4. Mean slopes across tasks and bins as a function of RTs. Magnitude: magnitude classification task; Parity:
2
parity judgement task; Phonology: phoneme detection task; Color: color judgement task. For each task, the mean
3
slopes of the four bins are presented: from fastest RTs (leftmost point) to slowest RTs (rightmost point). Error bars
4
represent the standard error of the mean.
5 6
The absence of a SNARC effect for the color judgement task may be due to either the very 7
short RTs (i.e., the number processing did not have time to interfere with the response 8
selection) or the fact that a minimum number processing is required in order to produce the 9
SNARC effect and in this task numbers do not reach a sufficient level of processing. To further 10
investigate this possibility, for each participant and task, RTs were rank ordered and divided 11
into 4 bins (Gevers et al., 2006; Ratcliff, 1979). In each bin, slopes were recalculated following 12
the same procedure described above. Figure 4 shows the mean slope distributions across 13
tasks and the bins as a function of RTs and Table 4 reports mean RTs, mean slopes and one-14
sample t-tests assessing whether the slope distributions were significantly less than zero, 15
separately computed for each bin and task. For the parity judgement tasks and the phoneme 16
detection task, a robust SNARC effect emerged in all the bins. The magnitude classification 17
task showed a SNARC effect only in the two slowest bins, a tendency in bin 2 and no effect 18
for the fastest RTs. For the color judgement task, a tendency toward significance emerged only 19
for the bin with longest RTs. All the tasks showed the same patters: mean slope and effect 20
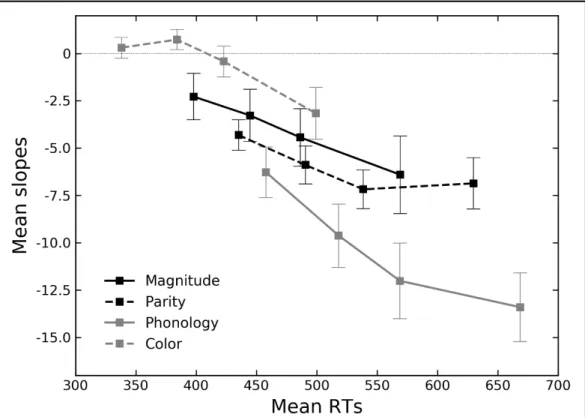
size increased along with response latency. To confirm this pattern, for each task, repeated 21
measure correlation coefficients (Bakdash & Marusich, 2017, 2018) were calculated between 22
mean slopes and mean RTs. All tasks showed a significant negative correlation between slope 23
and response latency: r = −0.48 (95% confidence interval = −0.62, −0.30; p < 0.001) for the 24
14 magnitude classification task; r = −0.32 (95% CI = −0.49, −0.13; p < 0.01) for the parity 1
judgement task; r = −0.55 (95% CI = −0.68, −0.40; p < 0.001) for the phoneme detection task; 2
r = −0.46 (95% CI = −0.61, −0.28; p < 0.001) for the color judgement task. Furthermore, a 3
negative correlation also emerged between the overall mean slopes and overall mean RTs 4
(Table 3 and Figure 5). In fact, both parity judgement and phoneme detection tasks showed 5
a significant negative correlation between overall mean slopes and overall mean RTs, and 6
magnitude classification and color judgement tasks showed a tendency for a negative 7
correlation. These negative correlations further support the idea that the SNARC effect 8
increases along with response latency. 9
10
Table 4. Statistics for the four bins and t-tests assessing whether the slopes differed from zero.
11
Bins Mean RTs (SD) Mean slope (SD) t df p-value Cohen’s dz Hedges gav
Magnitude Bin 1 398 (46) −2.28 (6.95) −1.86 31 > 0.1 0.33 0.45 Bin 2 445 (53) −3.27 (7.83) −2.37 31 0.073 0.42 0.58 Bin 3 486 (60) −4.44 (8.59) −2.92 31 0.022 0.52 0.71 Bin 4 569 (77) −6.41 (11.55) −3.14 31 0.015 0.55 0.77 Parity Bin 1 435 (47) −4.32 (4.56) −5.35 31 < 0.001 0.95 1.31 Bin 2 491 (55) −5.89 (5.65) −5.90 31 < 0.001 1.04 1.44 Bin 3 538 (61) −7.18 (5.74) −7.07 31 < 0.001 1.25 1.72 Bin 4 630 (80) −6.86 (7.69) −5.05 31 < 0.001 0.89 1.23 Phonology Bin 1 458 (56) −6.28 (7.59) −4.68 31 < 0.001 0.83 1.14 Bin 2 518 (66) −9.62 (9.45) −5.76 31 < 0.001 1.02 1.41 Bin 3 569 (76) −12.01 (11.27) −6.03 31 < 0.001 1.07 1.47 Bin 4 668 (92) −13.40 (10.27) −7.39 31 < 0.001 1.31 1.80 Color Bin 1 338 (37) 0.31 (3.10) 0.56 31 > 0.1 0.10 0.14 Bin 2 384 (40) 0.73 (3.04) 1.36 31 > 0.1 0.24 0.33 Bin 3 423 (45) −0.42 (4.59) −0.52 31 > 0.1 0.09 0.13 Bin 4 499 (61) −3.16 (7.78) −2.30 31 0.073 0.41 0.56
All p-values have been corrected with Holm’s method. For the calculation of the effect sizes (Cohen’s dz and
12
Hedges gav) refers to Lakens (2013).
13 14 15
15 1
Figure 5. Scatter plots of the correlation between the SNARC effects (mean slope) and response latency (mean
2
RT) in the four tasks. Dots represent the participant’s mean slope and RT. Pearson’s correlation coefficients (ρ) are
3
reported in the bottom left corner.
4 5
3.3. Shape of the SNARC effect
6
According to the dual-route account (Gevers et al., 2006), the SNARC effect should have a 7
categorical shape in the magnitude classification task and a linear shape in the other tasks. To 8
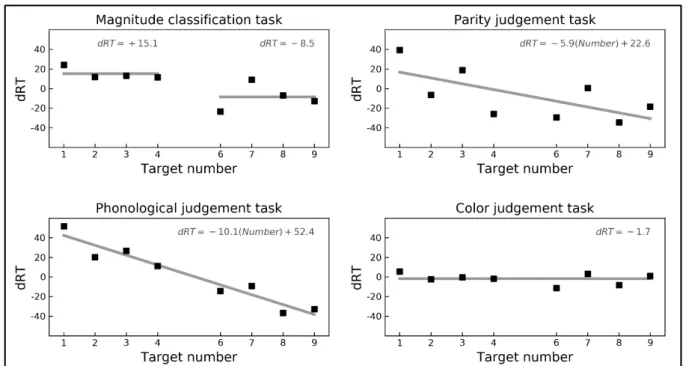
test this prediction, we assessed whether mean dRTs were best fitted by a categorical predictor 9
or a continuous predictor (for a similar analysis see, for example, Gevers et al., 2006). For 10
each task, we performed a stepwise linear regression analysis (by AIC, with both forward and 11
backward selection method) with mean dRT as dependent variable and two variables entered 12
in the model as possible predictors: a categorical predictor (a binary variable with the values 1 13
= “smaller than 5” and 2 = “larger than 5”) and a continuous predictor (a continuous variable 14
with the values 1‒9, excluding 5). Mean dRTs were calculated aggregating across participants. 15
Table 65 reports the models with the variables selected by the analysis. As expected according 16
to the dual-route account, for the magnitude classification task the categorical predictor was 17
16 selected by the analysis, whereas for the parity judgement task and the phoneme detection 1
task the continuous predictor provided the best fit (Figure 6). Due to the lack of a SNARC 2
effect, no predictor was selected for the color judgement task (Figure 6). 3
4
Table 45. Results of the stepwise linear regression analysis.
5
Selected predictor β SE t p-value Adj. R2
Magnitude classification task 0.57
Intercept 15.14 5.23 2.90 0.028
Categorical −23.59 7.39 −3.19 0.019
Parity judgement task 0.37
Intercept 22.61 15.02 1.51 0.183
Continuous −5.92 2.63 −2.25 0.066
Phoneme detection task 0.91
Intercept 52.41 6.58 7.96 < 0.001
Continuous −10.07 1.15 −8.72 < 0.001
Color judgement task ‒
Intercept −1.73 2.00 −0.87 0.415
6 7
8
Figure 6. Mean dRTs across numbers, separately for each task. Gray lines represent the model selected in the
9
stepwise analysis: a categorical predictor for the magnitude task; a continuous predictor for the parity and phonology
10
tasks; a model with only intercept for the color task. Above each line, the corresponding model is reported.
11 12 13 4. DISCUSSION 14 15
The present study aimed to investigate whether the strength of the SNARC effect is 16
influenced by the amount of semantic number processing required by a task. Participants 17
performed two tasks requiring deep semantic number processing (magnitude classification 18
task and parity judgement task) and two tasks requiring to evaluate non-semantic features of 19
17 the numbers (color judgement task and phoneme detection task). Results do not provide 1
evidence for the idea that the level of semantic processing influences the SNARC effect. 2
Conversely, the strength of the SNARC effect was proportional to the overall RTs (the slower 3
the RT, the larger the effect, see Figure 1), suggesting that response latency is the main factor 4
that affects the strength of the SNARC effect. The phoneme detection task had both the longest 5
RTs and the strongest SNARC effect (mean RTs: 555 ms, mean slope: −10.07). The 6
magnitude classification task (mean RTs: 475 ms, mean slope: −4.11) and the parity 7
judgement task (mean RTs: 524 ms, mean slope: −5.92) had faster RTs and showed a weaker 8
SNARC effect of comparable size. The color judgement task had the fastest RTs and showed 9
no evidence of a SNARC effect (mean RTs: 411 ms, mean slope: −0.64). The influence of 10
response latency was also confirmed by the analysis on the rank ordered RTs, which showed 11
that the strength of the SNARC effect was proportional to RTs. In fact, the color judgement 12
task showed a tendency toward significance when the slowest RTs were analyzed (bin 4, mean 13
RTs: 490 ms, mean slope: −3.16) and there was no evidence of a SNARC effect for the fastest 14
RTs of the magnitude classification task (bin 1, mean RTs: 398 ms, mean slope: −2.28). The 15
overall slopes also negatively correlated with overall RTs in the parity judgement and phoneme 16
detection tasks and a tendency emerged in the magnitude classification and color judgement 17
tasks. Although the correlation analyses reported in this paper may be affected by the low 18
sample size (N = 32), they are consistent with those reported by Cipora and colleagues (2019), 19
who analyzed the results from a massive sample (N > 1,000) in an online assessment of the 20
SNARC effect in a parity judgement task and found a negative correlation between slope and 21
RT. Considering the relationship between the SNARC effects evoked by the four tasks, a 22
positive correlation (ρ = 0.45) between slopes emerged only for the magnitude classification 23
and phoneme detection tasks. Finally, the analysis of the shape of the SNARC effect showed 24
that the dRTs of the magnitude classification task were best fit by a categorical predictor, while 25
those of the parity judgement task and phoneme detection task by a continuous predictor. 26
The MNL account explains the SNARC effect as the result of the association between 27
response locations (left vs. right) and the position of numbers on their spatially oriented 28
representation (small/large numbers on the left/right, respectively) (Dehaene et al., 1993; 29
Hubbard et al., 2005). Therefore, this account predicts that the deeper the access to the MNL, 30
the stronger the influence of the spatial organization of this mental representation should be. 31
Namely, tasks associated with deeper semantic processing (magnitude classification task and 32
parity judgement task) should show a stronger SNARC effect compared to tasks requiring no 33
semantic processing (phoneme detection task and color judgement task). In the latter two 34
tasks, the MNL is thought to be automatically activated (Dehaene et al., 1993; Nuerk, Wood, 35
& Willmes, 2005) and thus the space-number association should, to some extent, generate a 36
SNARC effect. However, it should be smaller in size compared to tasks that explicitly require 37
18 the processing of semantic aspects of numbers. Our results clearly point in another direction. 1
In fact, not only is the strength of the SNARC effect not proportional to the amount of semantic 2
processing, but also the pattern that emerges (i.e., phoneme detection > parity ≈ magnitude > 3
color) cannot be explained by the MNL account. Consistent with a growing amount of evidence 4
showing that the SNARC effect is much more flexible than one would expect under the 5
hypothesis that it is generated from a long-term memory representation (Bächtold et al., 1998; 6
Fias & van Dijck, 2016; Fias et al., 1996; Georges, Hoffmann, & Schiltz, 2017, 2018; Shaki & 7
Fisher, 2008, 2018; van Dijck & Fias, 2011), our results provide additional empirical evidence 8
that the MNL account cannot adequately explain. 9
The dual-route model explains the SNARC effect as the result of the 10
competition/cooperation between two parallel information processing streams (Gevers et al., 11
2006, 2010; Santens & Gevers, 2008). Since both the unconditional route (i.e., an automatic, 12
long-term space-number mapping) and a conditional route (i.e., an arbitrary task-specific 13
mapping) are always simultaneously activated (Gevers et al., 2006), the SNARC effect should 14
not be affected by the amount of semantic processing required by the task. However, the 15
interference of the unconditional route increases along with response latency, predicting a 16
stronger SNARC effect for longer RTs. Our results provide evidence for this model, showing 17
that the strength of the SNARC effect was influenced by response latency, whereas the amount 18
of semantic processing required by a task had negligible influence. The significant negative 19
correlations between slopes and both overall RTs (Figure 5) and rank ordered RTs (Figure 4) 20
also support the idea that the SNARC effect is mainly influenced by response latency. Our 21
findings are not consistent with the conclusions by Wood and colleagues (2008). In fact, the 22
authors found that “in tasks involving semantic number processing such as parity decision 23
task, the SNARC effect tended to be larger than in non-semantic tasks” (Wood et al., 2008, p.
24
500). This inconsistency might be due to the fact that we compared the SNARC effect of 25
different tasks in a within-participant design, whereas Wood and colleagues compared different 26
samples. To disentangle the influence of semantic processing and response latency on the 27
SNARC effect, future studies could manipulate the difficulty (and thus RTs) of the task and 28
evaluate whether the SNARC effect increases proportionally to RTs. 29
According to the MNL account, the SNARC effect originates from a common long-term 30
memory representation regardless of task requirements. Given this common origin, one would 31
expect to observe a strong correlation between the SNARC effects of the different tasks. 32
However, a correlation emerged only between the slopes of the magnitude and phonology 33
tasks (Figure 3). Moreover, the two tasks associated with deep semantic processing 34
(magnitude classification and parity judgement tasks) did not correlate at all (ρ = 0.06). The 35
lack of strong correlations is however consistent with the dual-route model and the WM 36
account. The dual-route model assumes that a parallel information processing, which may 37
19 result in competition or cooperation, occurs between the unconditional route and a task-1
specific conditional route. Therefore, the interaction between the two routes may vary with 2
different tasks and thus produce uncorrelated SNARC effects. The WM account assumes that 3
the SNARC effect is the result of a temporary binding of numbers to a spatial working memory 4
template. Since the spatial orientation of the number sequence is context- and task-specific, 5
this account is also consistent with uncorrelated SNARC effects. However, it is also possible 6
that the lack of correlation depends on the current sample size and thus this result calls for 7
caution. Future studies with a larger sample size should confirm or reject this result. 8
The absence of a SNARC effect in the color judgement task might be explained assuming 9
that the decision was made before the automatic activation of the MNL could interfere with the 10
response selection. It is certainly true that this task presents a confound between response 11
latency and amount of semantic processing, inasmuch very fast RTs were combined with a 12
decision process that could be performed without processing the Arabic numerals. Two 13
objections can be made against this argument. First, it is well-established that it is virtually 14
impossible to avoid processing written words or symbols. The color-stroop task is the most 15
prominent example amongst many others. Hence, we do not think that it is valid to assume 16
that the number symbol was not processed at all in the color task. Second, However, this 17
confound is absent in the other tasks. In fact, the phoneme detection task presented the 18
longest response latencies but required no semantic processing; whereas the magnitude 19
classification and parity judgement task had halfway response latencies but required deep 20
semantic processing. Therefore, the MNL account would predict a stronger SNARC effect in 21
the phoneme detection task compared to the color judgement task, because the longer RTs of 22
the former would provide the spatial orientation of the MNL with enough time to interfere with 23
the response selection. However, the highest interference (strongest SNARC effect) is 24
expected in the magnitude task, given that the semantic representation at the origin of the 25
SNARC effect is also the reference frame for the response selection. In fact, the activation of 26
the number on the sematic representation is required to classify the stimulus magnitude. Given 27
the absence of a confound between amount of semantic processing and response latency in 28
the magnitude classification and phoneme detection tasks, the overall results support the idea 29
that the SNARC effect is modulated by response latency rather than semantic processing. 30
However, future studies should further investigate the confound present introduced byin the 31
color judgement task by for example manipulating the processing of the target number. For 32
example, in a go/no-go color judgement task, where participants are asked to discriminate the 33
color only for a specific subset of the number range (e.g., go trials: 1, 4, 6, 9). 34
We interpreted our results as evidence in favor of the dual-route model. However, is there 35
an alternative interpretation that would allow to explain these results within the MNL 36
framework? In principle the answer is yes. In fact, along with the idea that the deeper the 37
20 semantic processing required by a task, the stronger the in interference from the spatial 1
orientation of the MNL is,; one could also assume that this interference increases proportionally 2
to response latency. Similar to what follows fromproposed for the dual-route model, the longer 3
the decision process takes, the higher the chance for the spatial orientation of the MNL to 4
interfere with the response selection is. Although this seems a plausible explanation, we 5
believe that our results do not support this interpretation. The MNL account and the dual-route 6
model make divergent predictions for the relationship between the SNARC effect and the rank 7
ordered RTs in the bin analysis. If one assumes that the interference of the semantic 8
representation increases with the duration of the decision process, the MNL account predicts 9
that the strength of the SNARC effect increases proportionally to the RTs in the parity 10
judgement, phoneme detection and color judgement tasks. This is indeed consistent to what 11
we observed in the bin analysis (see Figure 4 and Table 4). On the contrary, for the magnitude 12
classification task, the strength of the SNARC effect should remain constant and not be 13
affected by response latency. In fact, in this task, the semantic representation must be explicitly 14
activated, since it is strictly required to classify the magnitude of the number, and thus its 15
activation level should not be modulated by response latency. However, this prediction is 16
inconsistent with the results of the magnitude classification task: no SNARC effect in bin 1, a 17
tendency in bin 2, and a SNARC effect emerging only in bin 3 and 4 (see Figure 4 and Table 18
4). At this point, it is worth drawing attention to a fundamental difference between the two
19
accounts. Contrary to the MNL account, increasing strength of the SNARC effect with longer 20
response latencies in the magnitude task is an important feature of the dual-route model and 21
explains the shape of the SNARC effect in this task (see Introduction and next paragraph). To 22
sum up, even an alternative interpretation of the MNL account cannot explain the observed 23
relationship between the SNARC effect and the rank ordered RTs. 24
Further evidence in favor of the dual-route model is also provided by the analysis of the 25
shape of the SNARC effect. Consistent with the prediction of this model (Gevers et al., 2006), 26
we found a categorical shape for the SNARC effect in the magnitude classification task and a 27
linear shape for the other tasks. This result is consistent with the meta-analysis of Wood and 28
colleagues (2008), who found that in 60% of the studies included in their review a categorical 29
predictor alone could account for the SNARC effect in the magnitude comparison task. The 30
categorical shape of the SNARC effect in the magnitude classification task also provides 31
further evidence for the idea that response latency has a major impact on this effect. In fact, 32
the categorical shape depends on the fact that the processing of the numbers closer to the 33
fixed standard (i.e., 5) is more time consuming due to the distance effect (Gevers et al., 2006; 34
see also Moyer & Landauer, 1967; Verguts, Fias, & Stevens, 2005). This longer processing 35
provides more time to the unconditional route to interfere with the decision process, and thus 36
generates a stronger SNARC effect for the numbers closer to the fixed standard. 37
21 The WM account assumes that the SNARC effect emerges by the positioning of numbers 1
within a temporary spatial template loaded in working memory (Abrahamse, van Dijck, & Fias, 2
2016; Fias & van Dijck, 2016; van Dijck & Fias, 2011; van Dijck, Gevers, & Fias, 2009; van 3
Dijck et al., 2012, 2014). The space-number association results from the fact that this template 4
is spatially oriented from left to right (small to large numbers). Since the space-number 5
association is not an intrinsic property of the number representation but it is instead temporary 6
temporarily created in working memory (Abrahamse, van Dijck, & Fias, 2016), this account 7
also does not predict that deeper semantic processing generates a stronger SNARC effect. 8
Although this account does not specify whether and how response latency affects the strength 9
of the SNARC effect, it is not incompatible with the results reported in the current study. 10
However, it should be specified which mechanism is responsible for the influence of response 11
latency on the strength of the SNARC effect. The WM account can also explain the categorical 12
shape of the SNARC effect by assuming that the spatial template temporarily loaded in working 13
memory is subject to the distance effect. However, it is worth mentioning that, according to the 14
WM account, the distance effect is generated in working memory, whereas for the dual-route 15
model this effect results from a feature of the long-term memory representation of the numbers 16
(Abrahamse, van Dijck, & Fias, 2016). 17
Despite the very low error rate, the RTs of the phoneme detection task were significantly 18
longer than those of the other tasks. This task required to judge the presence or absence of a 19
group of three phonemes in the number words and thus to transcode the stimulus between 20
two symbolic notations: Arabic to phonological (Nuerk, Moeller, & Willmes, 2015; Silke Göbel 21
et al., 2014). Namely, the visually presented Arabic number had to be transcoded into the 22
internal phonological representation, on which then the search for a specific phoneme could 23
be performed. The phoneme detection task was therefore more demanding compared to the 24
other three tasks and this could explain why this task had the longest RTs and thus the 25
strongest SNARC effect. 26
The tasks investigated in the current study required explicit spatial-directional processing 27
(i.e., response keys were lateralized) and explicit (magnitude classification task) or implicit 28
(parity judgement task, color judgement task, and phoneme detection task) magnitude 29
processing (for a more detailed description of this task classification see Shaki & Fischer, 30
2018). In a recent study, Shaki and Fischer (2018) provided evidence that to some extent the 31
SNARC effect might be an artifact of the procedure used to measure it. In fact, using magnitude 32
classification and parity judgement tasks with go/no-go responses, Shaki and Fischer showed 33
that the horizontal SNARC SNAs requires explicit activation of spatial representation (in 34
stimulus or response code) or explicit magnitude processing. On the other hand, a vertical 35
SNARCs effect emerged also with implicit spatial and magnitude processing. Consistent with 36
our results, Shaki and Fischer’s findings are also difficult to reconcile with the assumption of a 37
22 left-to-right horizontally organized long-term memory representation of numbers. However, the 1
results reported in the current manuscript might be limited to tasks with left/right horizontally 2
distributed response keys. Future studies should investigate whether our results are limited 3
only to tasks that require an explicit spatial-directional processing or whether they are also 4
valid for tasks with implicit spatial processing (e.g., go/no-go responses). 5
In sum, the results reported in the present study suggest that the strength of the SNARC 6
effect is mainly modulated by overall response latencies rather than by the amount of semantic 7
processing required by the tasks. These results are in line with the prediction of the dual-route 8
model and can also be explained within the framework of the WM account. On the other hand, 9
our data provide evidence against the idea that deeper semantic processing generates a 10
stronger SNARC effect, as it would be expected according to the MNL account. 11
12 13 14 15
23
Acknowledgement[DD3] 1
This work was supported by a grant (DI 2361/1-1) from Deutsche Forschungsgemeinschaft 2
(DFG, German Research Council) to Daniele Didino. 3
4 5 6
24
REFERENCES
1 2
Abrahamse, E., van Dijck, J.-P., & Fias, W. (2016). How Does Working Memory Enable 3
Number-Induced Spatial Biases? Frontiers in Psychology, 7, 977. 4
Bächtold, D., Baumüller, M., & Brugger, P. (1998). Stimulus–response compatibility in 5
representational space. Neuropsychologia, 36(8), 731–735 6
Bakdash, J.Z., & Marusich, L.R. (2017). Repeated Measures Correlation. Frontiers in 7
Psychology, 8, 456. doi: 10.3389/fpsyg.2017.00456
8
Bakdash, J.Z., & Marusich, L.R. (2018). rmcorr: Repeated Measures Correlation. R package 9
version 0.3.0. https://CRAN.R-project.org/package=rmcorr 10
Brainard, D. H. (1997). The Psychophysics Toolbox. Spatial vision, 10(4), 443–446. 11
Cipora, K., & Nuerk, H. C. (2013). Is the SNARC effect related to the level of mathematics? No 12
systematic relationship observed despite more power, more repetitions, and more direct 13
assessment of arithmetic skill. The Quarterly Journal of Experimental Psychology, 66(10), 14
1974-1991. doi: 10.1080/17470218.2013.772215 15
Cipora, K., Soltanlou, M., Reips, U.-D., Nuerk, H.-C. (2019). The SNARC and MARC effects 16
measured online: Large-scale assessment methods in flexible cognitive effects. Behavior 17
Research Methods. doi: 10.3758/s13428-019-01213-5
18
Cipora, K., & Wood, G. (2017). Finding the SNARC instead of hunting it: A 20*20 monte carlo 19
investigation. Frontiers in Psychology, 8, 1194. 20
Dehaene, S., Bossini, S., & Giraux, P. (1993). The mental representation of parity and number 21
magnitude. Journal of Experimental Psychology: General, 122(3), 371–396. 22
Dehaene, S., Naccache, L., Le Clec’H, G., Koechlin, E., Mueller, M., Dehaene-Lambertz, G., 23
van de Moortele, P.-F., & Le Bihan, D. (1998). Imaging unconscious semantic priming. 24
Nature, 395(6702), 597–600. doi: 10.1038/26967
25
Fias, W. (2001). Two routes for the processing of verbal numbers: Evidence from the SNARC 26
effect. Psychological Research, 65, 250–259. 27
Fias, W., Brysbaert, M., Geypens, F., & D’Ydewalle, G. (1996). The importance of magnitude 28
information in numerical processing: Evidence from the SNARC effect. Mathematical 29
Cognition, 2(1), 95–110.
30
Fias, W., & van Dijck, J.-P. (2016). The temporary nature of number—space interactions. 31
Canadian Journal of Experimental Psychology, 70(1), 33–40.
32
Fischer, M. H., & Shaki, S. (2014). Spatial associations in numerical cognition – From single 33
digits to arithmetic. Quarterly Journal of Experimental Psychology, 67(8), 1461–1483. 34
Georges, C., Hoffmann, D., & Schiltz, C. (2017). How and why do number-space associations 35
co-vary in implicit and explicit magnitude processing tasks? Journal of Numerical Cognition, 36
3(2), 182–211.
25 Georges, C., Hoffmann, D., & Schiltz, C. (2018). Implicit and explicit number-space 1
associations differentially relate to interference control in young adults with ADHD. Frontiers 2
in Psychology, 9, 775.
3
Gevers, W., Santens, S., Dhooge, E., Chen, Q., Van den Bossche, L., Fias, W., & Verguts, T. 4
(2010). Verbal-spatial and visuospatial coding of number-space interactions. Journal of 5
Experimental Psychology: General, 139(1), 180–90.
6
Gevers, W., Verguts, T., Reynvoet, B., Caessens, B., & Fias, W. (2006). Numbers and space: 7
A computational model of the SNARC effect. Journal of Experimental Psychology: Human 8
Perception and Performance, 32(1), 32–44.
9
Ginsburg, V., and Gevers, W. (2015). Spatial coding of ordinal information in short-and long-10
term memory. Frontiers in Human Neuroscience. 9:8. doi: 10.3389/fnhum.2015.00008 11
Göbel, S. M. (2015). Up or down? Reading direction influences vertical counting direction in 12
the horizontal plane–a cross-cultural comparison. Frontiers in psychology, 6, 228. 13
Göbel, S. M., Maier, C. A., & Shaki, S. (2015). Which numbers do you have in mind? Number 14
generation is influenced by reading direction. Cognitive processing, 16(1), 241–244. 15
Göbel, S. M., Shaki, S., & Fischer, M. H. (2011). The cultural number line: a review of cultural 16
and linguistic influences on the development of number processing. Journal of Cross-17
Cultural Psychology, 42(4), 543–565.
18
Göbel, S. M., Watson, S. E., Lervåg, A., & Hulme, C. (2014). Children’s arithmetic 19
development: It is number knowledge, not the approximate number sense, that counts. 20
Psychological science, 25(3), 789–798.
21
Greenhouse, S. W., and Geisser, S. (1959). On methods in the analysis of profile data. 22
Psychometrika, 24, 95–112.
23
Huber, S., Klein, E., Moeller, K., & Willmes, K. (2016). Spatial-Numerical and ordinal positional 24
associations coexist in parallel. Frontiers in Psychology, 7, 438. doi: 25
10.3389/fpsyg.2016.00438 26
Nuerk, H.-C., Moeller, K., & Willmes, K. (2015). Multi-digit Number Processing: Overview, 27
Conceptual Clarifications, and Language Influences. In Cohen Kadosh, R., & Dowker, A. 28
(Eds.), Oxford library of psychology. The Oxford handbook of numerical cognition, New 29
York, NY, US: Oxford University Press, pp. 106–139. 30
Hubbard, E. M., Piazza, M., Pinel, P., and Dehaene, S. (2005). Interactions between number 31
and space in parietal cortex. Nature Reviews Neuroscience, 6(6), 435–448. 32
Koechlin, E., Nacchache, L., Block, E., & Dehaene, S. (1999). Primed numbers: exploring the 33
modularity of numerical representations with masked and unmasked semantic priming. 34
Journal of Experimental Psychology: Human Perception and Performance, 25(6), 1882–
35
1905. doi: 10.1037/0096-1523.25.6.1882 36
26 Kunde, W., Kiesel, A., & Hoffmann, J. (2003). Conscious control over the content of 1
unconscious cognition. Cognition, 88(2), 223-242. doi:10.1016/S0010-0277(03)00023-4 2
Lakens, D. (2013). Calculating and reporting effect sizes to facilitate cumulative science: a 3
practical primer for t-tests and ANOVAs. Frontiers in psychology, 4, 863. 4
Maxfield, L. (1997). Attention and semantic priming: A review of prime task effects. 5
Consciousness and cognition, 6(2-3), 204-218. doi: 10.1006/ccog.1997.0311
6
Moyer, R. S., & Landauer, T. K. (1967). Time required for judgements of numerical inequality. 7
Nature, 215(5109), 1519–1520.
8
Naccache, L., & Dehaene, S. (2001). Unconscious semantic priming extends to novel unseen 9
stimuli. Cognition, 80(3), 223–237. doi: 10.1016/S0010-0277(00)00139-6 10
Nuerk, H.-C., Wood, G., & Willmes, K. (2005). The universal SNARC effect: The association 11
between number magnitude and space is amodal. Experimental Psychology, 52(3), 187– 12
194. 13
Pelli, D. G. (1997). The VideoToolbox software for visual psychophysics: Transforming 14
numbers into movies. Spatial vision, 10(4), 437–442. 15
Pinhas, M., Tzelgov, J., & Ganor-Stern, D. (2012). Estimating linear effects in ANOVA designs: 16
the easy way. Behavior research methods, 44(3), 788–794. 17
Proctor, R. W., & Cho, Y. S. (2006). Polarity correspondence: A general principle for 18
performance of speeded binary classification tasks. Psychological Bulletin, 132(3), 416– 19
442. 20
R Core Team (2015). R: A language and environment for statistical computing. Vienna: R 21
Foundation for Statistical Computing. 22
Ratcliff, R. (1979). Group reaction time distributions and an analysis of distribution statistics. 23
Psychologican Bulletin, 86(3), 446–461.
24
RStudio Team (2015). RStudio: Integrated development for R. Boston, MA: RStudio, Inc. 25
Santens, S., & Gevers, W. (2008). The SNARC effect does not imply a mental number line. 26
Cognition, 108(1), 263–270.
27
Schroeder, P. A., Nuerk, H. C., & Plewnia, C. (2017a). Prefrontal neuromodulation reverses 28
spatial associations of non-numerical sequences, but not numbers. Biological Psychology, 29
128, 39–49. doi: 10.1016/j.biopsycho.2017.07.008
30
Schroeder, P. A., Nuerk, H. C., & Plewnia, C. (2017b). Switching between multiple codes of 31
SNARC-like associations: Two conceptual replication attempts with anodal tDCS in sham-32
controlled cross-over design. Frontiers in Neuroscience, 11, 654. doi: 33
10.3389/fnins.2017.00654 34
Schroeder, P. A., Nuerk, H. C., & Plewnia, C. (2017c). Space in numerical and ordinal 35
information: A common construct? Journal of Numerical Cognition, 3(2), 164-181. doi: 36
10.5964/jnc.v3i2.40 37