HAL Id: hal-02647715
https://hal.inrae.fr/hal-02647715
Submitted on 29 May 2020
HAL is a multi-disciplinary open access
archive for the deposit and dissemination of
sci-entific research documents, whether they are
pub-lished or not. The documents may come from
teaching and research institutions in France or
abroad, or from public or private research centers.
L’archive ouverte pluridisciplinaire HAL, est
destinée au dépôt et à la diffusion de documents
scientifiques de niveau recherche, publiés ou non,
émanant des établissements d’enseignement et de
recherche français ou étrangers, des laboratoires
publics ou privés.
To cite this version:
Michal Witkowski, Jane Hubert, Andrzej Mazur. Methods of assessment of magnesium status in
humans: a systematic review. Magnesium Research, John Libbey Eurotext, 2011, 24 (4), pp.163-180.
�10.1684/mrh.2011.0292�. �hal-02647715�
Methods of assessment of magnesium
status in humans: a systematic
review
Michał Witkowski, Jane Hubert, Andrzej Mazur
INRA, UMR 1019, UNH, CRNH Auvergne, and Clermont Université, Université d’Auvergne, Unité de Nutrition Humaine, BP 10448, Clermont-Ferrand, 63000, France
Correspondence: Dr A. Mazur, Unité de Nutrition Humaine, INRA, Theix, 63122 St Genès Champanelle, France <andre.mazur@clermont.inra.fr>
Abstract. To understand humans’ requirements for magnesium and the effect of magnesium on health, it is important to identify sensitive and population-specific biomarkers of magnesium status. Thus, we assessed the effectiveness of different magnesium status biomarkers through a systematic review of pub-lished magnesium supplementation and depletion trials in healthy humans. The methods used in this study included a structured search on Ovid MEDLINE, EMBASE (Ovid) and Cochrane databases up to September 2008, followed by the use of formal inclusion/exclusion criteria, data extraction, validity assessment, and meta-analysis. A total of 20 potential biomarkers of magnesium status were assessed from 21 included publications. The majority of studies included were magnesium supplementation studies. Fewer magnesium depletion studies were identified. Available data analysis suggests that serum/plasma magne-sium concentration, red blood cell (RBC) concentration and urinary magnemagne-sium excretion responded to dietary manipulation. For other biomarkers with availa-ble data, it was not possiavaila-ble to draw any conclusions about their usefulness as magnesium status biomarkers. The lack of data prevented detailed subgroup analysis. In conclusion, although limited data were available, serum/plasma magnesium concentration, RBC magnesium concentration and urinary mag-nesium excretion appear to be useful biomarkers of magmag-nesium status in the general population. Further high-quality studies are needed to assess the effec-tiveness of existing and newly developed biomarkers, especially in populations that are vulnerable to magnesium deficiency.
Key words: magnesium, status, systematic review
Magnesium (Mg2+) is the second most
abun-dant cation within the cell. Magnesium plays an essential role in a wide range of fundamen-tal biochemical reactions and cellular functions, including cell cycle, channel regulation, mem-brane and nucleic acid stability and is a cofactor for hundreds of enzymes [1]. Therefore, it is not surprising that many clinical disorders are associated with magnesium deficiency [2, 3]. Recommendations for magnesium intake are pro-This manuscript does not necessarily reflect the views of the Commission of the European Communities and in no way anticipates their future policy in this area.
vided in the “Dietary Reference Intakes (DRIs)” [4] and in the “Apports nutritionnels conseil-lés pour la population franc¸aise (ANC)” [5]. The magnesium content of food in the Western coun-tries is consistently decreasing; currently, dietary magnesium in many adults does not meet the recommended intake [6-11]. This low magne-sium intake leads to an increased risk of latent magnesium deficiency, which is difficult to diag-nose. It is generally accepted that assessments of magnesium status are problematic [12, 13]. The assessment difficulty results from the dis-tribution of magnesium in the body. About half of the total body magnesium is in the bone and
doi:10.1684/mrh.2011.0292
163 To cite this article: Witkowski M, Hubert J, Mazur A. Methods of assessment of magnesium status in humans: a systematic
lar magnesium accounts for only about 1 percent of total body magnesium. Therefore, the measure-ment of blood plasma/serum magnesium does not exactly reflect its intracellular level. In healthy subjects, there is a balance between intesti-nal magnesium absorption and urinary excretion with the latter being of greater importance. Uri-nary excretion increases when magnesium intake is in excess, whereas the increased kidney re-absorption conserves magnesium in the case of magnesium deprivation. Therefore, urine magne-sium reflects magnemagne-sium intake and can provide information on an individual’s magnesium status. However, factors affecting kidney filtration, such as diabetes, diuretics, and renal dialysis, strongly influence urinary magnesium, limiting its value in several pathophysiological conditions. Home-ostasis of magnesium is mainly maintained via bone stores. Approximately one third of magne-sium in bone is freely exchangeable and acts as a reserve for maintaining extracellular magne-sium concentrations [13]. For these magnemagne-sium metabolism-related evidences, extensive research has been conducted on the evaluation of magne-sium in a variety of blood cells and on techniques measuring magnesium concentrations in tissues. Recently published reviews [12, 13] provide an extensive update on the assessment of magnesium status.
The aim of this systematic review is to assess the usefulness of magnesium status biomarkers in healthy humans to determine which biomarkers appropriately reflect changes in magnesium status in response to supplementation or deple-tion. The methodology of this review is based on the standard methodology developed for the set of reviews within the Eurreca project (EURopean micronutrient RECommendations Aligned) (14) and also related to other minerals [15-18].
Methods
An abbreviated version of the methodology used in this review is provided below with differences from the main methodology noted [14].
Study selection
To be included, a study needed to meet all of the following criteria: 1) an intervention study in
humans (including supplementation and/or deple-tion studies) with no restricdeple-tions in study design, including randomised controlled trials (RCTs), controlled clinical trials (CCTs), and before-and-after studies (B/A); 2) report the magnesium status in humans at baseline and after sup-plementation or depletion; 3) report the daily dose of the supplement and involve magnesium supplementation with magnesium salts that are considered bioavailable; and 4) involve healthy participants who had not recently used mineral or vitamin supplements.
Study inclusion was not limited by the age of the participants and included studies of infants through the elderly. Studies were excluded if they included subjects receiving concomitant therapy for chronic illnesses, nutritional deficiencies other than magnesium, or if the studies’ subjects had a condition known to affect magnesium metabolism, such as diabetes, severe kidney diseases, renal dialysis, or alcoholism. Studies were excluded if suitable baseline data were unavailable, if infor-mation on the statistical variance of the data was not accessible, and if methods for the status assessment were not found.
Data collection
We searched Ovid MEDLINE (www.ovid.com),
EMBASE (Ovid; www.ovid.com), and the
Cochrane Library CENTRAL (www.thecochra-nelibrary.com) databases from inception to September 2008 for magnesium intervention studies using text terms with appropriate trun-cation and relevant indexing terms. The general structure of the search was “magnesium” and “intervention OR supplementation OR depletion” and “humans.”
Titles and abstracts were screened for inclu-sion by a single reviewer. The full text of all articles collected was screened for inclusion by using an inclusion and exclusion form by two independent reviewers. Data for each included study were extracted into an Access (Microsoft Corp, Redmond, WA) database file by a single reviewer. In unclear cases, studies were discussed with the review team before beginning full data extraction, and, in some cases, study authors were contacted for clarification. When necessary, units of measurement were converted to a stan-dard form to facilitate comparison across studies. Data extraction and synthesis for primary and
secondary measures of interest were undertaken as discussed in the methodology article [14]. To claim whether a biomarker was useful, the fol-lowing terms indicate the conditions needed to be met: “yes”, forest plot showed a significant effect (p<0.05) based on ≥3 studies and ≥50 partici-pants between the intervention and control arms; “unclear but likely to be useful” forest plot showed a significant effect (p<0.05), but the result was based on two studies; “unclear”, insufficient data were available.
Results
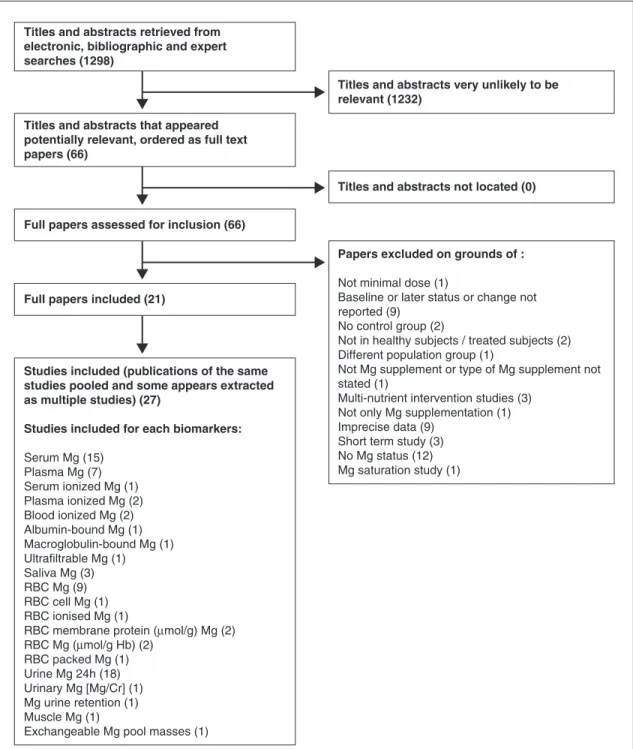
The flow diagram for this review is shown in
figure 1. Of the 1,298 titles and abstracts screened
after electronic and bibliographic searches, 66 appeared potentially relevant and were collected as full-text articles to be assessed for inclusion. At this stage, studies were excluded for a variety of reasons, including unsuitable study designs, such as nonhuman studies, single-case studies, studies not involving magnesium supplementation or depletion, studies without magnesium status measurements, studies on patients with patholo-gies known to affect magnesium status, and/or studies on patients receiving medication likely to affect magnesium status.
After analysis of the 66 potentially relevant full-text articles, twenty-seven studies (reported in 21 publications) fulfilled all of the inclusion criteria, and details of the included study charac-teristics are shown in table 1. Studies were excluded if the type of magnesium supplement was not stated, the study design involved multi-nutrient supplementation, the study did not report baseline and/or subsequent magnesium status, no minimal dose was provided, no control group was studied, a short-term study was performed (e.g., only 24 h supplementation), or different pop-ulation groups were used as supplemented and controls. Studies with altered data also resulted in exclusion. However, the majority of exclusion was due to imprecise data (results presentation or no methodology of status assessment) and for lack of magnesium status assessment (figure 1). A total of 20 potential biomarkers of magnesium status were assessed within the 27 included studies from 21 articles. The characteristics of the studies included in the analysis are presented in
table 1. The quality of the included studies varied;
12 RCTs were included in the review, but the method of randomisation was only stated in three studies. The remaining studies included CCT and B/A studies. Methods for checking compliance were reported in only 11 studies. The num-bers and reasons for dropouts were reported in eight studies. Full information pertaining to the quality assessment of each study is shown in
table 2.
Among the identified biomarkers, only serum magnesium, plasma magnesium, RBC magne-sium, and urinary magnesium excretion/24 h were reported in more than three studies with a total of more than 50 studied subjects; therefore, it was reliable to evaluate the effectiveness of these biomarkers. Ionised magnesium in serum, plasma or blood was reported in two, one and two studies, respectively. When combined, there were five studies on plasma/serum/blood ionised magne-sium with 51 subjects (figure 1, table 3). Saliva magnesium was evaluated in a three-arm supple-mentation study with 36 included subjects from one publication (table 3). Studies of other markers were limited to one or two studies and, therefore, were not eligible to allow us to decide whether they were effective markers of magnesium status
(table 3).
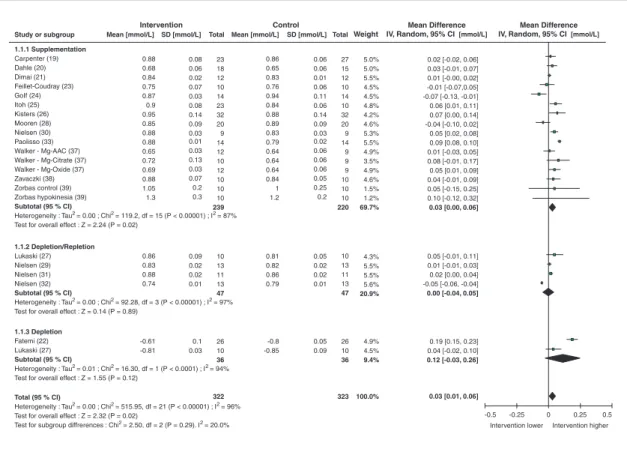
Serum and plasma total magnesium concentration
A large proportion of the studies included in this review measured serum (15 studies) or plasma (7 studies) magnesium concentration. All of the supplementation and depletion studies measuring serum and plasma magnesium were combined for statistical analyses. Serum/plasma magnesium concentration was investigated as a marker of magnesium status in 18 supplementation studies involving 275 participants and four depletion studies involving 47 participants. Combining data from the depletion and supplementation studies (322 subjects), primary analysis revealed an over-all significant (p<0.02) response of serum/plasma magnesium concentration to magnesium intake [weighted mean difference (WMD): 0.03 mmol/L; 95% CI: 0.01, 0.06; I296%]. However, the depletion
studies did not detect changes in this parameter
(table 3). This biomarker was affected by
Titles and abstracts retrieved from electronic, bibliographic and expert searches (1298)
Titles and abstracts very unlikely to be relevant (1232)
Titles and abstracts that appeared potentially relevant, ordered as full text papers (66)
Titles and abstracts not located (0)
Full papers assessed for inclusion (66)
Papers excluded on grounds of :
Not minimal dose (1)
Baseline or later status or change not reported (9)
No control group (2)
Not in healthy subjects / treated subjects (2) Different population group (1)
Not Mg supplement or type of Mg supplement not stated (1)
Multi-nutrient intervention studies (3) Not only Mg supplementation (1) Imprecise data (9)
Short term study (3) No Mg status (12) Mg saturation study (1)
Full papers included (21)
Studies included (publications of the same studies pooled and some appears extracted as multiple studies) (27)
Studies included for each biomarkers:
Serum Mg (15) Plasma Mg (7) Serum ionized Mg (1) Plasma ionized Mg (2) Blood ionized Mg (2) Albumin-bound Mg (1) Macroglobulin-bound Mg (1) Ultrafiltrable Mg (1) Saliva Mg (3) RBC Mg (9) RBC cell Mg (1) RBC ionised Mg (1)
RBC membrane protein (µmol/g) Mg (2) RBC Mg (µmol/g Hb) (2) RBC packed Mg (1) Urine Mg 24h (18) Urinary Mg [Mg/Cr] (1) Mg urine retention (1) Muscle Mg (1)
Exchangeable Mg pool masses (1)
Figure 1. Flow diagram for systematic review of biomarkers of magnesium status. Numbers are in parentheses.
T able 1. Characteristics of inc luded studies . Study P opulation: country(s); age; sex; no. included (treated/control); description Description of intervention; latest time point; no. in intervention in control at latest time Micronutrient type Study design Biomarker reported Carpenter et al. 2006 [19] USA; 8-14; F; 50 (23/27); healthy girls , selected for low Mg intake 300 mg Mg; 12 months; 23/27 Magnesium oxide RCT parallel Serum Mg; Urine (F ractional Excretion) FEMg Dahle et al. 1995 [20] Sweden; N/A; F; 33 (18/15); pregnancy-induced leg cramps 360 mg Mg; 3 weeks; 18/15 Magnesium oxide RCT parallel Serum Mg; Urine Mg Dimai et al. 1998 (21] USA; 27-36; M; 24 (12/12); healthy subjects 365 mg Mg; 30 da ys; 12/12 Magnesium carbonate and magnesium oxide CCT Blood ionized Mg; Serum Mg; Urine Mg [Mg/Creatinine] F atemi et al. 1991 [22] USA; 18-48; X; 26; normal volunteers Residential dietary intervention. Mg depletion ac hieved via low-Mg diet depletion study Before/After Serum Mg; Mg urine retention F eillet-Coudra y et al. 2002 [23] F rance; 24-34; F; 10 (10); healthy woman, selected for low Mg intake 366 mg Mg; 8 weeks; 10 Magnesium pidolate Before/After Plasma Mg; Plasma ionized Mg; RBC Mg; Urine Mg , Exc hangeable Mg pool masses Golf et al. 1990 [24] Germany; 30-60; M; 14 (14); male persons with hyperlipidaemia 360 mg Mg; 8 weeks; 14
Magnesium aspartate hydroc
hloride Before/After Plasma Mg; RBC Mg Itoh et al. 1997 [25] J apan; 48-84; X; 41 (23/10); healthy subjects 548 mg Mg (male)/411 mg Mg (female); 4 weeks; 23/10 Magnesium hydroxide RCT parallel Serum Mg; Urine Mg Kisters et al. 1993 [26] Germany; 38-60; X; 64 (32/32); patients with normal renal function 500 mg Mg; 4 weeks; 32/32 Magnesium hydrogen aspartate CCT Plasma Mg; RBC Mg Lukaski et al. 2002 [27] USA; 44,9-71; F; 10; postmenopausal women 200 mg Mg; 49 da ys; 10 Magnesium gluconate Before/After Serum Mg; Urine Mg; Musc le Mg; RBC Mg Lukaski et al. 2002 [27] USA; 44,9-71; F; 10; postmenopausal women 112 mg Mg; 93 da ys; 10 By diet Before/After Serum Mg; Urine Mg; Musc le Mg; RBC Mg Mooren et al. 2003 [28] Germany; 21-30; M; 20 (10/10); healthy volunteers recruited from the sport student population 360 mg Mg; 2 months; 10/10 N/A RCT parallel Serum Mg; Blood ionised Mg; RBC Mg; RBC ionised Mg
T able 1. (Continued ) Study P opulation: country(s); age; sex; no. included (treated/control); description Description of intervention; latest time point; no. in intervention in control at latest time Micronutrient type Study design Biomarker reported Nielsen 2004 [29] USA; 50-78; F; 13; postmenopausal women 200 mg Mg; 6 weeks; 13 Magnesium gluconate Before/After Serum Mg; Urine Mg Nielsen et al. 2003 [30] USA; 47-78; F; 9; postmenopausal women 300 mg Mg; 11 weeks; 9 Magnesium gluconate RCT Serum Mg; Urine Mg; Plasma ionised Mg; RBC Hb; RBC pac ked Mg; RBC , cell; RBCM (membrane) protein Nielsen et al. 2007 [31] USA; 49-71; F; 11; postmenopausal women 314 to 343 mg; 12 weeks; 11 Magnesium gluconate RCT Serum Mg; RBC membrane Mg; Urine Mg Nielsen et al. 2007 [32] USA; 47-75; F; 13; postmenopausal women 200 mg Mg; 11 weeks; 13 After low Mg diet Magnesium gluconate Before/After Serum Mg; Ultrafiltrable Mg Albumin-bound Mg; RBC Mg; Macroglobulin-bound Mg; P aolisso et al. 1992 [33] Italy; 67-89; X; 12 (12); ederly subjects 390 mg Mg; 4 weeks; 12 Magnesium pidolate Before/After Plasma Mg; RBC Mg Sac ks et al. 1998 [34] USA; 34-44; F; 150 (50/102); healthy nurses , selected for low Mg intake 336 mg Mg; 16 weeks; 48/102 Magnesium lactate RCT parallel Urine Mg W alker et al. 2002 [35] United Kingdom; 24-29; F; 81 (40/41); woman suffering premenstrual symptoms 200 mg Mg; 1 d a y ; 40/41 Magnesium oxide RCT crossover Urine Mg W alker et al. 2002 [35] United Kingdom; 24-29; F; 81 (47/41); woman suffering premenstrual symptoms 350 mg Mg; 1 d a y ; 47/41 Magnesium oxide RCT crossover Urine Mg W alker et al. 2002 [35] United Kingdom; 24-29; F; 81 (33/41); woman suffering premenstrual symptoms 500 mg Mg; 1 d a y ; 33/41 Magnesium oxide RCT crossover Urine Mg W alker et al. 1998 [36] United Kingdom; N/A; F; 74 (37/37); woman suffering from premenstrual symptoms 200 mg Mg; 1 d a y ; 37/37 Magnesium oxide RCT crossover Urine Mg
T able 1. (Continued ) Study P opulation: country(s); age; sex; no. included (treated/control); description Description of intervention; latest time point; no. in intervention in control at latest time Micronutrient type Study design Biomarker reported W alker et al. 2003 [37] United Kingdom; 23-28; X; 21 (12/9); healthy volunteers 300 mg Mg; 8.5 weeks; 12/9 Magnesium amino acid chelate RCT parallel Plasma Mg; Saliva Mg; Urine Mg W alker et al. 2003 [37] United Kingdom; 23-28; X; 21 (10/9); healthy volunteers 300 mg Mg; 8.5 weeks; 10/9 Magnesium citrate RCT parallel Plasma Mg; Saliva Mg; Urine Mg W alker et al. 2003 [37] United Kingdom; 23-28; X; 21 (12/9); healthy volunteers 300 mg Mg; 8.5 weeks; 12/9 Magnesium oxide RCT parallel Plasma Mg; Saliva Mg; Urine Mg Za vaczki et al. 2003 [38] Hungary; N/A; M; 20 (10/10); male with infertily problems 196.8 mg Mg; 90 da ys; 10/10 Magnesium orotate RCT parallel Serum Mg; Serum ionized Mg Zorbas et al. 1999 control [39] Greece; 22-26; M; 20 (10/10); male athlets 23 mg/kg bw; 52 weeks; 10/10 Magnesium lactate RCT parallel Serum Mg; Urine Mg Zorbas et al. 1999 hypokinesia [39] Greece; 22-26; M; 20 (10/10); male athlets 585 mg-665 mg Mg; 52 weeks; 10/10 Magnesium lactate RCT parallel Serum Mg; Urine Mg
T able 2. V alidity of inc luded studies . Studies Randomization; Method Dropouts; reasons Method of checking; results of compliance check Data problems Carpenter et al. 2006 [19] Y es; Random Number T able 4/27 for placebo; 2/23 for supplemented group; moving a w a y, excessive time commitment, difficulty with compliance with treatment Compliance with treatment w a s approximately 71% for the placebo group and 74% for the Mg-supplemented group and w a s confirmed by greater FEMg in the Mg-supplemented subjects at all treatment points NR Dahle et al. 1995 [20] Y es; N/A 5/73; acid spillage from urine bottle , hospital admission, failure of attend second visit, admission for premature labor , some data lost for one patient N/A; N/A No data on age Dimai et al. 1998 [21] Y es; N/A NR P ost study interview -finding of a significant increase in urinary Mg excretion in the test subjects compared to the control group/Full compliance NR F atemi et al. 1991 [22] No; N/A NR Twenty-four -hour urine collections for Mg and creatinine determinations were obtained daily to ensure compliance .; N/A NR F eillet-Coudra y et al. 2002 [23] No; N/A NR Unused ampoules were collected periodically NR Golf et al. 1990 [24] No; N/A N/A Dietician control during study NR Itoh et al. 1997 [25] Y es; N/A 8/18 for placebo; study protocol not fulfilled N/A; N/A NR Kisters et al. 1993 [26] No; N/A NR N/A; N/A Data from graphs Lukaski et al. 2002 [27] No; N/A NR N/A; N/A Data from graphs Mooren et al. 2003 [28] Y es; N/A NR T o enhance compliance , individual sessions with skilled counselors were conducted at randomization and at follow-up visits (6 weeks , 3 and 6 months). Phone and mail contacts between counseling sessions were done at the discretion of the individual clinical NR Nielsen 2004 [29] Y es; Latin-square design 2 -not postmenopausal, physician recommendation Subjects consumed only food and beverages provided by the dietary staff and were chaperoned on all outings from the metabolic unit to ensure compliance with the study protocol.; N/A NR
T able 2. (Continued ) Studies Randomization; Method Dropouts; reasons Method of checking; results of compliance check Data problems Nielsen et al. 2003 [30] Y es; N/A 3/3; personal reasons/medical reasons The magnesium and copper content of 6-d composites of diets and feces were determined by inductively coupled argon plasma emission spectroscopy NR Nielsen et al. 2007 [31] Y es; N/A 1 -not tolerated the amount of food ; 2 -personal reasons ; 1 -illness Subjects consumed only food and beverages provided by the dietary staff and were chaperoned on all outings from the metabolic unit to ensure compliance with the study protocol. / N/A NR Nielsen et al. 2007 [32] No; N/A NR Subjects consumed only food and beverages provided by the dietary staff and were chaperoned on all outings from the metabolic unit to ensure compliance with the study protocol. / N/A NR P aolisso et al. 1992 [33] Y es; N/A N/A N/A; N/A RCT study but considered as Before/After due to lac k o f placebo group measurement values Sac ks et al. 1998 [34] Y es; N/A N/A Pill count; Good compliance NR W alker et al. 2002 [35] Y es; N/A NR N/A; N/A incomplete crossover W alker et al. 1998 [36] Y es; N/A NR N/A; N/A NR W alker et al. 2003 [37] Y es; Eac h participant w a s issued a unique number after successful screening . T o ensure the double-blind nature of the study , the project leader (AFW), who had no direct contact with the volunteers nor with the analysis of the data, undertook the randomization 6; One volunteer dropped out within 24 h o f the commencement of the study and 5 others before the end of the study . All withdra w als were for personal reasons associated with the inconveniences of the protocol routine – n o withdra w als were due to adverse effects N/A; N/A NR N/A: not a vailable; NR: not reported.
Analysis (study type) and included studies
No. of studies (no. of included participants)
Pooled effect size, WMD (95% CI)
I2 Appears
effective as a biomarker?
Plasma/serum Mg (mmol/L) 22 (322) 0.03 [0.01, 0.06] 96 Yes
Plasma/serum/blood ionised Mg (mmol/L)
5 (51) 0.02 [-0.02, 0.06] 95 No
RBC Mg (mmol/L) 9 (130) 0.16 [0.09, 0.2] 85 Yes
Urinary Mg (mmol/24h) 18 (363) 1.82 [1.29, 2.36] 93 Yes
Saliva Mg (mmol/L) 3 (34) -0.03 [-0.09, 0.03] 0 Unclear
Albumin bound Mg (mmol/L) 1 (13) -0.02 [-0.04, 0.00] - Unclear
FEMg (%) 1 (23) 0.50 [-1.55, 2.55] - Unclear
Macroglobulin-bound Mg (mmol/L)
1 (13) -0.03 [-0.05, -0.01] - Unclear
Mg urine retention (%) 1 (16) 51 [48.23, 53.77] - Unclear
Muscle Mg (mmol/100 g dw) 1 (10) 5.50 [2.70,8.30] - Unclear
RBC cell (mol/106) 1 (9) 0.01 [0.00, 0.02] - Unclear
RBC ionised Mg (mmol/L) 1 (20) 0.05 [-0.22, 0.32] - Unclear
RBC Mg (mol/g Hb) 2 (19) 0.50 [0.14, 0.86] 80 Unclear
RBC packed Mg (mmol/L) 1 (9) 0.11 [0.10, 0.12] - Unclear
RBC membrane protein (mol/g)
2 (20) 0.16 [0.14, 0.18] 0 Unclear
Ultrafiltrable Mg (mmol/L) 1 (13) 0.00 [-0.02, 0.02] - Unclear
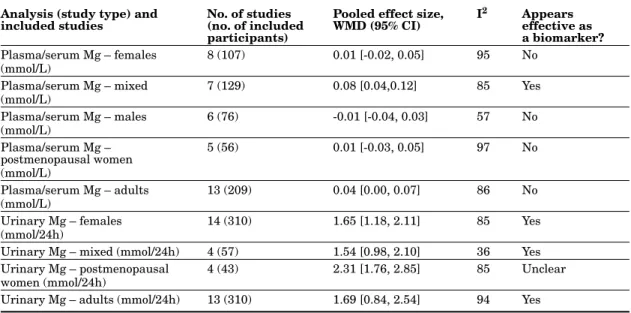
Urinary Mg (mmol/g creatinine) 1(13) 0.17 [0.15, 0.19] - Unclear A summary of the population subgroup
analy-sis of the effect of magnesium supplementation and depletion on serum/plasma magnesium concentration is given in the table 4. Because of the publications available, the data included in this analysis were mostly collected from studies in adults.
Serum, plasma and blood ionised magnesium concentration
Two studies included in this review measured plasma, one measured serum and two measured plasma ionised magnesium concentrations. These five studies were combined for statistical analy-ses and included 3 RCT, 1 CCT, and 1B/A, with four studies involving supplementation and one involving depletion. The retained studies involved 51 subjects. Neither primary analysis nor any individual study suggested a response of this biomarker to changes in magnesium intake. The primary analysis did not reveal a significant response to changes in dietary magnesium intake (WMD: 0.02 mmol/L; 95% CI: -0.02, 0.06; I295%)
(table 3).
Other serum and plasma biomarkers Only one study on a limited number of sub-jects was available for each of the other serum and plasma biomarkers: serum ultrafil-trable magnesium, albumin-bound magnesium, and macroglobulin-bound magnesium [31, 32]
(figure 1, table 3). Consequently, it was not possible
to draw any conclusions regarding the usefulness of these biomarkers.
RBC magnesium concentration
Combining data from three depletion and six sup-plementation studies (on 130 subjects), primary analysis revealed a significant overall (p<0.0001) response of erythrocyte magnesium concentration to magnesium intake (WMD: 0.16 mmol/L; 95% CI: 0.09, 0.22; I285%) (figure 3).
In some of the selected studies, RBC magne-sium was expressed by cell or haemoglobin, and also RBC membrane magnesium or free intra-cellular ionised magnesium concentrations were measured [28, 30, 32]. The results from these isolated studies were not combined for further analyses with the majority of available studies
Total (95 % CI)
Heterogeneity : Tau2 = 0.00 ; Chi2 = 515.95, df = 21 (P < 0.00001) ; I2 = 96% Test for overall effect : Z = 2.32 (P = 0.02)
Test for subgroup diffrerences : Chi2 = 2.50, df = 2 (P = 0.29). I2 = 20.0%
Intervention Control Mean Difference
IV, Random, 95% CI [mmol/L]
Mean Difference IV, Random, 95% CI [mmol/L] Study or subgroup Mean [mmol/L] SD [mmol/L] Total Mean [mmol/L] SD [mmol/L] Total Weight
1.1.1 Supplementation Carpenter (19) Dahle (20) Dimai (21) Feillet-Coudray (23) GoIf (24) Itoh (25) Kisters (26) Mooren (28) Nielsen (30) Paolisso (33) Walker - Mg-AAC (37) Walker - Mg-Citrate (37) Walker - Mg-Oxide (37) Zavaczki (38) Zorbas control (39) Zorbas hypokinesia (39) Subtotal (95 % CI)
Heterogeneity : Tau2 = 0.00 ; Chi2 = 119.2, df = 15 (P < 0.00001) ; I2 = 87% Test for overall effect : Z = 2.24 (P = 0.02)
1.1.2 Depletion/Repletion Lukaski (27) Nielsen (29) Nielsen (31) Nielsen (32) Subtotal (95 % CI)
Heterogeneity : Tau2 = 0.00 ; Chi2 = 92.28, df = 3 (P < 0.00001) ; I2 = 97% Test for overall effect : Z = 0.14 (P = 0.89)
1.1.3 Depletion
Fatemi (22) Lukaski (27)
Subtotal (95 % CI)
Heterogeneity : Tau2 = 0.01 ; Chi2 = 16.30, df = 1 (P < 0.0001) ; I2 = 94% Test for overall effect : Z = 1.55 (P = 0.12)
0.88 0.68 0.84 0.75 0.87 0.9 0.95 0.85 0.88 0.88 0.65 0.72 0.69 0.88 1.05 1.3 0.86 0.65 0.83 0.76 0.94 0.84 0.88 0.89 0.83 0.79 0.64 0.64 0.64 0.84 1 1.2 0.81 0.82 0.86 0.79 -0.8 -0.85 -0.5 0.5 0.86 0.83 0.88 0.74 -0.61 -0.81 322 323 100.0% 0.08 0.06 0.02 0.07 0.03 0.08 0.14 0.09 0.03 0.01 0.03 0.13 0.03 0.07 0.2 0.3 0.09 0.02 0.02 0.01 0.1 0.03 0.06 0.06 0.01 0.06 0.11 0.06 0.14 0.09 0.03 0.02 0.06 0.06 0.06 0.05 0.25 0.2 0.05 0.02 0.02 0.01 0.05 0.09 23 18 12 10 14 23 32 20 9 14 12 10 12 10 10 10 239 10 13 11 13 47 26 10 36 27 15 12 10 14 10 32 20 9 14 9 9 9 10 10 10 220 10 13 11 13 47 26 10 36 5.0% 5.0% 5.5% 4.5% 4.5% 4.8% 4.2% 4.6% 5.3% 5.5% 4.9% 3.5% 4.9% 4.6% 1.5% 1.2% 69.7% 4.3% 5.5% 5.5% 5.6% 20.9% 4.9% 4.5% 9.4% 0.02 [-0.02, 0.06] 0.03 [-0.01, 0.07] 0.01 [-0.00, 0.02] -0.01 [-0.07,0.05] -0.07 [-0.13, -0.01] 0.06 [0.01, 0.11] 0.07 [0.00, 0.14] -0.04 [-0.10, 0.02] 0.05 [0.02, 0.08] 0.09 [0.08, 0.10] 0.01 [-0.03, 0.05] 0.08 [-0.01, 0.17] 0.05 [0.01, 0.09] 0.04 [-0.01, 0.09] 0.05 [-0.15, 0.25] 0.10 [-0.12, 0.32] 0.03 [0.00, 0.06] 0.05 [-0.01, 0.11] 0.01 [-0.01, 0.03] 0.02 [0.00, 0.04] -0.05 [-0.06, -0.04] 0.00 [-0.04, 0.05] 0.19 [0.15, 0.23] 0.04 [-0.02, 0.10] 0.12 [-0.03, 0.26] 0.03 [0.01, 0.06] -0.25 0 0.25 Intervention higher Intervention lower
Figure 2. Serum/plasma magnesium (mmol/L) response to magnesium supplementation or depletion. that reported RBC magnesium concentrations
expressed by RBC volume. Urinary magnesium
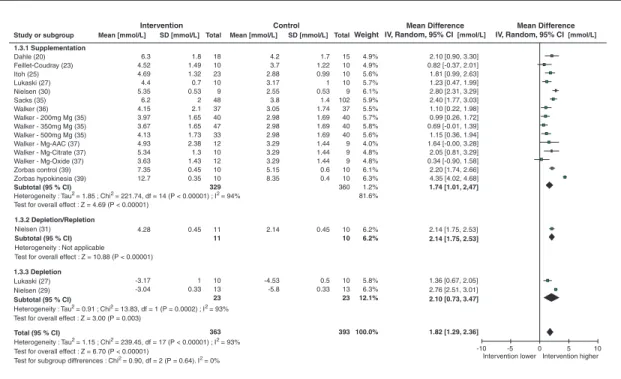
Combining data from 14 RCT and 5 B/A studies
(table 3), which included four depletion and
15 supplementation studies, primary analysis revealed an overall significant (p<0.00001) response of urinary magnesium excretion to dietary magnesium intake (WMD: 1.82 mmol/24h; 95% CI: 1.29, 2.36; I293%) (figure 4).
Data from one CCT study expressed urinary magnesium as magnesium/creatinine [21] and from one study calculating urine fractional excre-tion of magnesium (FEMg) (a parallel RCT with magnesium supplemented girls) [19] have not been incorporated into the statistical analysis because of the difference in the calculation method used and expression of the results; the majority of studies evaluating 24-h Mg excretion. However,
it was not possible to draw any firm conclusions about the effectiveness of these two last parame-ters, which were considered separately because of the insufficient number of subjects and available studies (table 3).
A summary of the population subgroup analysis of the response of urine magnesium concentra-tion to magnesium supplementaconcentra-tion and depleconcentra-tion is provided in the table 4. The data included in this analysis were mostly collected from studies in adults. In adults, urinary magnesium appears to be an effective biomarker.
Saliva magnesium
One RCT parallel supplementation study with three different magnesium salts, which included 12 participants per arm, assessed saliva magne-sium [37]. There were not enough studies of this biomarker to draw any conclusions about its use-fulness (table 3).
Analysis (study type) and included studies
No. of studies (no. of included participants)
Pooled effect size, WMD (95% CI) I2 Appears effective as a biomarker? Plasma/serum Mg – females (mmol/L) 8 (107) 0.01 [-0.02, 0.05] 95 No Plasma/serum Mg – mixed (mmol/L) 7 (129) 0.08 [0.04,0.12] 85 Yes Plasma/serum Mg – males (mmol/L) 6 (76) -0.01 [-0.04, 0.03] 57 No Plasma/serum Mg – postmenopausal women (mmol/L) 5 (56) 0.01 [-0.03, 0.05] 97 No Plasma/serum Mg – adults (mmol/L) 13 (209) 0.04 [0.00, 0.07] 86 No Urinary Mg – females (mmol/24h) 14 (310) 1.65 [1.18, 2.11] 85 Yes
Urinary Mg – mixed (mmol/24h) 4 (57) 1.54 [0.98, 2.10] 36 Yes Urinary Mg – postmenopausal
women (mmol/24h)
4 (43) 2.31 [1.76, 2.85] 85 Unclear
Urinary Mg – adults (mmol/24h) 13 (310) 1.69 [0.84, 2.54] 94 Yes Other biomarkers
Urinary magnesium retention was only studied in one B/A study [22] of 26 subjects.
Muscle magnesium was only evaluated in one B/A study on ten magnesium-supplemented postmenopausal women [27]. Exchangeable mag-nesium pool masses were only evaluated in one B/A study on ten magnesium-supplemented young women [23]. Consequently, it was not possible
to draw any conclusions about the usefulness of these biomarkers (table 3).
Discussion
A total of 21 publications with RCTs, CCTs and B/A studies were included in this review. The majority of studies included were magnesium
Total (95 % CI)
Heterogeneity : Tau2 = 0.01 ; Chi2 = 52.41, df = 8 (P < 0.00001) ; I2 = 85% Test for overall effect : Z = 4.74 (P = 0.00001)
Test for subgroup diffrerences : Chi2 = 0.00, df = 1 (P = 0.95). I2 = 0%
Intervention Control Mean Difference
IV, Random, 95% CI [mmol/L]
Mean Difference IV, Random, 95% CI [mmol/L] Study or subgroup Mean [mmol/L] SD [mmol/L] Total Mean [mmol/L] SD [mmol/L] Total Weight
1.2.2 Supplementation Feillet-Coudray (23) GoIf (24) Kisters (26) Mooren (28) Nielsen (30) Paolisso (33) Subtotal (95 % CI)
Heterogeneity : Tau2 = 0.02 ; Chi2 = 47.56, df = 5 (P < 0.00001) ; I2 = 89% Test for overall effect : Z = 2.31 (P = 0.02)
1.2.1 Depletion/Repletion
Nielsen (29) Nielsen (31) Nielsen (32)
Subtotal (95 % CI)
Heterogeneity : Tau2 = 0.00 ; Chi2 = 3.56, df = 2 (P = 0.17) ; I2 = 44% Test for overall effect : Z = 6.38 (P < 0.00001)
-0.5 0.5 130 130 100.0% 2.21 2.67 3.25 1.85 2.29 1.91 1.6 2.21 2.19 2.1 2.51 3 1.78 1.88 1.84 1.67 2.1 1.86 0.08 0.021 0.17 0.17 0.06 0.18 0.27 0.08 0.05 0.08 0.021 0.17 0.17 0.36 0.17 0.27 0.08 0.1 9 11 13 33 10 14 32 20 9 12 97 9 11 13 33 10 14 32 20 9 12 97 13.0% 15.4% 9.6% 38.0% 8.6% 6.7% 12.3% 7.7% 13.0% 13.6% 62.0% -0.25 0 0.25 Intervention higher Intervention lower 0.07 [-0.08, 0.22] 0.41 [0.22, 0.60] 0.07 [-0.02, 0.16] -0 .07 [-0 .24, 0.10] 0.11 [0 .04, 0.18] 0.33 [0.27, 0.39] 0.15 [0.02, 0.28] 0.11 [0.04, 0.18] 0.16 [0.14, 0.18] 0.25 [0.12, 0.38] 0.16 [0.11, 0.21] 0.16 [0.09, 0.22]
Figure 3. RBC magnesium (mmol/L) response to magnesium supplementation or depletion. Arrow-heads indicate direction of response when unable to represent data on most appropriate scale.
Total (95 % CI)
Heterogeneity : Tau2 = 1.15 ; Chi2 = 239.45, df = 17 (P < 0.00001) ; I2 = 93% Test for overall effect : Z = 6.70 (P < 0.00001)
Test for subgroup diffrerences : Chi2 = 0.90, df = 2 (P = 0.64). I2 = 0%
Intervention Control Mean Difference
IV, Random, 95% CI [mmol/L]
Mean Difference IV, Random, 95% CI [mmol/L] Study or subgroup Mean [mmol/L] SD [mmol/L] Total Mean [mmol/L] SD [mmol/L] TotalWeight
1.3.1 Supplementation Dahle (20) Feillet-Coudray (23) Itoh (25) Lukaski (27) Nielsen (30) Sacks (35) Walker (36) Walker - 200mg Mg (35) Walker - 350mg Mg (35) Walker - 500mg Mg (35) Walker - Mg-AAC (37) Walker - Mg-Citrate (37) Walker - Mg-Oxide (37) Zorbas control (39) Zorbas hypokinesia (39) Subtotal (95 % CI)
Heterogeneity : Tau2 = 1.85 ; Chi2 = 221.74, df = 14 (P < 0.00001) ; I2 = 94% Test for overall effect : Z = 4.69 (P < 0.00001)
1.3.2 Depletion/Repletion
Nielsen (31)
Subtotal (95 % CI)
Heterogeneity : Not applicable Test for overall effect : Z = 10.88 (P < 0.00001)
1.3.3 Depletion
Lukaski (27) Nielsen (29)
Subtotal (95 % CI)
Heterogeneity : Tau2 = 0.91 ; Chi2 = 13.83, df = 1 (P = 0.0002) ; I2 = 93% Test for overall effect : Z = 3.00 (P = 0.003)
6.3 4.52 4.69 4.4 5.35 6.2 4.15 3.97 3.67 4.13 4.93 5.34 3.63 7.35 12.7 4.28 -3.17 -3.04 4.2 3.7 2.88 3.17 2.55 3.8 3.05 2.98 2.98 2.98 3.29 3.29 3.29 5.15 8.35 -10 10 363 393 100.0% 1.8 1.49 1.32 0.7 0.53 2 2.1 1.65 1.65 1.73 2.38 1.3 1.43 0.45 0.35 1.7 1.22 0.99 1 0.53 1.4 1.74 1.69 1.69 1.69 1.44 1.44 1.44 0.6 0.4 18 10 23 10 9 48 37 40 47 33 12 10 12 10 10 329 15 10 10 10 9 102 37 40 40 40 9 9 9 10 10 360 4.9% 4.9% 5.6% 5.7% 6.1% 5.9% 5.5% 5.7% 5.8% 5.6% 4.0% 4.8% 4.8% 6.1% 6.3% 1.2% 81.6% 6.2% 6.2% 5.8% 6.3% 12.1% -5 0 5 Intervention higher Intervention lower 0.45 1 0.33 0.45 0.5 0.33 2.14 -4.53 -5.8 11 11 10 13 23 10 10 10 13 23 2.10 [0.90, 3.30] 0.82 [-0.37, 2.01] 1.81 [0.99, 2.63] 1.23 [0.47, 1.99] 2.80 [2.31, 3.29] 2.40 [1.77, 3.03] 1.10 [0.22, 1.98] 0.99 [0.26, 1.72] 0.69 [-0.01, 1.39] 1.15 [0.36, 1.94] 1.64 [-0.00, 3.28] 2.05 [0.81, 3.29] 0.34 [-0.90, 1.58] 2.20 [1.74, 2.66] 4.35 [4.02, 4.68] 1.74 [1.01, 2,47] 2.14 [1.75, 2.53] 2.14 [1.75, 2.53] 1.36 [0.67, 2.05] 2.76 [2.51, 3.01] 2.10 [0.73, 3.47] 1.82 [1.29, 2.36]
Figure 4. Urinary magnesium (mmol/24h) response to magnesium supplementation or depletion. supplementation studies. Fewer magnesium
depletion studies were identified with lower total numbers of participants than supplementation studies. A significant proportion of the analyses conducted for individual biomarkers did not meet the minimum criteria for determining their usefulness, i.e., they had<3 studies or <50 par-ticipants contributing data to the meta-analysis according to the methodology used [14]. How-ever, it should be stressed that several of these parameters arise from the application of diffe-rent methodologies for the equivalent param-eters, thereby leading to different expression of the results (e.g., analyses on RBC and urine). With regard to the limited num-ber of these studies, it was not possible to conclude on the potential usefulness of several of these particular assessments. Among the identified biomarkers, only serum magnesium, plasma magnesium, RBC magnesium, and uri-nary magnesium excretion/24 h were reported in more than three studies with a total of more than 50 studied subjects and thus were reli-able for evaluation of biomarker effectiveness. These data were combined as serum/plasma
because, frequently, total serum and plasma magnesium were alternatively measured. Finally, we concluded that serum/plasma magnesium concentration, RBC magnesium concentration, and urinary magnesium excretion responded to dietary manipulation. Consequently, these parameters appear to be useful biomarkers of magnesium status in the general population.
For the other potential biomarkers, special attention was paid to free extracellular ionised magnesium. This fraction of magnesium is gene-rally considered as a more specific marker of magnesium status than total plasma or serum magnesium [12]. Only five studies of this biomarker were eligible according to the review criteria. However, the analyses in these studies were performed on serum, plasma, or blood sam-ples. Also, various equipment (AVL or NOVA8+) were used in the retained studies. As previously discussed, significant differences among the ionised magnesium concentration have been obtained with various analysers [40]. Despite these limitations, we aggregated all the available results on plasma, serum and blood because of the low number of relevant studies. Finally, because
clude if ionised magnesium concentration is likely to be effective or ineffective as biomarkers of mag-nesium status.
Unfortunately, the studies included in this review on biomarkers of potential interest, i.e., exchangeable pools of magnesium and muscle and saliva magnesium, were only reported by one study, for each of this parameter, with a low number of included subjects. These and other biomarkers of potential interest (bone, platelets, white blood cell magnesium) could also not be analysed because the available studies did not meet sufficient criteria to be included to this review.
Due to the low number of available studies and studies with low number of included subjects, there is not enough information to make a clear decision about magnesium status biomarkers in specific subgroups. The majority of studies have been conducted in adults. After subgrouping, mainly urine magnesium excretion was shown to be significantly modulated by magnesium intake in adults and females (table 4). There was no capacity within the data to conduct subgroup analysis for a range of population groups, especially vulnerable populations, e.g. infants, adolescents, pregnant women, or elderly subjects. In fact, we have identified only one publication for each of following groups: 10-year-old girls [19], pregnant women [20] and elderly subjects [33]. Also, few publications provided an extensive description of the subjects studied. It would be of interest to evaluate the relationship between magnesium status markers and body mass index (BMI). Numerous publications point out the rela-tionship between low magnesium intake and metabolic syndrome, obesity and type 2 diabetes [8, 10, 41-48]. Several studies have reported lower magnesium status in these conditions, and this relationship is currently under debate [49-57]. However, available data did not allowed us to iso-late these specific groups for further analyses.
The major limitation for conducting this sys-tematic review is the low number of available studies (preferably RCTs) on healthy subjects. Papers were carefully selected; however, some of selected studies have been conducted on subjects presenting commonly encountered pathophysio-logical conditions, i.e., pregnancy-induced leg cramps [20], untreated hyperlipidemia [24], pre-menstrual symptoms [35, 36], male infertility problems [38], intense sport activity [28, 39],
subjects did not receive medications or sup-plements other than magnesium. Because only isolated studies are available for these subjects, it was not possible to relate these conditions to the magnesium status.
Furthermore, it was not possible to draw conclu-sions about potential relations between biomarker responsiveness and type, dose, or length of sup-plementation. Various magnesium supplements were used in the selected studies: oxide, aspartate, hydroxide, gluconate, pidolate, citrate, lactate, carbonate and amino acid chelate. The duration of supplementation and the dose used varied in these studies; however, a majority of the included studies used 200 to 400 mg magnesium/day. The use of organic magnesium salts in several of the included studies results from the consideration that these salts are more bioavailable than are nonorganic ones [58]. Because of the diversity of supplements, protocols and subjects, we did not attempt to compare their efficiency in our analy-sis. It is also noteworthy that we have not included studies with magnesium/vitamin B6 supplemen-tation in our review. Magnesium/vitamin B6 is a common magnesium supplement, but a possible interaction exists between these two compounds. Future analysis of the available data on mag-nesium/vitamin B6 supplementation should be conducted to evaluate the possible benefits of their interaction.
The data included in this review are mainly from supplemented subjects and few data are available from depleted individuals. A prolonged magnesium depletion study with 101 mg of magnesium/day exhibited adverse heart rhythm changes after 78 days of depletion [32]. Conse-quently, the implementation of depletion studies should be carefully considered from an ethical point of view.
The present review reveals that even if mag-nesium supplementation is used for a long time, well-designed intervention RCTs in healthy indi-viduals with respect to their physiological and nutritional conditions are scarce. Although this systematic review offers primary outcome data for each biomarker identified, the limited number of studies included and the limited number of subjects in the population subgroups render it impossible to draw conclusions about potential relations between biomarker responsiveness for a range of population groups. Subsequently, further studies should be conducted on the best way to
evaluate magnesium status in population groups susceptible to magnesium deficiency. In particu-lar, the research should be focused on evaluating intracellular magnesium and body pools of mag-nesium. It would be of interest to connect these studies with a magnesium balance evaluation [59]. Additionally, it is important to stress that compared to many other minerals, such as sele-nium, iodine, zinc and copper [15-18], biomarkers for magnesium status are limited to the magne-sium measurements in biological fluids, cells and tissues. At present, no indirect biomarkers of mag-nesium status are identified. The recent progress in identifying genes modulated by magnesium concentration opens interesting perspectives for the research of these biomarkers.
Genetic factors controlling intra- and extracel-lular Mg levels should be considered in the future research of biomarkers; however, these genetic factors are weakly known. Serum magnesium con-centrations have been shown to have a heritable component with heritability estimates of ∼30% [60]. The pioneer study by Henrotte et al. in 1990 [61] pointed out the importance of genetics for plasma and RBC magnesium levels. This finding was confirmed in a mouse animal model selected for low and high RBC magnesium [62]. Recent advances in the fields of genetics and genomics have allowed for substantial progress in this area by identifying new players of mag-nesium homeostasis regulation [63-65]. Recently published genome-wide meta-analysis of cohorts identified six genomic regions that contained com-mon variants associated with serum magnesium levels [66]. All of the variants were nominally associated with clinically defined hypomagne-saemia. These data from human genetics will initiate a new era in understanding the relation-ship between genetics, nutrition and diseases in determining magnesium status.
The selection process of the data included in the present review highlighted that the quality of published data are often poor for the purpose of a systematic review on magnesium status. Several publications did not provide sufficient or clear information on the magnesium intake, on the clinical protocol, and on the assay methodology. These issues should be considered when planning projects and publishing results. Well-designed RCTs of sufficient size with varying doses and duration of supplementation and with evaluation of the magnesium intake using a whole-diet pro-file (e.g., magnesium/calories ratio) are required
in various population subgroups. With emerging knowledge of genetic factors determining magne-sium status, it will be important in future studies to take into account the genetic background of studied subjects. Ultimately, the results of such studies could contribute to the development of evidence-based dietary recommendations that are better targeted to specific populations.
Acknowledgments
We want to thank Kate Ashton for her assis-tance in the literature searching and Edmond Rock for critically reading the manuscript.
Disclosure
Supported partially by the Commission of the European Communities, specific RTD Programme “Quality of Life and Management of Living Resources,” within the 6th Framework Pro-gramme (contract no. FP6-036196-2).
EURRECA: EURopean micronutrient RECom-mendations Aligned.
None of the authors has any conflict of interest to disclose.
References
1. Romani A. Regulation of magnesium homeostasis and transport in mammalian cells. Arch Biochem
Biophys 2007; 458: 90-102.
2. Durlach J. Magnesium in clinical practice.
London: John Libbey, 1988.
3. Rayssiguier A, Mazur A, Durlach J, eds. Advances
in magnesium research: nutrition and health.
London: John Libbey, 2001 (502 p.).
4. Standing Committee on the Scientific Evaluation of Dietary Reference Intakes, Food and Nutrition Board, Institute of Medicine, National Academy of Sciences. Dietary reference intakes for calcium,
phosphorus, magnesium, vitamin D, and fluoride.
Washington, DC: National Academy Press, 1997. 5. Martin A (coordonnateur). Apports nutritionnels
conseillés pour la population franc¸aise. 3e ed. TEC
et DOC, Lavoisier, 2001.
6. Galan P, Preziosi P, Durlach V, Valeix P, Ribas L, Bouzid D, Favier A, Hercberg S. Dietary magnesium
1997; 10: 321-8.
7. Pennington JAT. Current dietary intakes of trace elements and minerals. In: Bogden JD, Klevey LM, eds. Clinical nutrition of the essential trace elements
and minerals. Totowa, NJ: Humana Press, 2000, p.
49-67.
8. King DE, Mainous 3rd. AG, Geesey ME, Woolson RF. Dietary magnesium and C-reactive protein levels. J
Am Coll Nutr 2005; 24: 166-71.
9. Moshfegh A, Goldman JD, Cleveland LE. What
we eat in America, NHANES 2001-2002: usual nutrient intakes from food compared to dietary reference intakes.. Totowa, NJ: U.S. Department
of Agriculture, Agricultural Research Service, 2005.
10. Bo S, Durazzo M, Guidi S, Carello M, Sacerdote C, Silli B, Rosato R, Cassader M, Gentile L, Pagano G. Dietary magnesium and fiber intakes and inflam-matory and metabolic indicators in middle-aged subjects from a population-based cohort. Am J Clin
Nutr 2006; 84: 1062-9.
11. Rosanoff A. Rising Ca:Mg intake ratio from food in USA adults: a concern?. Magnes Res 2010; 23: S181-93.
12. Arnaud MJ. Update on the assessment of magne-sium status. Br J Nutr 2008; 99 (suppl. 3): S24-36. 13. Elin RJ. Assessment of magnesium status for
diag-nosis and therapy. Magnes Res 2010; 23: 194-8. 14. Hooper L, Ashton K, Harvey LJ, Decsi T,
Fairweather-Tait SJ. Assessing potential biomarkers of micronutrient status by using a systematic review methodology: methods. Am J
Clin Nutr 2009; 89: 1953S-9S.
15. Ristic-Medic D, Piskackova Z, Hooper L, Ruprich J, Casgrain A, Ashton K, Pavlovic M, Glibetic M. Methods of assessment of iodine status in humans: a systematic review. Am J Clin Nutr 2009; 89: 2052S-69S.
16. Ashton K, Hooper L, Harvey LJ, Hurst R, Casgrain A, Fairweather-Tait SJ. Methods of assessment of selenium status in humans: a systematic review. Am
J Clin Nutr 2009; 89: 2025S-39S.
17. Harvey LJ, Ashton K, Hooper L, Casgrain A, Fairweather-Tait SJ. Methods of assessment of cop-per status in humans: a systematic review. Am J
Clin Nutr 2009; 89: 2009S-24S.
18. Lowe NM, Fekete K, Decsi T. Methods of assessment of zinc status in humans: a systematic review. Am J
Clin Nutr 2009; 89: 2040S-51S.
19. Carpenter TO, DeLucia MC, Zhang JH, Bejnerowicz G, Tartamella L, Dziura J, Petersen KF, Befroy D,
dietary magnesium oxide supplementation on bone mineral content in healthy girls. J Clin Endocrinol
Metab 2006; 91: 4866-72.
20. Dahle LO, Berg G, Hammar M, Hurtig M, Larsson L. The effect of oral magnesium substitution on pregnancy-induced leg cramps. Am J Obstet Gynecol 1995; 173: 175-80.
21. Dimai HP, Porta S, Wirnsberger G, Lindschinger M, Pamperl I, Dobnig H, Wilders-Truschnig M, Lau KH. Daily oral magnesium supplementation sup-presses bone turnover in young adult males. J Clin
Endocrinol Metab 1998; 83: 2742-8.
22. Fatemi S, Ryzen E, Flores J, Endres DB, Rude RK. Effect of experimental human magnesium deple-tion on parathyroid hormone secredeple-tion and 1,25-dihydroxyvitamin D metabolism. J Clin Endocrinol
Metab 1991; 73: 1067-72.
23. Feillet-Coudray C, Coudray C, Tressol JC, Pépin D, Mazur A, Abrams SA, Rayssiguier Y. Exchangeable magnesium pool masses in healthy women: effects of magnesium supplementation. Am J Clin Nutr 2002; 75: 72-8.
24. Golf SW, Riediger H, Matthes S, Kuhn D. Effects of magnesium treatment on hyperlipemia. Magnes
Bull 1990; 12: 138-43.
25. Itoh K, Kawasaka T, Nakamura M. The effects of high oral magnesium supplementation on blood pressure, serum lipids and related variables in apparently healthy Japanese subjects. Br J Nutr 1997; 78: 737-50.
26. Kisters K, Spieker C, Tepel M, Zidek W. New data about the effects of oral physiological mag-nesium supplementation on several cardiovascular risk factors (lipids and blood pressure). Magnes Res 1993; 6: 355-60.
27. Lukaski HC, Nielsen FH. Dietary magnesium depletion affects metabolic responses during sub-maximal exercise in postmenopausal women. J Nutr 2002; 132: 930-5.
28. Mooren FC, Golf SW, Völker K. Effect of magnesium on granulocyte function and on the exercise induced inflammatory response. Magnes Res 2003; 16: 49-58.
29. Nielsen FH. The alteration of magnesium, calcium and phosphorus metabolism by dietary magne-sium deprivation in postmenopausal women is not affected by dietary boron deprivation. Magnes Res 2004; 17: 197-210.
30. Nielsen FH, Milne DB. Some magnesium status indicators and oxidative metabolism responses to low-dietary magnesium are affected by dietary cop-per in postmenopausal women. Nutrition 2003; 19: 617-26.
31. Nielsen FH, Milne DB, Gallagher S, Johnson L, Hoverson B. Moderate magnesium deprivation results in calcium retention and altered potas-sium and phosphorus excretion by postmenopausal women. Magnes Res 2007; 20: 19-31.
32. Nielsen FH, Milne DB, Klevay LM, Gallagher S, Johnson L. Dietary magnesium deficiency induces heart rhythm changes, impairs glucose tolerance, and decreases serum cholesterol in post menopausal women. J Am Coll Nutr 2007; 26: 121-32.
33. Paolisso G, Sgambato S, Gambardella A, Pizza G, Tesauro P, Varricchio M, D’Onofrio F. Daily mag-nesium supplements improve glucose handling in elderly subjects. Am J Clin Nutr 1992; 55: 1161-7. 34. Sacks FM, Willett WC, Smith A, Brown LE, Rosner
B, Moore TJ. Effect on blood pressure of potassium, calcium, and magnesium in women with low habit-ual intake. Hypertension 1998; 31: 131-8.
35. Walker AF, De Souza MC, Marakis G, Robinson PA, Morris AP, Bolland KM. Unexpected bene-fit of sorbitol placebo in Mg intervention study of premenstrual symptoms: implications for choice of placebo in RCTs. Med Hypotheses 2002; 58: 213-20.
36. Walker AF, De Souza MC, Vickers MF, Abeyasekera S, Collins ML, Trinca LA. Magnesium supplemen-tation alleviates premenstrual symptoms of fluid retention. J Womens Health 1998; 7: 1157-65. 37. Walker AF, Marakis G, Christie S, Byng M. Mg
citrate found more bioavailable than other Mg prepa-rations in a randomised, double-blind study. Magnes
Res 2003; 16: 183-91.
38. Závaczki Z, Szöllosi J, Kiss SA, Koloszár S, Fejes I, Kovács L, Pál A. Magnesium-orotate supple-mentation for idiopathic infertile male patients: a randomized, placebo-controlled clinical pilot study.
Magnes Res 2003; 16: 131-6.
39. Zorbas YG, Kakurin VJ, Afonin VB, Charapakhin KP, Denogradov SD. Magnesium supplements’ effect on magnesium balance in athletes during prolonged restriction of muscular activity. Kidney Blood Press
Res 1999; 22: 146-53.
40. Huijgen HJ, Sanders R, Cecco SA, Rehak NN, Sanders GT, Elin RJ. Serum ionized magne-sium: comparison of results obtained with three ion-selective analyzers. Clin Chem Lab Med
1999; 37: 465-70.
41. Song Y, Ridker PM, Manson JE, Cook NR, Buring JE, Liu S. Magnesium intake, C-reactive pro-tein, and the prevalence of metabolic syndrome in middle-aged and older U.S. women. Diabetes Care 2005; 28: 1438-44.
42. He K, Liu K, Daviglus ML, Morris SJ, Loria CM, Van Horn L, Jacobs Jr. DR, Savage PJ. Magnesium
intake and incidence of metabolic syndrome among young adults. Circulation 2006; 113: 1675-82. 43. Ford ES, Li C, McGuire LC, Mokdad AH, Liu S.
Intake of dietary magnesium and the prevalence of the metabolic syndrome among U.S. adults. Obesity
(Silver Spring) 2007; 15: 1139-46.
44. King DE, Mainous 3rd. AG, Geesey ME, Ellis T. Magnesium intake and serum C-reactive protein lev-els in children. Magnes Res 2007; 20: 32-6.
45. Beydoun MA, Gary TL, Caballero BH, Lawrence RS, Cheskin LJ, Wang Y. Ethnic differences in dairy and related nutrient consumption among US adults and their association with obesity, central obesity, and the metabolic syndrome. Am J Clin Nutr 2008; 87: 1914-25.
46. McKeown NM, Jacques PF, Zhang XL, Juan W, Sahyoun NR. Dietary magnesium intake is related to metabolic syndrome in older Americans. Eur J
Nutr 2008; 47: 210-6.
47. King DE. Inflammation and elevation of C-reactive protein: does magnesium play a key role?. Magnes
Res 2009; 22: 57-9.
48. Chacko SA, Song Y, Nathan L, Tinker L, de Boer IH, Tylavsky F, Wallace R, Liu S. Relations of dietary magnesium intake to biomarkers of inflammation and endothelial dysfunction in an ethnically diverse cohort of postmenopausal women. Diabetes Care 2010; 33: 304-10.
49. Kao WH, Folsom AR, Nieto FJ, Mo JP, Watson RL, Brancati FL. Serum and dietary magnesium and the risk for type 2 diabetes mellitus: the atheroscle-rosis risk in communities study. Arch Intern Med 1999; 159: 2151-9.
50. Corica F, Corsonello A, Ientile R, Cucinotta D, Di Benedetto A, Perticone F, Dominguez LJ, Barbagallo M. Serum ionized magnesium levels in relation to metabolic syndrome in type 2 diabetic patients. J
Am Coll Nutr 2006; 25: 210-5.
51. Rayssiguier Y, Gueux E, Nowacki W, Rock E, Mazur A. High fructose consumption combined with low dietary magnesium intake may increase the incidence of the metabolic syndrome by inducing inflammation. Magnes Res 2006; 19: 237-43. 52. Belin RJ, He K. Magnesium physiology and
pathogenic mechanisms that contribute to the development of the metabolic syndrome. Magnes Res 2007; 20: 107-29.
53. Simmons D, Joshi S, Shaw J. Hypomagnesaemia is associated with diabetes: not pre-diabetes, obesity or the metabolic syndrome. Diabetes Res Clin Pract 2010; 87: 261-6.
54. Lima Mde L, Cruz T, Rodrigues LE, Bomfim O, Melo J, Correia R, Porto M, Cedro A, Vicente E.
patients with metabolic syndrome-evidences for its relation to insulin resistance. Diabetes Res Clin
Pract 2009; 83: 257-62.
55. Günther T. Biochemical mechanisms of the metabolic syndrome and the role of magnesium.
Magnes Res 2010; 23: 142-5.
56. Rayssiguier Y, Libako P, Nowacki W, Rock E. Mag-nesium deficiency and metabolic syndrome: stress and inflammation may reflect calcium activation.
Magnes Res 2010; 23: 73-80.
57. Guerrero-Romero F, Bermudez-Pe ˜na C, Rodríguez-Morán M. Severe hypomagnesemia and low-grade inflammation in metabolic syndrome. Magnes Res 2011; 24: 45-53.
58. Coudray C, Rambeau M, Feillet-Coudray C, Gueux E, Tressol JC, Mazur A, Rayssiguier Y. Study of magnesium bioavailability from ten organic and inorganic Mg salts in Mg-depleted rats using a stable isotope approach. Magnes Res 2005; 18: 215-23. 59. Hunt CD, Johnson LK. Magnesium requirements:
new estimations for men and women by cross-sectional statistical analyses of metabolic magne-sium balance data. Am J Clin Nutr 2006; 84: 843-52. 60. Hunter DJ, Lange M, Snieder H, MacGregor AJ, Swaminathan R, Thakker RV, Spector TD. Genetic contribution to renal function and electrolyte balance: a twin study. Clin Sci (Lond) 2002; 103: 259-65.
61. Henrotte JG, Pla M, Dausset J. HLA- and H-2-associated variations of intra- and extracellular
87: 1894-8.
62. Feillet-Coudray C, Coudray C, Wolf FI, Henrotte JG, Rayssiguier Y, Mazur A. Magnesium metabolism in mice selected for high and low erythrocyte magne-sium levels. Metabolism 2004; 53: 660-5.
63. Schmitz C, Deason F, Perraud AL. Molecular com-ponents of vertebrate Mg2+-homeostasis regulation.
Magnes Res 2007; 20: 6-18.
64. Alexander RT, Hoenderop JG, Bindels RJ. Molecu-lar determinants of magnesium homeostasis: insights from human disease. J Am Soc Nephrol 2008; 19: 1451-8.
65. Quamme GA. Molecular identification of ancient and modern mammalian magnesium transporters. Am J
Physiol Cell Physiol 2010; 298: C407-29.
66. Meyer TE, Verwoert GC, Hwang SJ, Glazer NL, Smith AV, van Rooij FJ, Ehret GB, Boerwinkle E, Felix JF, Leak TS, Harris TB, Yang Q, Dehghan A, Aspelund T, Katz R, Homuth G, Kocher T, Rettig R, Ried JS, Gieger C, Prucha H, Pfeufer A, Meitinger T, Coresh J, Hofman A, Sarnak MJ, Chen YD, Uitterlinden AG, Chakravarti A, Psaty BM, van Duijn CM, Kao WH, Witteman JC, Gudnason V, Siscovick DS, Fox CS, Köttgen A, & Genetic Factors for Osteoporosis Consor-tium; Meta Analysis of Glucose and Insulin Related Traits Consortium. Genome-wide associa-tion studies of serum magnesium, potassium, and sodium concentrations identify six loci influenc-ing serum magnesium levels. PLoS Genet 2010; 6: e1001045.