Demonstration of a lightguide detector for liquid argon TPCs
The MIT Faculty has made this article openly available.
Please share
how this access benefits you. Your story matters.
Citation
Bugel, L., J.M. Conrad, C. Ignarra, B.J.P. Jones, T. Katori, T. Smidt,
and H.-K. Tanaka. “Demonstration of a Lightguide Detector for
Liquid Argon TPCs.” Nuclear Instruments and Methods in Physics
Research Section A: Accelerators, Spectrometers, Detectors and
Associated Equipment 640, no. 1 (June 2011): 69–75.
As Published
http://dx.doi.org/10.1016/j.nima.2011.03.003
Publisher
Elsevier
Version
Original manuscript
Citable link
http://hdl.handle.net/1721.1/108250
Terms of Use
Creative Commons Attribution-NonCommercial-NoDerivs License
Demonstration of a Lightguide Detector for Liquid
Argon TPCs
L. Bugel, J.M. Conrad, C. Ignarra, B.J.P. Jones, T. Katori, T.Smidt and H.-K. Tanaka1
Physics Dept., Massachusetts Institute of Technology, Cambridge, MA 02139
Abstract
We report demonstration of light detection in liquid argon using an acrylic lightguide detector system. This opens the opportunity for development of an inexpensive, large-area light collection system for large liquid argon time projection chambers. The guides are constructed of acrylic, with TPB embedded in a surface coating with a matching index of refraction. We study the response to early scintillation light produced by a 5.3 MeV α. We measure coating responses from 7 to 8 PE on average, compared to an ideal expectation of 10 PE on average. We estimate the attenuation length of light along the lightguide bar to be greater than 0.5 m. The coating response and the attenuation length can be improved; we show, however, that these results are already sufficient for triggering in a large detector.
1. Introduction
Scintillation photons are copiously produced when a charged particle tra-verses liquid argon. This occurs through two processes [1, 2, 3]. An argon atom may be excited and then form a dimer which radiatively decays,
Ar∗+ Ar → Ar∗2→ 2Ar + γ. (1)
Alternatively, an argon atom may be ionized, then form an ionized molecule, which subsequently picks up an electron through recombination, forming a dimer which radiatively decays,
Ar++ Ar → Ar+2 + e− → Ar∗2→ 2Ar + γ. (2) Singlet and triplet states of Ar∗2 will be formed with with emission lifetimes of 6 ns and 1.6 µs, respectively. The emitted photon has wavelength in the vacuum ultraviolet, at 128 nm [4].
1Now at Brookhaven National Laboratory
In an ultra-large liquid argon time projection chamber (LArTPC), the early scintillation light can be used as a trigger for neutrino events or as a veto for cosmic rays. The light must be shifted from the vacuum ultraviolet to the visible in order to be detected. The most common LArTPC designs use 8 inch or larger cryogenic phototubes, which collect light that has been shifted to the visible by 1,1,4,4-Tetraphenyl-1,3-butadiene (TPB) [4, 5].
In this paper, we present a new, cost-effective alternative for light collection in LArTPCs. This uses lightguides which are made from extruded acrylic cov-ered with a polystyrene skin embedded with TPB. Multiple acrylic bars can be bent to guide light adiabatically to a single 2 inch cryogenic phototube (PMT). Lightguides have a thinner profile than the PMT systems, occupying less space in an an LAr vessel and potentially allowing more fiducial volume. This is important in the case of very large detectors proposed for long baseline neutrino experiments [6], where fiducial volume is at a premium.
In the discussion below, we describe the design of the lightguides and the teststand. We describe the conversion from measured waveform pulseheight to photoelectrons (PE). We predict the “ideal” average signal achievable with the present design. We compare this to the measured value. We consider the losses due to transport along the bar. Lastly, we consider how the guides might be used to form paddles for installation in a large liquid argon detector to provide a pulseheight-based trigger.
2. Design of Lightguides and Teststand
To achieve total internal reflection, thereby trapping and guiding the light, the material in which the light is produced must have a higher index of refraction than the surrounding medium. We use acrylic, which has an index of refraction of n = 1.49. Therefore, the TPB must be embedded in a matrix with a good match in n. This is applied as a smooth skin on the acrylic bars. We use polystyrene which has an index of refraction of n = 1.59. The bar is immersed in liquid argon, which has an index of refraction in visible wavelengths of n = 1.23 [7].
The lightguides consist of McMaster-Carr extruded rectangular acrylic bars. For these tests, the dimensions are 0.48 cm (3/16 inch) × 2.54 cm (1 inch) × 55 cm (21.6 inch). The acrylic is resilient to cryogenic temperatures and shows no evidence of crazing. The ends of the lightguides are polished.
The TPB-embedded skin is applied as a liquid along the length of the bar. TPB and polystyrene are combined in a 1:3 ratio by mass and dissolved in toluene. The polystyrene is Dow Styron 663. The TPB doping is limited to this level because we have found that more equal ratios of TPB to polystyrene lead to crystallization of the TPB, which spoils the optical properties of the skin. TPB has negligible self-absorption [8], and so, in principle, guiding can have low attenuation.
This TPB-polystyrene mixture is sprayed onto the acrylic bar using a high volume low pressure (HVLP) gravity feed spray gun running on dry air at 35 psi. The design in this paper used a single coat. The bars are not buffed.
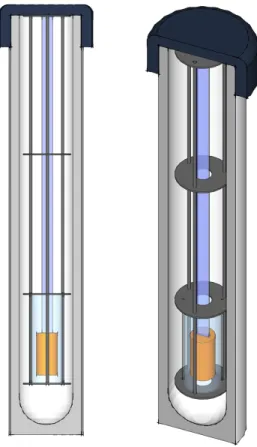
Figure 1: Two views of the dewar teststand showing the lightguide and PMT.
One expects less visible light per UV photon from TPB embedded in a matrix compared to TPB which is evaporatively applied, because the material of the matrix will absorb some UV photons. We have tested the light-response of the coating using a vacuum spectrometer which illuminates an acrylic plate at 128 nm. We compare the response of the TPB-polystyrene skin to pure TPB applied as an evaporative coating. We find the ratio of light from our TPB-polystyrene mix to evaporative coating is ∼ 10%. Higher ratios of TPB to polystyrene are found to give more light, but suffer from crystalization on the surface.
The light is guided to an R7725-mod Hamamatsu cryogenic PMT. The test system is shown in Fig. 1. In the liquid argon, which has density of 1400 kg/m3,
the PMT and the acrylic bar will both float. A single bar is held loosely in vertical position with the PMT below it in a guide tube. Because of buoyancy, the PMT presses up against the bar, which is held in place at the top, naturally making a good connection between the glass face of PMT and the acrylic bar.
The PMT is an 7725-mod Hamamatsu, 10-stage phototube [9] run at 1800 V. A cryogenic PMT is required because below 150 K, standard PMTs cease to produce signal [10]. This problem is solved in a cryogenic PMT with a platinum undercoating that allows electron replenishment at liquid argon temperatures.
The custom-designed base has a dynode chain made only with metal film resistors and NP0/C0G type capacitors to minimize temperature dependences. The PC board is made with Roger 4000 series woven glass reinforced mate-rial for lower contamination and copper-like thermal coefficient of expansion. The circuit elements were tested for resilience under many cryo-cycles. We use 95Ω RG180 cable, as is used in the MicroBooNE experiment. This Teflon-jacketed, 0.14” diameter cable is typically used in liquid Argon experiments to avoid contamination. The cable was successfully tested up to 5kV DC. The DC high voltage and the signal are run on this single cable, which minimizes feed-throughs into a cryogenic system. The signal is picked off using a blocking capacitor, located outside of the cryogenic system.
The teststand consists of a glass dewar which is 100 cm tall and 14 cm inner diameter. The PMT and bar are lowered into the dewar via a weighted stand so that the system has negative buoyancy in liquid argon. The entire system is in a light-tight box.
The light is produced via 5.3 MeV α particles produced from a210Po source
mounted in a plastic disk [11]. The total activity of the source was 925 Hz. However, the geometry of the source holder reduces the total number of αs that can be observed. The source is electroplated onto silver foil that is open-mounted (no window) in the recess, or “well,” of the plastic disk. The height of the well-wall is 3 mm. The αs which emerge into the well will traverse only 50µm in LAr, and so will not exit the well. To directly measure the count rate for αs leaving the source, we fit a small piece of solid scintillator into the well and attach this to a PMT. The rate was measured to be 359 ± 11 Hz.
The disk-source is mounted in a holder which can be moved along the bar, and which offsets the source from the face of the bar by a total of 6 mm. The holder is held in place by two screws which press against the bar. The geometry of the source-disk limits the acceptance for UV light produced in the argon to hit the bar. However, because of the close proximity between source and bar, if the UV light leaves the well, the photons will hit the bar.
The α source only produces a measurable rate of signal above background from the bar when immersed in liquid argon. We were not able to measure a rate above background from the source in either liquid nitrogen or in air. When running in liquid argon, if the liquid level is allowed to drop through evaporation, the signal from the α sources stops when the liquid level drops below the source.
Industrial grade liquid argon is used in this study. This has high levels of impurities, which can vary by factors of two to three between batches. Two body collisions with impurities (for example Ar∗2 +O2 → 2Ar + O2, and the
analogous process with N2) reduce the late scintillation light which is emitted
[12, 13].
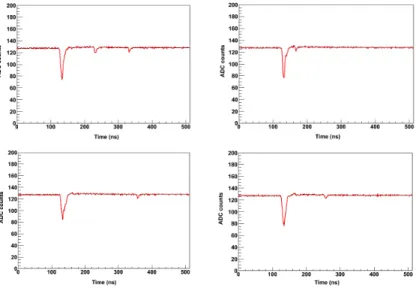
tra-Figure 2: Examples of waveforms after cuts described in Sec 3.1. The first pulse is early light which produces the trigger. The trigger level is set at a 15 ADC counts, which corresponds to just below 3 PE, as determined in Sec 3. The early pulses (with time constant of ∼ 6 ns) are produced by multiple UV photons impinging on the bar. Thus the early pulses vary in pulseheight. Single-PE late light pulses can be also be seen in these events.
ditional mode with record headers enabled. The channel is configured to have an input range of ±200 mV. A trigger is produced by a negative pulse with an amplitude that exceeds 15 ADC counts, which corresponds to a peak voltage of −23.44 mV. When a trigger is produced, 128 pre-trigger samples and 384 post-trigger samples are recorded at a sampling rate of 1 gigasample per sec-ond, leading to a total recorded profile of width 0.512 µs from both channels. We store the pulse profiles to disk for later analysis offline.
Figs. 2 and 3 provides some illustrative examples of event waveforms. The first pulse, which is required to be above the 15 ADC-count trigger, is consistent with the many photons expected for the early light. Despite the impurities in the industrial grade argon, we do observe late-light pulses in the events.
3. Conversion to Photoelectrons
3.1. Analysis Cuts for the Calibration Samples
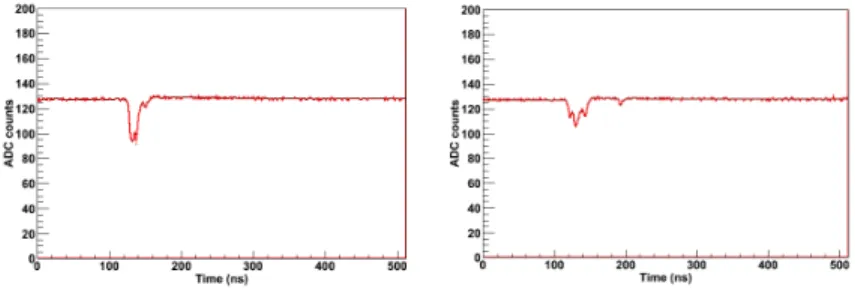
In order to perform the calibration, “clean pulses,” such as those shown in Fig. 2 are required. However, the majority of events have merged pulses, such are shown in Fig. 3. We apply cuts to obtain clean pulses as described in this section. Because the cuts are strict, we use a high statistics run for this study. In this run, data were taken with the source at 20 cm from the PMT face.
The first analysis will use the late light. We identify late pulses as those that occur > 50 ns after the trigger, to reduce overlap with wide early signals, such
Figure 3: Examples of waveforms removed by the cuts described in Sec. 3.1.
as the case shown in Fig. 3 (left). A late pulse is identified if the signal is 2 or more ADC counts below the baseline, which cuts noise from the ADC that is at the single count level. The result is a clean sample of low PE pulses with no hardware trigger threshold, as is seen in Fig. 2.
The second analysis, which cross-checks the first, will use early pulses. To isolate early pulses where the signals arrived nearly simultaneously, we place “early pulse cuts” on the events:
• the full-width-half-max is < 12 ns;
• the pulse is consistent with a single peak rather than multiple peaks. The search for multiple peaks is initiated by a change of +2 counts from the first minimum in ADC counts. Further peaks are identified if there are either two consecutive changes of −1 ADC counts per time-bin or one change of −2 or more ADC counts per time-bin.
These cuts result in the clean early pulses seen in Fig. 2. However, nearly 80% of the events are removed by the early pulse cuts. As a result, using the high statistics sample for this study is necessary.
3.2. Calibration with Late Light
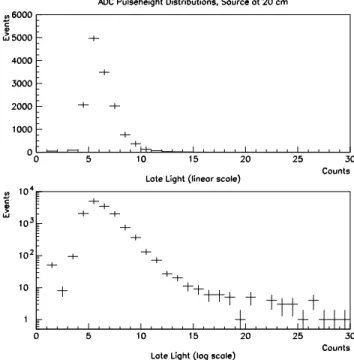
Late light can be used to calibrate the relationship between ADC counts and 1 PE. The distribution of pulseheights for late light, as a function of ADC count, is shown on a linear scale in Fig. 4 (top) and on a log scale on Fig. 4 (bottom). The first bin is empty due to the analysis requirement which removes ADC noise. The events at two ADC counts, visible in the log plot, are consistent with the tail of the ADC noise distribution, indicating that the ADC is sensitive to low count events. The distribution is asymmetric with a peak at 5.7 ADC counts.
3.3. Calibration with Early Light
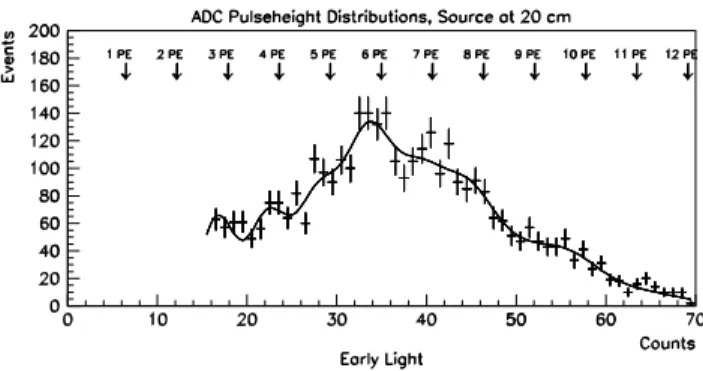
Fig. 5 shows the distribution of early light pulseheights in ADC counts. The distribution appears to have peaks, which are seen in all pulseheight measure-ments when cuts are applied. This would arise if the data represent a collection
Figure 4: Late light distributions from a high statistics measurement at 20 cm used to study the ADC-pulseheight-to-PE Conversion. Late light analysis cuts require bin 1 to be zero. Top: Pulseheights, in ADC counts, linear scale; Bottom: Same plot log scale.
of Poisson distributions, each centered at an integer number of PE. To test this model, the data are fit to Gaussians, as an approximation to Poissons, with means required to be at integral multiples of the same parameter. The resulting fit gives a conversion of 5.7 ADC counts per PE, which is in agreement with the calibration from the late light peak. The arrows in Fig. 5 indicate the fit position of each PE peak. In the fit, the Gaussian widths are required to vary according to the square root of the number of PE, multiplied by a common overall parameter, found to be 1.4 ADC counts. The χ2/DOF is 1.4, which is
good given the simplicity of the model.
3.4. Final Calibration: Pulseheights to PE
The late and early light analyses are consistent with 5.7 ADC counts per PE. Therefore, in the following discussion, the pulseheights are rebinned such that ADC counts 3 to 8 correspond to 1 PE, 9 to 14 correspond to 2 PE, and so forth.
Figure 5: Early light distributions from a high statistics measurement at 20 cm used to study the ADC-pulseheight-to-PE Conversion. Distribution is shown in ADC counts, with cuts described in the text. Fit is to ten equally spaced Gaussians, as discussed in the text, corresponding to PE peaks 3 to 12. Arrows indicate the peak position based on the fit.
4. Calculation for Ideal Performance
Our goal is to compare the actual performance of the lightguides to predicted performance. The performance of the lightguide depends upon the response of the bar to the UV light, the efficiency for capturing the visible light, the effi-ciency for guiding the light to a PMT, and the effieffi-ciency for the PMT response. The ideal bar would have 100% efficiency for guiding the light. In this section we consider the other contributions, in order to calculate the ideal performance of the system in the absence of attenuation. The parameters used in the calcu-lations in this section are summarized in Tab. 1. The prediction of the average PE proceeds in two parts: 1) the calculation of the UV light per α which will reach the guide; 2) the calculation of the light which will capture and produce photoelectrons.
In order to calculate the UV photons impinging on the guide, we assume that each 5.3 MeV α exits the source without energy loss. In the case of liquid argon, there is a suppression of scintillation light for a heavily ionizing particle compared to a minimum ionizing particle (MIP) [17], which is (72 ± 4)% [14]. A MIP produces 7600 UV photons per MeV in the first 10 ns [14], the time-frame most useful for triggering and vetoing. Combining this information, 3 × 10⁴
prompt photons are produced.
The UV light is emitted isotropically in the LAr. Because the α travels a negligible distance in the LAr, the light is produced within the well, just outside of the silver foil. The walls and back of the well of the disk obstruct the light, limiting the acceptance for light to hit the bar. Based on the geometry of the
Parameters Used in Ideal Calculations
# Parameter Value in Calc. Source See Sec(s)
Related to UV light production
1 Early (< 10 ns) UV γ/MeV (MIP) 7600 Ref. [14] 4 & 6 2 Light reduction factor for α 0.72 Ref. [14] 4 3 Light reduction factor for p 0.81 Ref. [15] 6
Related to Geometry of Teststand
4 Acceptance of UV light 0.33 calculated 4
Conversion and Capture in the Bars
5 UV/visible γs, evaporative coat 1.0 Ref. [16] 4 & 6 6 Response, bar coating to evap. 0.1 measured 4 & 6
7 Capture fraction 0.05 calculated 4 & 6
PMT response
8 QE of 7725 PMT 0.25 Ref. [9] 4 & 6
9 Cryogenic modification factor 0.8 Ref. [10] 4 & 6 Combining Parameters to Calculate Efficiencies
Efficiency Value Combined See Sec(s)
Params.
10 Efficiency to convert and capture 0.005 5 × 6 × 7 4 & 6 Total Ideal Efficiency 0.001 8 × 9 × 10 4 & 6 Table 1: Parameters used in ideal calculations presented in Secs. 4 and 6 for light production and bar acceptance. # is the parameter number appearing in the text and in the last two rows of this table, under “Combined Params.” “MIP” means minimum ionizing particle. “QE” is quantum efficiency. “Measured” (“calculated”) indicates that this is a measurement (calculation) by the authors described in the text.
well, we find that 33% of the light should be within the acceptance of the bar, with an estimated 20% systematic error due to the irregular shape of the source. Based on the above, we find 1 × 10⁴UV photons hit the bar, per α emitted into the LAr (parameters 1 × 2 × 4 in Tab. 1, multiplied by 5.3 MeV).
Next we must calculate the efficiency of the bar to shift UV light and capture visible light. We will assume that the surface of the bar is fully covered with TPB-polystyrene coating. We begin with the efficiency for pure TPB to convert 128 nm UV to visible light. This was measured by studying evaporative coatings by Ref. [16]. Next, we must account for the loss of light due to the additional polystyrene in our coating. We have measured the relative response of coatings to evaporative coating using a vacuum spectrometer. The reduction factor is ∼ 10% with a spread of about 25% in the measurements. Once the visible light is emitted, only a small fraction will be captured. The relative indices of refraction lead to 5% capture efficiency in the bar. The total efficiency of the bar, in the case of infinite attenuation length, is 0.5% (parameters 5 × 6 × 7 on Tab. 1).
Finally, we also must consider the quantum efficiency (QE) of the PMT. The 7725 tube listed in the Hamamatsu catalogue [9], which is not cryogenic, has a 25% QE at the wavelengths of TPB emission. Modified tubes for cryogenic running have been shown to have lower QE [10]. We will assume a QE of 20±2% for the 7725-mod PMT.
efficiency of the bar with the QE of the PMT. The result is an efficiency of 0.1%. Multiplying by the predicted UV photons impinging on the bar, one predicts an average of 10 PE with a systematic error of about 33%. This is the predicted average PE for a bar, with a perfectly smooth, full-coverage TPB-polystyrene coating.
5. Performance Measurements
In the real system, the light which is detected is most affected by the quality of the coating. Small uncoated regions will reduce the number of visible photons produced per UV photon impinging on the bar. Roughness in the coating will cause loss of visible light as it is guided to the PMT. We try to separate these issues through two measurements. First, we measure the the light production at a position which is as near to the PMT as possible. The average of this distribution can be directly compared to the calculated ideal average. Differ-ences would arise from small uncoated regions on the surface of the bar. Next, we make measurements with the source placed at various positions along the bar. In principle, this would allow a measurement of the attenuation along the bar. In practice, this result is so complicated by local variations in the coating coverage at each position that it is difficult to achieve a good attenuation length measurement.
5.1. Test of Coating Variation at 10 cm
For an ideal light guide, with no attenuation, the PE distribution is predicted to have a mean at 10 PE. To test the actual response, we must use a source placed at 10 cm from the PMT, due to the design of the test stand. Assuming long attenuation lengths, the result should be comparable to the ideal. We will revisit this assumption in the discussion of attenuation length (Sec. 5.2).
In this test, we repeat the following process: the source is placed onto the rod, data are taken, and the source is then removed. Each time, the source is replaced to within ±0.25 cm of the vertical position. The lateral position is chosen randomly, but near to the center of the bar. This allows us to study variations in the coating in the local area of the measurement.
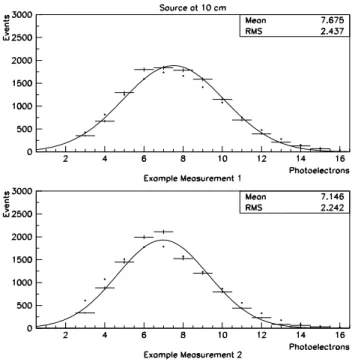
The observed variations were large. The peaks of the PE distributions, which are presented without cuts, varied between 7 and 8 PE. Fig. 6 shows two examples. The variations most likely indicate that some regions of the surface are more fully covered with TPB-polystyrene coating than other areas. This can be further investigated in the future, as our HVLP coating techniques improve. While the peaks of the distributions vary, qualitatively, the shapes are con-sistent. This can be seen in the two examples of Fig. 6. The distributions are asymmetric, favoring lower PE, as is emphasized when compared with Gaussian curves. In this sense, the distributions are Poisson-like. However, they are con-sistently more peaked than true Poissons, which are shown by the closed circles. This may be indicative of a systematic effect in our conversion to PE.
With the simple assumption of negligible attenuation of light over 10 cm, the performance is between 7 and 8 PE. The response is consistently less than ideal,
Figure 6: Two examples of PE distributions, measured at 10 cm, with no cuts applied. The mean and sigma of each data distribution appears on the plot. The difference in position of the two peaks may be due to variations in the coating in the local area; PE measurements are compared to the Gaussian fit and the Poisson prediction (dots).
but high enough to be useful, as we will show in Sec. 6. In the next section, we show that the low measured response may simply be a matter of extrapolation to zero position along the bar. However, the variations in the peak positions already point to gaps in the coating coverage. Less than 100% coverage would will reduce the overall response. Improving the surface coverage is the next goal in this R&D program.
5.2. Attenuation Along the Bar
Detected light from points along the bar is a combination of light produced at the source and light lost during transport along the bar. In the previous section, we showed that light production has large variations. Separating this from effect from light loss along the bar is very difficult. Therefore, in this section we extract only qualitative information from measurements with the present design.
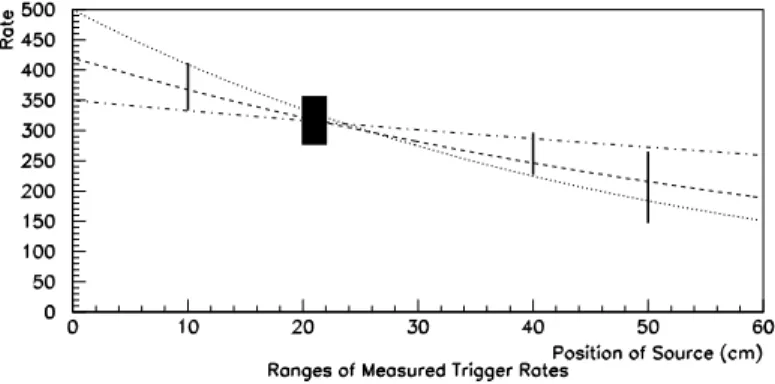
We measure the attenuation length by comparing trigger rates as the source is moved along the bar. Rates are background subtracted, but no other cuts
Figure 7: Ranges of rate measurements as a function of source position along the bar. Multiple measurements were made at 10, 20, 40 and 50 cm, and then through the 20 to 22 cm region. The exponentials indicates attenuation length of 50 cm (dotted), 75 cm (dashed) and 200 cm (dot-dashed).
are applied. Backgrounds, which are primarily cosmic rays, are measured with no-source runs.
Multiple measurements were made at 10, 20, 40 and 50 cm. A scan was made in the region between 20 and 22 cm. Each time a measurement is made, the source is removed and re-attached.
At any given position for the source on the bar, multiple measurements resulted in a range of rates, as was expected given the results of Sec. 5.1. In Fig. 7 we use the height of the boxes to indicate the range of measured rates at each location. The variations are on the order of 10% at each point, which is consistent with the variation in peak position presented in Sec. 5.1.
As a result of these variations, we can only obtain a qualitative sense of the attenuation length. On the assumption that the attenuation length can be described by a single exponential, Fig. 7 shows curves for 50, 75 and 200 cm attenuation length. As a conservative estimate, the attenuation length is >50 cm in this simple model.
Revisiting the assumption in Sec 5.1 of negligible attenuation over 10 cm, the extrapolation to 0 cm may indicate a correction between zero and ∼20%. However, we note that of the three examples shown, the extrapolation that is most consistent with the measured rate from the source described in Sec. 2 is the 200 cm attenuation length.
Figure 8: Illustration of multiple bars bent to adiabatically guide light to a single PMT.
6. Discussion on Use in LArTPCs
One could instrument a large LArTPC detector with a trigger system con-structed from the acrylic bars. Here, we consider the prospects for building such a system today, given the capability we present in this paper. This sets a minimum for what can be accomplished with such a system, since the bars can surely be improved in the future.
The basic detector element will be a paddle constructed of eight 2.54 cm width bars with a 1 m long active area. At the top, the uncoated portion of the acrylic will be bent to form an adiabatic path for light to the PMT (see Fig. 8). If 8 bars come to one 2 inch PMT, then the collection area of this paddle is 2032 cm2. We consider collection needed for a volume of 250 cm × 250 cm × 1000 cm, and a surface area of 1.1 × 106 cm2, which is the size of the MicroBooNE Experiment [5].
Based on the measurements presented in Secs. 5.1 and 5.2, we assume that by choosing bars with highest quality coating, we can achieve 8 PE on average and with a 2 m attenuation length. This results in 80% of the ideal expectation and an average transmission along the bar of 77%, hence an overall reduction factor of 60%. While these assumptions are slightly aggressive, the bars are very inexpensive to produce and so a plan to choose only bars with the best response is feasible.
For the sake of discussion, we will assume the trigger will be based on summed pulses passing an ADC theshold. We determine the paddle coverage required to trigger on particles with > 99% efficiency, which requires a threshold of less than 1 PE and at least 5 PE detected on average. We show that for 40 MeV protons, this is straightforward to achieve today. For the case of 5 MeV electrons, a factor of two improvement in the paddle response is desirable.
6.1. Example 1: Efficient triggering on a 40 MeV proton
Low energy neutral current elastic (NCEL) scattering events which produce a proton with 40 MeV of kinetic energy are used as the benchmark for light collection in the MicroBooNE experiment [5]. To examine the feasibility of meeting this benchmark with paddles, we first calculate the coverage required if we had ideal paddles, using the parameters in Tab. 1. We then adjust for the real response reported in Secs. 5.1 and 5.2. Lastly, we correct for factors related to running within a TPC, including suppression due to the electric field.
Protons produce 81% less scintillation light than a MIP particle (parameter 3 in Tab. 1) [15]. To obtain the total UV photons produced by a 40 MeV proton, multiply parameters 1 × 3 in Tab. 1 by 40 MeV to get 2.5 × 10⁵ UV photons.
Next, we convert the number of UV photons to detected PE in an ideal paddle. Begin by considering a detector with 100% coverage by ideal paddles, which have a total efficiency of 0.1% (last row of Tab. 1). In this case, 250 PE would be detected. No LArTPC can have 100% coverage because materials of the HV cage and TPC intercept light. Also, to save cost and effort, one would only install sufficient coverage to guarantee efficient triggering. In the case of the ideal paddles, this means that only 2% coverage is required to detect 5 PE on average. This corresponds to 11 paddles.
As discussed above, we assume that we can select bars which deliver 8 PE on average and have a 2 m attenuation length. Combining these two effects results in a reduction factor of 60% compared to the ideal case. As a result, 18 paddles will be required to collect 5 PE per 40 MeV proton on average.
The application of an electric field, which is necessary for charge collection in an LArTPC, suppresses scintillation light. From Fig. 2 of Ref. [18], the suppression factor will be about 66%. As a result, 27 paddles are required.
This calculation omitted some factors specific to the design of a given LArTPC. For example, the paddles would most conveniently be placed behind the TPC plane, where there is no electric field. In this location TPC wires intercept the light. This effect depends on the wire spacing and diameter, and the number of wire planes. In MicroBooNE, about 80% of the light is transmitted through the wires. A second design-specific issue is reflections of the UV light, which depends upon the materials in the LArTPC. ICARUS found that reflections increased the observed light by about 20% [4]. If we assume that design-specific effects roughly cancel, then about 30 paddles are required to assure efficient triggering on a 40 MeV proton.
6.2. Example 2: Efficient triggering on a 5 MeV Electrons
Efficient triggering on 5 MeV electrons produced by supernova burst events or solar neutrino interactions may be required in a future LArTPC. At 5 MeV, the electron is a MIP and so 3.8 × 10⁴ UV photons are expected. In the ideal
case, for 100% coverage, 38 PE will be observed, and 13% coverage is required to assure 5 PE on average. Applying the correction factors for measured-to-ideal response and attenuation length yields 28% coverage. Once the factor of 66% is applied for loss of light due to the electric field, 42% coverage is required with today’s lightguide technology.
It is most convenient to place paddles behind the TPC plane, which repre-sents 22% of the surface area. If we restrict installation to only this space, then we require ×2 better response from the paddles. This may be achieved by a number of improvements. The first is to produce paddles which meet the ideal calculation and have negligible attenuation losses. This ideal calculation was for a 3-to-1 polystyrene to TPB mixture, by weight. Improving this ratio, while avoiding crystallization, would increase the emitted light per UV photon. Also, we must investigate PMTs with increased quantum efficiency [19], and other efficient light collection technologies, such as silicon photomultipliers [20].
7. Conclusions
In conclusion, lightguides can provide a cost effective alternative to the present light collection system in LArTPCs. This paper has demonstrated first light collection using acrylic lightguides in argon. We have begun measuring and optimizing the relevant parameters. Improvement in the quality of the coating coverage and the smoothness of the coating have been identified as im-portant issues to be addressed with future R&D. Nevertheless, we have shown that with the present performance, paddles made from these bars are efficient for triggering on 40 MeV NCEL events.
Acknowledgments
The authors thank the Guggenheim Foundation and the National Science Foundation for support. We thank Lindley Winslow for contributions to the DAQ code. We appreciated input from Sten Hansen and Stephen Pordes, of Fermilab. We thank Charlie Abbott for coating the bars. We thank the members of the MicroBooNE PMT Group, Bruce Baller and Stuart Mufson for valuable comments on this paper.
References
[1] M. Martin. Exciton Self Trapping in Rare Gas Crystals. J. Chem. Phys., 54:3289, 1971.
[2] A.G. Molchanov. Lasers in the Vacuum Ultraviolet and in the X-ray Re-gions of the Spectrum. Sov. Phys. Usp, 15:124, 1972.
[3] S. Kubota et al. Recombination Luminescence in Liquid Argon and Liquid Xenon. Phys. Rev. B, 17:2762, 1978.
[4] M. Antonello et al. Analysis of Liquid Argon Scintillation Light Signals with the ICARUS T600 Detector. ICARUS-TM, 06-03, 2006.
[5] H. Chen et al. Proposal for a New Experiment Using the Booster and NuMI Neutrino Beamlines: MicroBooNE. FERMILAB-PROPOSAL-0974.
[6] V. Barger et al. Report of the US Long Baseline Neutrino Experiment Study. 2007.
[7] A. C. Sinnock and B. L. Smith. Refractive Indices of the Condensed Inert Gases. Phys. Rev., 181:1297–1307, 1969.
[8] I. B. Berlman. Handbook of Fluorescence Spectra of Aromatic Molecules. Academic Press, 2nd ed., 1971.
[9] See http://sales.hamamatsu.com/index.php?id=13226699.
[10] T. Kato et al. Performance of a Photomultiplier at Liquid-helium Temper-ature. Nucl. Instr. and Meth. A, 621:437–442, 2010.
[11] See http://www.unitednuclear.com/index.php?main page=index&cPath=2 5, Individual Isotope Source (Alpha Only).
[12] R. Acciarri et al. Oxygen Contamination in Liquid Argon: Combined Effects on Ionization Electron Charge and Scintillation Light. JINST, 5:P05003, 2010.
[13] R. Acciarri et al. Effects of Nitrogen Contamination in Liquid Argon. Nucl. Phys. Proc. Suppl., 197:70–73, 2009.
[14] T. Doke et al. Estimation of Absolute Photon Yields in Liquid Argon and Xenon for Relativistic (1 mev) Electrons. Nucl. Instr. and Meth. A, 291:617–620, 1990.
[15] T. Kato et al. Scintillation Yield in Liquid Argon for Non-relativistic Pro-tons and Helium Ions. Nucl. Instr. and Meth. A, 433:612–622, 1999. [16] V. Gehman. Private communication, DNP Meeting, 2010.
[17] A. Hitachi et al. Scintillation and Ionization Yields for α Particles and Fission Fragments in Liquid Argon. Phys. Rev. A, 35:3956, 1987.
[18] S. Kubota et al. Dynamical Behavior of Free Electrons in the Recombina-tion Process in Liquid Argon, Krypton and Xenon. Phys. Rev. B, 20:3486, 1979.
[19] R. Mirzoyan et al. Enhanced Quantum Efficiency Bialkali Photomultiplier Tubes. Nucl. Instr,. and Meth, A, 572:449–453, 2006.
[20] P.K. Lightfoot et al. Characterisation of a Silicon Photomultiplier Device for Applications in Liquid Argon Based Neutrino Physics and Dark Matter Searches. J. Inst., 3:10007, 2008.