HAL Id: hal-02675796
https://hal.inrae.fr/hal-02675796
Submitted on 31 May 2020
HAL is a multi-disciplinary open access archive for the deposit and dissemination of sci-entific research documents, whether they are pub-lished or not. The documents may come from teaching and research institutions in France or abroad, or from public or private research centers.
L’archive ouverte pluridisciplinaire HAL, est destinée au dépôt et à la diffusion de documents scientifiques de niveau recherche, publiés ou non, émanant des établissements d’enseignement et de recherche français ou étrangers, des laboratoires publics ou privés.
in ovarian follicles
François Clement, Danielle Monniaux, John Stark, K. Hardy, J.C. Thalabard,
S. Franks, D. Claude
To cite this version:
François Clement, Danielle Monniaux, John Stark, K. Hardy, J.C. Thalabard, et al.. Mathematical model of FSH-induced cAMP production in ovarian follicles. AJP - Endocrinology and Metabolism, American Physiological Society, 2001, 281 (1), pp.E35-E53. �hal-02675796�
281:35-53, 2001.
Am J Physiol Endocrinol Metab
Claude
You might find this additional information useful...
29 articles, 18 of which you can access free at:
This article cites
http://ajpendo.physiology.org/cgi/content/full/281/1/E35#BIBL
on the following topics:
http://highwire.stanford.edu/lists/artbytopic.dtl
can be found at
Medline items on this article's topics
Computer Science .. Mathematical Modeling Physiology .. Ovarian Follicle
Oncology .. Gonadotropins Physiology .. Luteinizing Hormone
Physiology .. Follicle-Stimulating Hormone
Biophysics .. Follicle-Stimulating Hormone Receptors
including high-resolution figures, can be found at:
Updated information and services
http://ajpendo.physiology.org/cgi/content/full/281/1/E35
can be found at:
AJP - Endocrinology and Metabolism
about
Additional material and information
http://www.the-aps.org/publications/ajpendo
This information is current as of September 3, 2010 .
http://www.the-aps.org/.
20814-3991. Copyright © 2001 by the American Physiological Society. ISSN: 0193-1849, ESSN: 1522-1555. Visit our website at organization. It is published 12 times a year (monthly) by the American Physiological Society, 9650 Rockville Pike, Bethesda MD publishes results of original studies about endocrine and metabolic systems on any level of
AJP - Endocrinology and Metabolism
on September 3, 2010
ajpendo.physiology.org
Mathematical model of FSH-induced cAMP production
in ovarian follicles
F. CLE´ MENT,1D. MONNIAUX,2 J. STARK,4K. HARDY,5
J. C. THALABARD,3S. FRANKS,6AND D. CLAUDE1
1Institut National de Recherche en Informatique et Automatique, Unite´ de Recherche de
Rocquencourt, Domaine de Voluceau, Rocquencourt, 78153 Le Chesnay Cedex;2Unite´ de Physiologie
de la Reproduction et des Comportements, UMR 6073 Institut National de la Recherche
Agronomique-Centre National de la Recherche Scientifique-Universite´ F. Rabelais de Tours, 37380 Nouzilly;3Unite´ de Formation et de Recherche Necker, Biostatistiques-Informatique Me´dicale,
Endocrinologie-Me´decine de la Reproduction, Universite´ Paris V, Groupe Hospitalier Necker-Enfants Malades, 75743 Paris, France;4Centre for Nonlinear Dynamics and its Applications, University
College London, London WC1E 6BT;5Division of Pediatrics, Obstetrics and Gynecology, Department
of Reproductive Science and Medicine, Imperial College of Science, Technology and Medicine, Hammersmith Hospital, London W12 0NN; and6Division of Pediatrics, Obstetrics and Gynecology,
Department of Reproductive Science and Medicine, Imperial College of Science, Technology and Medicine, St. Mary’s Hospital Medical School, London W2 1PG, United Kingdom
Received 30 June 2000; accepted in final form 14 February 2001
Cle´ment, F., D. Monniaux, J. Stark, K. Hardy, J. C. Thalabard, S. Franks, and D. Claude. Mathematical
model of FSH-induced cAMP production in ovarian folli-cles. Am J Physiol Endocrinol Metab 281: E35–E53, 2001.—During the terminal part of their development, ovar-ian follicles become totally dependent on gonadotropin sup-ply to pursue their growth and maturation. Both gonado-tropins, follicle-stimulating hormone (FSH) and luteining hormone (LH), operate mainly through stimulatory G pro-tein-coupled receptors, their signal being transduced by the activation of the enzyme adenylyl cyclase and the production of second-messenger cAMP. In this paper, we develop a mathematical model of the dynamics of the coupling between FSH receptor stimulation and cAMP synthesis. This model takes the form of a set of nonlinear, ordinary differential equations that describe the changes in the different states of FSH receptors (free, bound, phosphorylated, and internal-ized), coupling efficiency (activated adenylyl cyclase), and cAMP response. Classical analysis shows that, in the case of constant FSH signal input, the system converges to a unique, stable equilibrium state, whose properties are here investi-gated. The system also appears to be robust to nonconstant input. Particular attention is given to the influence of biolog-ically relevant parameters on cAMP dynamics.
signal transduction; granulosa cells; follicle-stimulating hor-mone; cyclic adenosine monophosphate
FOLLICULOGENESIS IS THE PROCESS of growth and
func-tional maturation undergone by ovarian follicles, from the time they leave the pool of primordial (quiescent) follicles until ovulation, at which point they release a
fertilizable oocyte. Most of the developing follicles never reach the ovulatory stage but degenerate by a process known as atresia (12). The gonadotropic hor-mones follicle-stimulating hormone (FSH) and lutein-izing hormone (LH) play a major role in the regulation of terminal follicular development through the control of proliferation and differentiation of the granulosa cells surrounding the oocyte (29). Gonadotropin secre-tion is, in turn, modulated by granulosa cell products such as estradiol and inhibin. During the follicular phase of the ovarian cycle, negative feedback is respon-sible for reducing FSH secretion, leading to the degen-eration of all but those follicles selected for ovulation. Finally, positive feedback is responsible for triggering the LH ovulatory surge leading to ovulation (10). Both FSH and LH operate mainly through G protein-cou-pled transmembrane receptors, transducing their sig-nal by activation of the enzyme adenylyl cyclase and production of second-messenger cyclic adenosine mono-phosphate (cAMP) (30).
In previous studies (6, 7), we investigated the diver-gent commitment of granulosa cells toward prolifera-tion, differentiaprolifera-tion, or apoptosis in response to their hormonal environment. Under cumulative exposure to gonadotropins, granulosa cells progressively lose their ability to proliferate and acquire a fully differentiated state. The accumulation of intracellular cAMP beyond a threshold seems to be a key point in cell cycle arrest (26), because it is believed to lead to the activation of cyclin kinase inhibitors (11). We thus believe that a better understanding of gonadotropin-induced cAMP
Address for reprint requests and other correspondence: F. Cle´m-ent, Institut National de Recherche en Informatique et Automatique, Unite´ de Recherche de Rocquencourt, Domaine de Voluceau, Roc-quencourt, BP 105, 78153 Le Chesnay Cedex, France (E-mail: Frederique.Clement@inria.fr).
The costs of publication of this article were defrayed in part by the payment of page charges. The article must therefore be hereby marked ‘‘advertisement’’ in accordance with 18 U.S.C. Section 1734 solely to indicate this fact.
0193-1849/01 $5.00 Copyright©2001 the American Physiological Society
http://www.ajpendo.org E35
on September 3, 2010
ajpendo.physiology.org
production will help gain insight into changes in the rate of differentiation among granulosa cells during terminal development (8).
In CONSTRUCTION OF A SIGNAL TRANSDUCTION MODEL, we
describe the mathematical model after stating the bi-ological assumptions on which it is based; inSTABILITY ANALYSIS FOR CONSTANT FSH INPUT, we focus on the
anal-ysis of the model in the case of a constant FSH level;
CONTROL OF FSH-INDUCED CAMP LEVELS is devoted to the
numerical application of the model; the physiological implications of these results are discussed in DISCUS -SION; and mathematical details are given inAPPENDIX.
CONSTRUCTION OF A SIGNAL TRANSDUCTION MODEL
Physiological Background: Transduction of the Gonadotropic Signal in Granulosa Cells
Terminal follicular development is strictly depen-dent on FSH supply. Before the selection of the follicle for ovulation, granulosa cells are responsive only to FSH. As follicular maturation progresses, the coupling between FSH receptor stimulation and the activation of adenylyl cyclase becomes more and more efficient, leading to a steady increase in cAMP production (13). The accumulation of FSH-induced cAMP coincides with the appearance of and subsequent dramatic in-crease in LH receptors, allowing LH to act as a surro-gate for FSH in granulosa cells (36). Conversely, when gonadotropin, and especially FSH, plasma levels are too low to meet the follicle’s trophic requirements, uncoupling of receptor stimulation with cAMP produc-tion is one of the earliest events occurring during granulosa cell death and follicular atresia (15).
The binding of FSH to its transmembrane receptors triggers an intracellular signal via the heterotrimeric G proteins. The FSH-bound receptor activates the G ␣-stimulatory (G␣s) subunit, which interacts with
ade-nylyl cyclase to generate an increase in cyclic AMP. Once cAMP is synthesized, it either binds and acti-vates specific protein kinases such as protein kinase A or is degraded by cyclic nucleotide phosphodiesterase (PDE) (30).
The control of cAMP levels in granulosa cells in-volves both fast biochemical processes, such as binding and desensitization, occurring on a time scale of a few minutes, and slower physiological processes lasting hours or even a few days, which result mainly in changing the efficiency of the enhancement of cAMP synthesis by stimulated FSH receptors via adenylyl cyclase activation. The increase in this coupling effi-ciency is a progressive, hormonally regulated process (29), so that the degree of maturation of a follicle can be characterized by the average cAMP level in its granu-losa cells. The design of our model follows from the interactions between these contrasting biochemical and physiological dynamics. From here onward, we will focus on the dynamics of intracellular cAMP in an average granulosa cell from the time the follicle be-comes able to respond to FSH in term of cAMP produc-tion.
Biological Assumptions
The model is based on the following assumptions, which are supported by the available biological knowl-edge on FSH signal transduction in granulosa cells during the first part of terminal follicular development. Binding of FSH to its receptor (RFSH) results in the
formation of an active complex (XFSH)
FSH⫹ RFSHL|;
k⫹
k⫺
XFSH
Bound receptors activate adenylyl cyclase (E) through a conformational change in the associated G protein
E哭
XFSH
EFSH
Activated adenylyl cyclase (EFSH) synthesizes cAMP
from the substrate Mg2⫹ATP
Mg2⫹ATP⫹ E FSH¡
cAMP
cAMP is hydrolyzed into AMP by PDE cAMPO¡
kPDE
AMP
Bound receptors are subjected to a desensitization process through cAMP-mediated phosphorylation
XFSH¡
XpFSH
Phosphorylated inactive complexes (XpFSH) undergo
internalization into the cell, where receptors are disso-ciated from FSH
XpFSH¡ ki
Ri
Internalized receptors (Ri) are recycled back to the
cell membrane, whereas FSH is hydrolyzed
RiO¡ kr
RFSH
Consideration of only those reactions relevant to follic-ular development allows some simplifications to be made. Reactions generating short-lived intermediary species are neglected. In particular, the cycle of G protein activation/deactivation is not modeled explic-itly. The process of receptor synthesis is assumed to compensate both for intracellular receptor degradation and for the depletion of the receptor pool during cell division, so that the total number of FSH receptors in different states (free, active, phosphorylated, and in-ternalized) remains constant (4), leading to the
on September 3, 2010
ajpendo.physiology.org
ing cellular cycle for FSH receptors under different states
FSH⫹ RFSH º XFSH
1 2
Ri 4 XpFSH
Finally, cAMP-independent desensitization is not taken into consideration, because its behavior during the maturation of granulosa cells is not yet known. In addition, the amount of FSH is assumed to be suffi-ciently large that its concentration is unaffected by binding to receptors.
Model Equations
Let RFSH, XFSH, XpFSH, and Ri be, respectively, the
concentrations of free, bound active, bound inactive (phosphorylated), and internalized FSH receptors (ital-ics indicate concentrations). Let EFSH be the
concen-tration of activated adenylyl cyclase, and let cAMP be the concentration of intracellular cAMP. Let k⫹, k⫺, ki,
and kr be the rate constants for FSH binding, FSH
unbinding, bound complex internalization, and recep-tor recycling to the cell membrane, respectively. The function describes the (cAMP-dependent) rate of re-ceptor desensitization. The rates of change of the con-centrations are given by the following ordinary differ-ential equations dRFSH dt ⫽ k⫺XFSH⫹ krRi⫺ k⫹FSHRFSH (1) dXFSH dt ⫽ k⫹FSHRFSH⫺ 共 ⫹ k⫺兲XFSH (2) dEFSH dt ⫽ 关XFSH⫺ EFSH兴EFSH (3) dcAMP
dt ⫽ EFSH⫺ kPDEcAMP (4)
dXpFSH
dt ⫽ XFSH⫺ kiXpFSH (5)
dRi
dt ⫽ kiXpFSH⫺ krRi (6)
Equations 1, 4, and 6 result from applying the
prin-ciple of mass action. In Eq. 4, ATP is treated as a nonlimiting substrate at a constant concentration, and its effect is included in the kinetic constant . In the same way, the concentration of the enzyme PDE is included in kPDE.
The desensitization rate in Eqs. 2 and 5 is a Hill function of intracellular cAMP
共cAMP兲 ⫽ ␣cAMP
␥
␦␥⫹ cAMP␥
with saturation value (␣), half-saturating cAMP con-centration (␦), and slope of the increase in (␥) as real parameters.
This sigmoidal dependence accounts in a compact way for the phosphorylation cascade occurring down-stream of cAMP, including transmembrane receptors as phosphorylation targets. Thus phosphorylation in the model is assumed to be cAMP mediated in a dose-dependent, increasing, and saturated manner. On qualitative grounds, this choice was substantiated by the critical importance of cAMP-dependent postrecep-tor events for desensitization (21). On quantitative grounds, the Hill function allows either for a progres-sive effect of cAMP level or for a rather all-or-nothing effect, depending on the value of the slope parameter␥. Besides, the phosphorylation rate is assumed to be bounded by the saturation value ␣, which reflects the limits in the phosphorylation capacity resulting from the balance between phosphorylation through kinases and dephosphorylation through phosphatases.
Equation 3 governs the change in the coupling
vari-able EFSH and is designed to be understood from a
physiological rather than a biochemical viewpoint.  acts as a time scale parameter. Whenever it takes a low value ( ⬍⬍ 1), the changes in the coupling variable
EFSHare slower than those of the other variables of the
model. The amplification parameter measures the degree of signal amplification and represents the aver-age number of adenylyl cyclase molecules activated by one bound receptor at steady state.
The choice for the right-hand term of Eq. 3 is subject to the following physiological constraints, which make it specific to granulosa cells: 1) there is a basal concen-tration of activated adenylyl cyclase (E0 ⬎ 0), due to
minor constitutive activity of G proteins; 2) under cumulative exposure to FSH, the capacity for cAMP production in response to FSH stimulation increases during terminal follicular development (EFSH is an
increasing function as long as XFSH ⬎ EFSH); 3) the
increase in the efficiency of coupling is correlated with an increase in the follicle’s vulnerability toward FSH supply (as soon asXFSH⬍ EFSH, EFSHstarts
decreas-ing); 4) coupling and uncoupling are autoamplified processes, due to paracrine and autocrine mechanisms enhancing the follicular sensitivity to FSH (right EFSH
term of amplification).
Model Reduction
The total number of receptors remains constant; hence, Eqs. 1, 2, 5, and 6 are subject to the conservation law
RT⫽ RFSH⫹ XFSH⫹ XpFSH⫹ Ri (7)
where RT is the constant size of the global receptor
pool. We can thus replace Riin Eq. 1 by RT⫺ (RFSH⫹
XFSH⫹ XpFSH), reducing the system to five equations
dRFSH dt ⫽ 共k⫺⫺ kr兲XFSH⫺ 共k⫹FSH⫹ kr兲 ⫻ RFSH⫺ krXpFSH⫹ krRT (8) dXFSH dt ⫽ k⫹FSHRFSH⫺ 共 ⫹ k⫺兲XFSH (9) on September 3, 2010 ajpendo.physiology.org Downloaded from
dEFSH
dt ⫽ 关XFSH⫺ EFSH兴EFSH (10) dcAMP
dt ⫽ EFSH⫺ kPDEcAMP (11)
dXpFSH
dt ⫽ XFSH⫺ kiXpFSH (12) Initial values of the variables will be denoted, respec-tively, as R0, X0, E0, cAMP0, and Xp0.
Boundedness
A basic requirement for a physiological model to be plausible is that solutions should remain bounded for all time and that concentrations should remain non-negative. It is easy to verify (for details seeAPPENDIX,
Upper Bounds of Solutions) that, as long as kPDE⬎ 0,
this is the case in the above model for constant FSH input, so that, for any⑀ ⬎ 0, there exists a T ⱖ 0, such that for all tⱖ T
RFSHⱕ RT, XFSHⱕ RT,
XpFSHⱕ RT, EFSHⱕ RT⫹ ⑀,
cAMPⱕRT kPDE
⫹ ⑀
If kPDE⫽ 0, there is no mechanism for removing cAMP
from the system; hence, cAMP concentrations can grow without bound. This is obviously not a physiologically realistic case.
STABILITY ANALYSIS FOR CONSTANT FSH INPUT
Quasi-Steady-State Model and Steady States
When ⬍⬍ 1, the changes in RFSH, XFSH, cAMP and
XpFSH can be considered fast compared with the
change in EFSH. Applying a quasi-steady-state
approx-imation to Eqs. 9, 11, and 12 in case of constant FSH input leads respectively to the following relations
R夹FSH⫽ 共夹⫹ k ⫺兲 k⫹FSH X 夹 FSH (13) cAMP夹⫽ kPDE EFSH (14) Xp夹FSH⫽ 夹 ki X夹FSH (15)
Substituting this into Eq. 8, we obtain
X夹FSH
冋
kikr⫹ 夹共ki⫹ kr兲 kikr ⫹共 夹⫹ k ⫺兲 k⫹FSH册
⫽ RT (16) where 夹⫽ ␣冉
kPDE EFSH冊
␥ ␦␥⫹冉
kPDE EFSH冊
␥Hence, the quasi-steady-state assumption defines a quasi-steady-state model reducing system 8–12 to a one-variable, nonlinear differential equation
dEFSH dt ⫽ 
再
RT/冋
kikr⫹ 夹共ki⫹ kr兲 kikr ⫹共夹⫹ k⫺兲 k⫹FSH册
⫺ EFSH冎
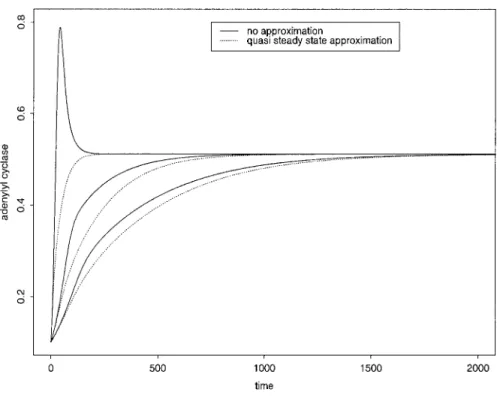
EFSH (17)Figure 1 illustrates the degree of discrepancy, as far as the changes in EFSH are concerned, between
the complete and the reduced models.
Although the transient behavior of EFSH is under
the control of , its steady-state EFSH* is not. The
steady state corresponding to E0⬎ 0 is characterized
by R*FSH⫽ 共* ⫹ k⫺兲 k⫹FSH X*FSH E*FSH⫽ X*FSH cAMP*⫽ kPDE X*FSH (18) Xp*FSH⫽ * ki X*FSH with XFSH* a solution of X*FSH
冤
冉
1⫹ k⫺ k⫹FSH冊
⫹ ␣冉
kPDE X*FSH冊
␥ ␦␥⫹冉
kPDE X*FSH冊
␥ ⫻冉
1 ki ⫹ 1 kr ⫹ 1 k⫹FSH冊
冥
⫽ RT (19)By use of simple geometric reasoning, it is possible to prove that Eq. 19 always admits a unique, positive real root (seeAPPENDIX, Existence and Uniqueness of Strictly
Positive Roots of Eq. 19). This root defines the unique
equilibrium state of the system. The level of intracel-lular cAMP at this steady state is an increasing func-tion of the following parameters: FSH input, size of receptor pool RT and constants k⫹, kikr, and ␦.
Con-versely it is a decreasing function of k⫺, kPDE, and ␣
(see proof inAPPENDIX, Control of the Steady-State Level
cAMP*). The influence of the slope parameter␥ is not
univocal: cAMP steady-state level is either an increas-ing function of␥ if RT⬍ ␦kPDE
冋冉
1⫹ k⫺ k⫹FSH冊
⫹ ␣ 2冉
1 ki ⫹ 1 kr ⫹ 1 k⫹FSH冊册
or a decreasing one in the opposite case.on September 3, 2010
ajpendo.physiology.org
Stability of the Steady State
Linear stability of systems of ordinary differential equations such as those arising in this paper is deter-mined by the roots of a polynomial. The stability anal-ysis involves the linearization of system 8–12 in the form
dq dt ⫽ Mjq
where q is the vector of the time-dependent concentra-tions (RFSH, XFSH, XpFSH, EFSH, cAMP), and Mj is the
matrix of the linearized nonlinear terms evaluated at the steady state, which is defined as the Jacobian matrix and is given by
Mj⫽
冤
⫺k⫹FSH⫺ kr k⫺⫺ kr 0 0 ⫺kr k⫹FSH ⫺共* ⫹ k⫺兲 0 ⫺X*FSH* 0 0 2X * FSH ⫺X*FSH 0 0 0 0 ⫺kPDE 0 0 * 0 X *FSH* ⫺ki冥
using for simplicity the notation * ⫽
冉
cAMP冊
cAMP* ⫽␥␣␦␥cAMP*共␥ ⫺ 1兲 关␦␥⫹ cAMP*␥兴2 ⫽ ␥␣␦␥⫹冉
kPDE X *FSH冊
␥ ⫺ 1冋
␦␥⫹冉
kPDE X *FSH冊
␥册
2Solutions are obtained by setting q⫽ q0et
where q0 is the constant vector of initial values, and
the eigenvalues are the roots of a characteristic polynomial兩 Mj⫺ I 兩 ⫽ 0, with I the identity matrix.
The steady state is stable if all roots have a nega-tive real part. Because formal calculation did not allow us to carry through the study of the real part signs, we made use of the Hurwitz criterion (5), which derives necessary and sufficient conditions for negativity. In the case where steady-state, *, is saturated and can be approximated by the constant value␣, the Hurwitz criterion shows that the eigenvalues of Mjhave strictly
negative real parts, so that the steady state is asymp-totically stable (see details inAPPENDIX, Hurwitz
Crite-rion for Linear Stability Analysis). Application of the
criterion is not so straightforward when the depen-dence of * on cAMP* is taken into account, so that linear stability analysis in the general case remains to be studied. However, note that, because the equilib-rium in the case of a constant is hyperbolic, it is locally structurally stable; hence, it will also be asymp-totically stable whenever the dependence of on cAMP is weak (16).
Controllability Analysis
Roughly speaking, a dynamic system is said to be controllable if, starting from given initial conditions, one can find an admissible control variable (here FSH) such that there exists a time for which the state vari-ables will be steered to prescribed values. Controllabil-ity is an important feature of the model, because if the system were not controllable, the equilibrium values would be reached independently of FSH, which would be unsatisfactory for a model that we want to use for control purposes.
Fig. 1. Comparison between approximate and exact solution of activated adenylyl cyclase concentration (EFSH). Solid lines correspond to
the solutions obtained from Eq. 10 in the com-plete model; dotted lines represent the solu-tions obtained from Eq. 17, assuming quasi-steady state on the other variables. From left to
right, the 3 pairs of curves are respectively
associated with time scale parameter () values of 0.1, 0.01, and 0.005. Time unit is 102s, and
E0⫽ 0.1 ⫻ 104molecules/cell. Other parameter
values are displayed in Table 2. The amplitude of the discrepancy between the reduced and complete models increases as  value in-creases, whereas the length of the transient period increases with decreasing value.
on September 3, 2010
ajpendo.physiology.org
The study of the controllability matrix associated with the linearized system at steady state is more easily tractable (24) than that of the Jacobian matrix and allows us to conclude that the nonlinear system
8–12 is locally strongly accessible everywhere except if E0 ⫽ 0 (details in APPENDIX, Local Control of the
Sys-tem). The controllability analysis does not require the
assumption of a constant FSH input, so it leads to quite general results regarding FSH input shape.
CONTROL OF FSH-INDUCED cAMP LEVELS
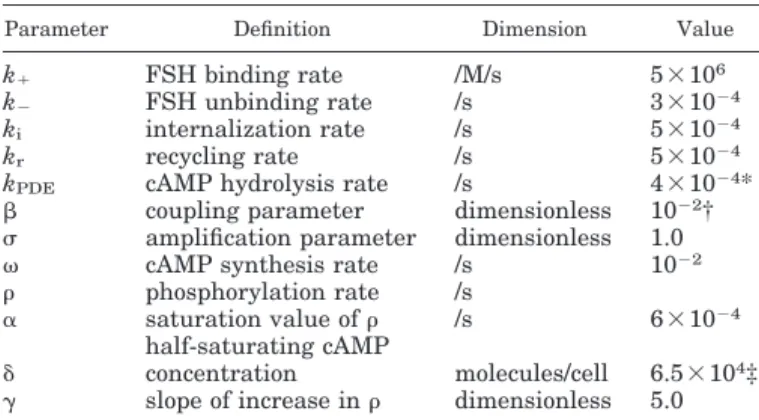
Dimension of Model Variables and Parameters
To handle the model equations from a numerical viewpoint, we need to know the dimensions and ranges of both variables and parameters so as to confine cAMP output values within physiological limits. As far as variables are concerned (Table 1), granulosa-specific information is available. During terminal follicular de-velopment, there are ⬃103-104 FSH binding sites per
cell (17, 27). Experimental measurements of cAMP concentration in granulosa cells (1, 13, 19, 20) under different conditions lie in a range from 0.1 to 10 pmol/ 106 cells, roughly corresponding to 0.2 to 20 ⫻ 104
molecules per cell (molecular mass of cAMP is 327 Da). As far as parameters are concerned (Table 2), FSH binds its receptors with high affinity; the equilibrium dissociation constant Kd ⫽ k⫺/k⫹ is on the order of
10⫺10M (23). The other kinetic constants are assigned ranges of values consistent with published biochemical models in other cell types (14, 32). We used physiolog-ical FSH plasma concentrations as inputs, lying in the range from 1 to 10 ng/ml, with 3 ng/ml corresponding to 10⫺10 M on the basis of an average FSH molecular mass of 3 ⫻ 104 Da (35). The lowest FSH values
correspond to tonic secretion, whereas the highest rather correspond to the surge secretion or the level used in stimulation protocols or in vitro experiments.
Physiological Meaning of Variations in Parameter Values
Variations in the model parameter values corre-spond to physiological or pathological alterations in the
different steps of FSH signal processing by granulosa cells. Binding equilibrium parameters (k⫹, k⫺) might vary among species in relation to species-specific ge-netic differences or even intraspecies as a result of functional mutations or receptor polymorphism affect-ing the extracellular domain of the FSH receptor that contains the binding site. The number of FSH recep-tors available for binding can be experimentally al-tered. For instance, the treatment of granulosa cells with neuramidase, which catalyzes the removal of cell surface sialic acid, increases specific FSH binding (25). In the model, such a treatment would result in an increase in the size of the global receptor pool (RT). The
level of adenylyl cyclase activation might differ accord-ing to genetic differences affectaccord-ing the FSH receptor domain(s) responsible for G protein activation, the de-gree of G␣s-intrinsic GTPase activity, or the use of
adenylyl cyclase activators such as forskolin. Varia-tions in the amplification parameter () may partly account for such processes, as this parameter is related to the average number of adenylyl cyclase molecules activated by one FSH-bound receptor during its life-time as an active form. Different values of the cAMP synthesis parameter () could correspond to different types of adenylyl cyclase, as several of them have been identified (33). Signal extinction in the model is ensured by the hydrolysis of cAMP and the phosphorylation-induced desensitization of bound receptors. Variations in the hydrolysis rate (kPDE) can be experimentally
achieved through chronic infusion with a PDE inhibi-tor such as isobutylmethylxanthine (IBMX) or, con-versely, through constrained overexpression of PDE in cultured cells. Similarly, infusion of kinase inhibitors such as staurosporine alters the balance between ki-nase and phosphatase activities and can be related to variations in the parameters of the phosphorylation rate, especially its saturation value (␣). The rate of renewal of free FSH receptors results from a dynamic equilibrium between the processes of internalization, degradation, recycling, and synthesis. In the model, renewal is dependent on both the internalization (ki,)
and the recycling (kr) rates. Finally, the time scale
parameter () measures the speed of amplification of Table 1. Model variables
Variable Definition Value
Extracellular signal
FSH Follicle-stimulating hormone 10⫺10M/l
Transmembrane species
RFSH Free FSH receptors 104/cell
XFSH Bound FSH receptors 104/cell
XpFSH Phosphorylated FSH receptors 104/cell
EFSH Adenylyl cyclase 104/cell
Intracellular species
Ri Internalized FSH receptors 104/cell
cAMP Cyclic adenosine monophosphate 104/cell
t Follicular age 102s
In species, italics denote concentration.
Table 2. Model parameters
Parameter Definition Dimension Value
k⫹ FSH binding rate /M/s 5⫻106
k⫺ FSH unbinding rate /s 3⫻10⫺4
ki internalization rate /s 5⫻10⫺4
kr recycling rate /s 5⫻10⫺4
kPDE cAMP hydrolysis rate /s 4⫻10⫺4*
 coupling parameter dimensionless 10⫺2† amplification parameter dimensionless 1.0 cAMP synthesis rate /s 10⫺2 phosphorylation rate /s
␣ saturation value of /s 6⫻10⫺4 ␦ half-saturating cAMPconcentration molecules/cell 6.5⫻104‡
␥ slope of increase in dimensionless 5.0 * 9⫻ 10⫺4in Figs. 6 and 7; † 0.5⫻ 10⫺2in Fig. 9; ‡ 10.5⫻ 104in
Figs. 6 and 7.
on September 3, 2010
ajpendo.physiology.org
FSH signal in granulosa cells. It integrates the role of cross talks with different signaling pathways, notably paracrine and autocrine signaling through growth fac-tors and steroids.
For a given combination of the model parameters, variations in FSH input help to determine the range of values where the model is the most sensitive to changes in FSH levels. Besides, increasing the level of the constant FSH input illustrates how the cell is protected against an overflow in intracellular cAMP.
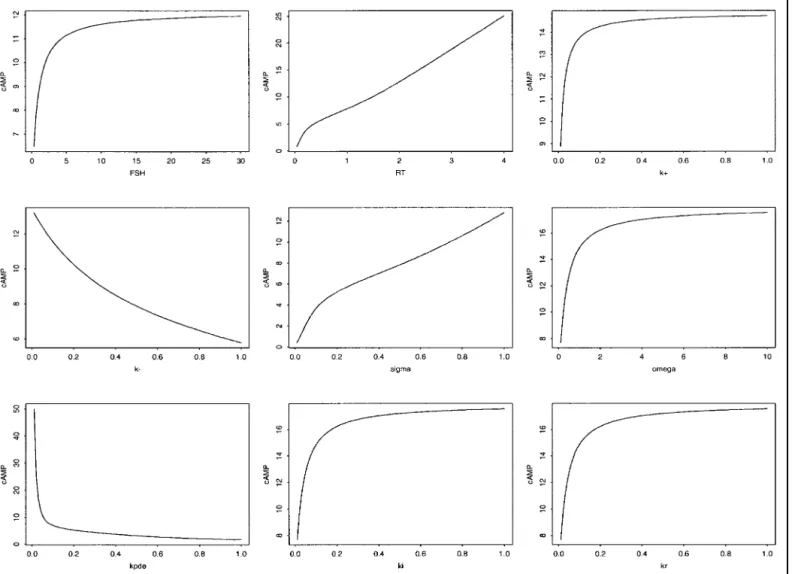
Control of cAMP Steady-State and Transient Levels Study of cAMP steady-state levels. Given a fixed value
of FSH input, every parameter except the time scale parameter () affects the value of the cAMP steady-state level cAMP*. This value is an increasing function of FSH input, the size of receptor pool RT, the rate constants k⫹,
ki, and kr, and the half-saturating cAMP concentration␦.
Conversely it is a decreasing function of the unbinding rate k⫺, the hydrolysis rate kPDE, and the saturation
value␣. The way cAMP* is influenced by a parameter is analyzed formally inAPPENDIX(Control of the Steady-State
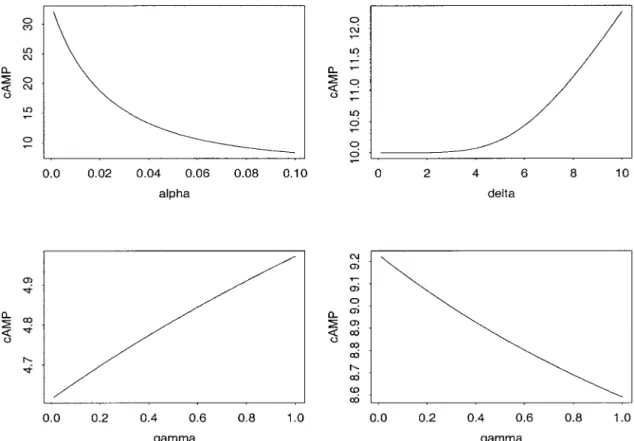
Level cAMP*). Interestingly, the ␥-parameter, which
rules the rate of increase in the phosphorylation rate (the slope of the Hill function), has a nonunivocal influence on
cAMP*, depending on the value of RTcompared with a
threshold value given by
RThresh⫽ ␦kPDE
冋冉
1⫹ k⫺ k⫹FSH冊
⫹ ␣ 2冉
1 ki ⫹ 1 kr ⫹ 1 k⫹FSH冊册
For values of RT lower than RThresh, cAMP* is anincreasing function of ␥, whereas it is a decreasing function for values⬎RThresh. When RT⫽ RThresh,
alter-ing the value of␥ simply has no effect. This means that, if the receptor pool is small, the cAMP steady-state level rather benefits from an almost all-or-nothing ef-fect of cAMP level on the phosphorylation process than from a progressive, smoother effect.
Beyond this qualitative study, quantitative dose-ef-fect-like curves can be constructed from Eq. 19, which amounts, in term of cAMP*, to
cAMP*
冋冉
1⫹ k⫺ k⫹FSH冊
⫹ ␣cAMP*␥ ␦␥⫹ cAMP*␥ ⫻冉
1 ki ⫹1 kr ⫹ 1 k⫹FSH冊册
⫽ RT kPDEThese curves are displayed in Figs. 2 and 3. The range of variations for some parameters has been deliber-ately exaggerated beyond physiological values so as to examine a large range of cAMP steady-state-reachable levels for a given parameter.
Study of cAMP transient levels. To retrace the
his-tory of FSH-induced cAMP production, starting from a quiescent initial state, we also need to understand the transient behavior of the system before its reaching steady state. To do so, we performed a series of numer-ical simulations of the model using a computer pro-gram written in C language. The differential equations
were integrated by means of a Runge-Kutta method of order 4 (28), with a step of 0.01 s. cAMP transient levels depend in a complicated manner on the values of the model parameters and FSH input. The same steady state can in particular be achieved in different ways depending on the value of the time scale parameter. This parameter is the only one in the model that does not affect the steady state but instead exerts a substan-tial influence on the transient behavior, especially of the coupling variable EFSH.
Initial values. The start of the simulation was
as-sumed to be the point in time when FSH receptors become efficiently coupled to G proteins and start in-fluencing intracellular cAMP production, which corre-sponds to the follicle’s entering the FSH-responsive stage. Before this point, it is assumed that there is a minor basal level of activated adenylyl cyclase, result-ing in a low basal level of cAMP production uncoupled with FSH input. Initial conditions for the differential equations Eqs. 8–12 are set to
RFSH共t0兲 ⫽ RT⫺ X0 XFSH共t0兲 ⫽ RT k⫺/共k⫹FSH兲 ⫹ 1 XpFSH共t0兲 ⫽ Ri共t0兲 ⫽ 0 EFSH共t0兲 ⫽ E0 cAMP共t0兲 ⫽ cAMP0⫽ kPDE E0
These correspond to the binding equilibrium between
RFSH and XFSHand steady state for Eq. 11 with
acti-vated cyclase level E0decoupled from receptor
stimu-lation.
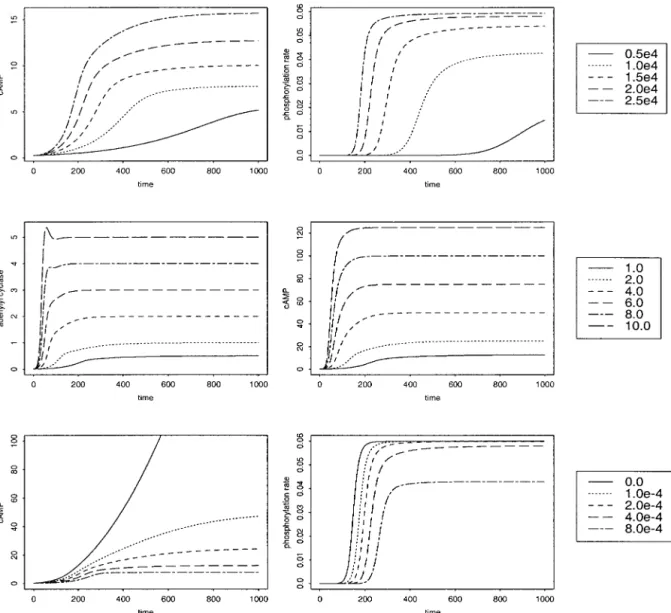
Influence of the receptor pool size. Figure 4 (top)
illustrates the effects of varying the size RTwithin the
physiological range of 0.5–2 ⫻ 104 receptors/cell. As
expected, decreasing RTleads to a lower cAMP
steady-state level. With the smallest RTvalue (0.5⫻ 104), this
cAMP level corresponds to a steady-state value of the desensitization rate being much lower (0.02/s) than the saturation value␣ (0.06/s).
Influence of the binding dissociation constant. The
increase in the dissociation constant, Kd⫽ k⫺/k⫹, leads
to an increase in the free receptor concentration to-gether with a decrease in the concentration of bound receptors and its derived (phosphorylated and inter-nalized) forms. This again affects the steady-state val-ues cAMP* and*, with the highest value of Kd
corre-sponding to the lowest cAMP level.
Influence of the amplification parameter. Figure 4
(middle) illustrates the role of the amplification param-eter. The patterns of changes in EFSHand cAMP are
almost superimposed. The scale of the cAMP value range is dramatically increased as increases.
Influence of the hydrolysis parameter. A nonzero
value of kPDEis necessary for the cAMP concentration
to reach a steady-state value. If kPDE ⫽ 0, as can be
seen on the solid line of Fig. 4 (bottom), signal turn-off
on September 3, 2010
ajpendo.physiology.org
is mediated only by the phosphorylation function , which quickly reaches its saturation value (␣) and cannot control the exponential increase in cAMP con-centration. Conversely, increasing the value of kPDE
affects cAMP levels so as to stabilize at a value far below saturation.
Influence of the phosphorylation saturation parame-ter. Changes in the saturation capacity of the
desensi-tization function affect not only the steady-state level of cAMP but also the different forms of FSH receptors, as can be seen in Fig. 5. Increasing the value of ␣ reduces the number of FSH receptors in the bound active state XFSHin favor of the phosphorylated state
XpFSH. The associated increase in internalized
recep-tors cannot compensate for this imbalance even if the internalization process is at the source of free receptor renewal and hence, indirectly, of active bound recep-tors.
Influence of receptor renewal. Increasing either the
internalization rate kior the recycling rate krallows for
a quicker renewal of free FSH receptors from
phos-phorylated bound receptors, thus enhancing the FSH signal.
Influence of the time scale parameter. Low  values
( ⬍⬍ 1) lead to a marked contrast between the dynam-ics of fast (RFSH, XFSH, cAMP, and XpFSH) and slow
(EFSH) variables, whereas high values (i.e., not much
lower than 1) tend to homogenize the time scales of all the variables. As increases from a small value toward 1, the time required to reach equilibrium is signifi-cantly decreased, as can be seen in Fig. 6. Thus, for close to 1, the steady state is reached in a few minutes, whereas, for small values (as low as 10⫺3 in this in-stance), it can take several days. The maximal value reached by EFSHand cAMP can significantly overshoot
its steady-state value, and this effect also becomes more pronounced as  increases toward 1. The tran-sient response is sensitive to even small variations in the value of, especially for given parameter combina-tions. This is illustrated in Fig. 7, where the hydrolysis rate is about twice what its value is in other figures (0.09/s). The time derivative of EFSH changes signs,
Fig. 2. Influence of follicle-stimulating hormone (FSH), size of receptor pool (RT), FSH binding rate (k⫹), FSH
unbinding rate (k⫺), amplification parameter (), cAMP synthesis rate (), cAMP hydrolysis rate by phosphodi-esterase (kPDE), phosphorylated receptor internalization rate (ki), and internalized receptor recycling rate (kr) on
cAMP steady-state (cAMP*) level. Panels illustrate the influence of the FSH input and other parameter values from left to right and top to bottom on cAMP*.
on September 3, 2010
ajpendo.physiology.org
and thus crosses its steady-state value, one or more times depending on the precise value of , subse-quently leading to a variety of cAMP-transient pat-terns.
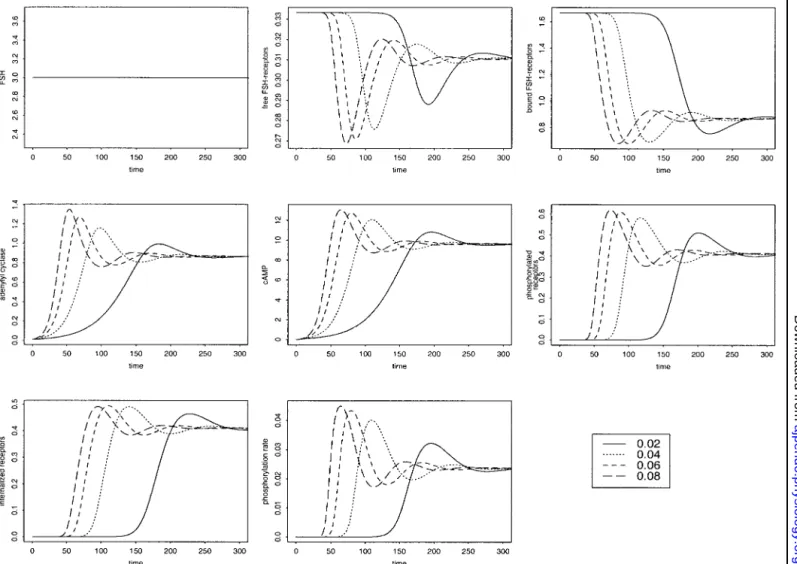
Level and pattern of FSH input. In the physiological
range from 0.3 to 3.0⫻ 10⫺10M, a 10-fold variation in FSH concentration (Fig. 8, top) results in a twofold variation in cAMP level. Beyond a given level of FSH (depending on the values of the other parameters), increasing the FSH level will have almost no effect on the cAMP response. We also investigated the pattern of cAMP response to nonconstant FSH inputs (results not shown). In the case of a square-shaped FSH input, the system switches from one steady state to another as FSH switches between its high and low values. The reaction of the system to the changes in FSH input is again under the control of . The smaller  is, the smoother the changes in the system variables, to the extent that the effects of the variation in FSH input may be perceptible only in the behavior of the receptor species (RFSH, XFSH, XpFSH, Ri). Other simulations
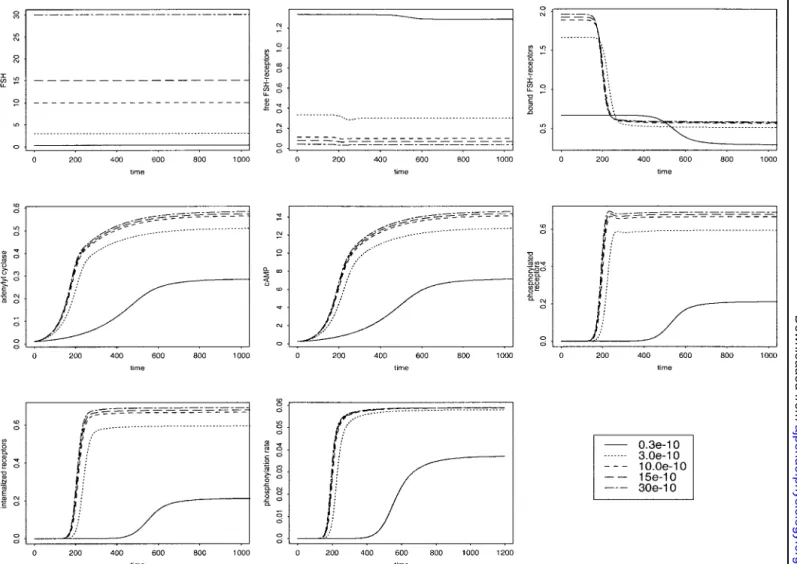
with exponentially decreasing or sinusoidal FSH input yielded qualitatively similar conclusions. We show in Fig. 9 an example of the model behavior in response to
real FSH data taken from Adams et al. (2; Fig. 1B, p. 631). The changes in FSH input are mirrored in those of free FSH receptor concentration, whereas they are quite tightly tracked by those in bound FSH receptors. The changes in phosphorylated and internalized recep-tors are nearly similar and follow the phosphorylation rate, which starts rising only when significant cAMP levels have been reached. The changes in activated adenylyl cyclase and cAMP are smoother. After in-creasing in a continuous way, they end up oscillating in a dampened manner around a steady-state value.
DISCUSSION
Our model is concerned with the cAMP dynamics resulting from FSH signal transduction in average granulosa cells of maturing ovarian follicles. We have chosen to focus on the dynamics of coupling between FSH receptor stimulation and adenylyl cyclase activa-tion and have assumed that, on average, the cell has a constant pool of receptors. This is consistent with ex-perimental observations that, in the first part of ter-minal follicular development, the increased response of cAMP production to FSH occurs in the absence of
Fig. 3. Influence of saturation value of phosphorylation rate (␣), slope parameter (␥), and half-saturating cAMP concentration (␦) (depending on RT value) on cAMP*. Panels illustrate the influence of the parameters of the
phosphorylation rate on cAMP*. Top: influence of (␣) (left) and ␦ (right); bottom: influence of ␥ when either
RT⬍ ␦kPDE
冋冉
1⫹ k⫺ k⫹FSH冊
⫹ ␣ 2冉
1 ki ⫹1 kr ⫹ 1 k⫹FSH冊册
(left) or RT⬎ ␦kPDE 冋冉
1⫹ k⫺ k⫹FSH冊
⫹ ␣ 2冉
1 ki ⫹k1 r ⫹k 1 ⫹FSH冊册
(right) on September 3, 2010 ajpendo.physiology.org Downloaded fromsignificant changes in the number of FSH-binding sites per granulosa cell (29). Instead, the changes in signal transduction associated with follicular development appear to affect the adenylyl cyclase enzyme system. This is corroborated by investigations on cell lines expressing the FSH receptor, in which the FSH-depen-dent accumulation of cAMP is highly variable but not correlated with the receptor density (reviewed in Ref. 31) and may be due to the different coupling efficiency in the different cell lines.
At the scale of a single cell, the assumption of a constant pool of receptors implies that a newborn
daughter cell doubles its inherited pool of receptors (which can be considered roughly one-half of the pool of its mother cell) during the first part of G1 after
com-pletion of mitosis. At the scale of the whole follicle, the number of receptors increases proportionally with the increase in granulosa cell number.
The notion of an average cell follows from the exper-imental means of investigating cAMP levels through-out follicular development. The common way of mea-suring cAMP is to dissect follicles and pool granulosa cells so that, even if the total number of granulosa cells increases with follicular maturation, the results are
Fig. 4. Influence of RT,, and kPDE. Top: influence of RTon changes in cAMP levels (left) and on changes in
(right); inset: nos. are in molecules/cell. Middle: influence of on changes in activated adenylyl cyclase levels (left) and on changes in cAMP levels (right); inset: nos. are dimensionless. Bottom: influence of kPDEon changes in cAMP
levels (left) and on changes in the phosphorylation rate (right); inset: nos. are in kPDE(/s). In this figure and in
Figs. 5–9, the various panels give the time evolution of the various concentrations that constitute the variables in the model. These are expressed in units of 104molecules/cell (see Table 1). The phosphorylation rate is shown as
a function of time. Figures 5–8, top left, show the pattern of applied FSH input (10⫺10M; this is constant in Figs.
5–7). Differently styled lines on each plot of the same figure correspond to different values of the model parameter under study (displayed in insets), the other parameters being kept unchanged. The basic set of common parameter values is summarized in Table 2, and common initial values are RT⫽ 2.0, basal level of adenylyl cyclase (E0)⫽
0.01, and cAMP⫽ 0.25 (104molecules/cell), with constant FSH input of 3⫻ 10⫺10M. Time units are 102s, so the
simulations correspond to periods of between⬃8 h and 5 days.
on September 3, 2010
ajpendo.physiology.org
expressed as average concentrations per given number of cells (usually 105 or 106) (1, 13, 19, 20). Such an
average viewpoint also takes into account smoothing interactions between granulosa cells such as the ex-change of cAMP molecules through gap junctions. Be-cause the cycles of granulosa cells appear to be fully desynchronized, the average description does not need to consider the various phases of the cell cycle and moreover allows us to take into account the heteroge-neous features of cell states, including the nondividing state.
To understand the nature of the most appropriate data for the model, we recall here what it really per-forms. The model retraces the long-term behavior of cAMP in granulosa cells during terminal follicular de-velopment in response to FSH alone. It is interested in follicles from their entering the FSH-responsive stage. For instance, in the ewe, this stage corresponds to a 1-mm diameter, compared with the 7.5-mm diameter of ovulatory follicles (monoovulating breeds). The out-put of the model is the cAMP level as a function of the follicle’s age in response to a given pattern of FSH input. Detailed analysis has been made for constant input, but real FSH data can also be handled.
The most appropriate data would consist of repeated measurements of intracellular cAMP throughout the development of dynamically monitored follicles. Con-comitantly, FSH levels should be measured. Such data could be directly exploited from the FSH-responsive to the LH-responsive stage. Once LH receptors appear on granulosa cells, cAMP production is a mixed response to both FSH and LH stimulation. To track cAMP pro-duction until the ovulatory stage, one needs to be placed in controlled situations. In physiological situa-tions, the luteal phase in ruminant species would be
the most appropriate window on the ovarian cycle to harvest data. In such species, there is no estradiol secretion from the corpus luteum, so follicular growth proceeds normally until the preovulatory size; yet LH pulsatility is low, due to high progesterone levels, so the follicles are prevented from ovulating. Hence, ter-minal follicular development during the luteal phase is mainly FSH dependent and thus fulfills the require-ments for investigating FSH-induced cAMP production throughout terminal development. In pharmacological situations, appropriate conditions can be reproduced artificially by means of either previous desensitization with gonadotropin-releasing hormone (GnRH) ago-nists, or use of GnRH antagonists and administration of recombinant FSH with known bioactivity. The most limiting point in both situations is the need for dy-namic, noninvasive measurements of intracellular cAMP. This might be achievable in the future through repeated ultrasound-guided follicular cell pickup as follicular development progresses. In domestic ani-mals, follicular fluid pickup is already running well, and technical progress in devices may render direct cell pickup feasible in the medium term.
Some data on the long-term evolution of cAMP are, nevertheless, already available. The most interesting ones (13) provide information about the trends in cAMP production throughout follicular development. Unfortunately, they are not straightforward enough to handle on quantitative grounds, because cAMP concen-trations are expressed against the follicular diameter. Besides, they need ovariectomy and dissection of the follicles, whose granulosa cells are pooled, so they do not allow individual or dynamic study of the follicles. cAMP levels may also be overestimated because of the use of IBMX. Despite this lack of appropriate data, we
Fig. 5. Influence of the desensitization saturation capacity ␣ (/s). Top left: changes in the levels of active bound FSH receptors (XFSH); top right:
changes in cAMP levels; bottom left: changes in the phosphorylation rate;
bottom right: changes in the levels of
phosphorylated bound FSH receptors (XpFSH).
on September 3, 2010
ajpendo.physiology.org
constrained the numerical application of the model as much as we could, as is detailed in Dimension of model
variables and paramenters.
In summary, the simulations presented in Control of
FSH-Induced cAMP Levels have investigated the
pos-sible alterations in the capacity of the granulosa cell for FSH signal 1) detection, 2) relay and amplification, and
3) overflow control. The capacity for signal detection
depends on the size of the receptor pool and on the dissociation rate, which is presumably constant within a single individual but could be subject to inter- or even intraspecies differences due to the existence of gene mutations or polymorphisms. The capacity for signal relay and amplification is mediated mainly through the coupling variable EFSH for activated adenylyl cyclase
and the parameter. At this stage, our formulation of the dynamics of EFSH is a “black box,” subject to
bio-logical constraints. From available knowledge, one can only speculate on the underlying mechanisms. They could imply, for instance, a modulation in the intrinsic GTPase activity of different splice variants of G␣s
sub-units (9) or a shift in the balance between FSH receptor coupling with G␣s (activating adenylyl cyclase) and
FSH receptor coupling with G␣i (inhibiting adenylyl
cyclase). The design of new experiments would help to answer the question. They could consist, for instance, of measuring FSH-induced cAMP responses in cul-tured granulosa cells derived from small compared with large follicles after adding either cholera (inhib-iting GTPase activity) or pertussis (inhib(inhib-iting G␣i
sub-units) toxins in the culture medium. If a decrease in G␣ior GTPase activity occurs during terminal
follicu-lar development, one would expect to observe a greater rise in the cAMP response of treated granulosa cells, compared with control cells, from small follicles than in the response of treated cells from large follicles. The capacity for signal overflow control is exerted by means of both receptor desensitization and cAMP hydrolysis. The balance between cAMP synthesis and hydrolysis (corresponding to/kPDE) could be related to different
isoforms of adenylyl cyclase and PDE enzymes. The processes of desensitization and hydrolysis act as
pro-Fig. 6. Influence of the time scale parameter (large variations), showing from left to right and from top to bottom the correspondence of each panel to the next: FSH input, changes in the levels of free FSH receptors, bound FSH receptors, activated adenylyl cyclase, cAMP, phosphorylated receptors, internalized receptors, phosphorylation rate. Inset: nos. are dimensionless.
on September 3, 2010
ajpendo.physiology.org
tection mechanisms of the granulosa cells against over-stimulation and cAMP overflow, resulting in the con-trol of the maximal reachable value of the intracellular cAMP level as well as of the speed in reaching a prescribed value. Early elevated levels of intracellular cAMP are known to have deleterious effects such as precocious luteinization (34). Although mathematically the system remains at this equilibrium for all time, in reality this is not the case, because the cAMP-induced expression of LH receptors around the time of selection will again modify the pattern of cAMP production. We intend to incorporate this effect in our model in the future.
The model’s result that cAMP behaves as an increas-ing, saturating function of FSH is compatible with the observation that FSH-induced estradiol production drops for large FSH concentrations after the ovulatory surge (22). First, this drop may concern only that part of the cascade downstream of cAMP. In particular, differential regulation of protein kinase A regulatory subunits (18) could be involved, which would control
the expression level of aromatase (but would not pre-vent LH from maintaining steroidogenesis, because it has direct, not only genic, effects such as enhancing the entry of cholesterol into the mitochondria). Second, cross talks among the various cellular signaling path-ways may be of greater importance after the follicle has acquired LH receptors and affect estradiol response to FSH. Finally, the fully cAMP-dependent desensitiza-tion process of the model may be inadequate to describe what happens in the presence of large FSH concentra-tions. At high agonist concentration, G protein-coupled receptor kinases could also be implicated, together with the proteins of the arrestin family, in the phos-phorylation of FSH receptors, as has been established for the2-adrenergic receptor (3).
Control of the dynamics of cAMP production in granulosa cells is a key point in the regulation of terminal follicular development. Yet, as far as we are aware, manipulation of the different steps of the cAMP cascade is not used as a way of controlling ovarian function either in domestic animals or in
Fig. 7. Influence of (small variations), showing from left to right and from top to bottom the correspondence of each panel to the next: FSH input, changes in the levels of free FSH receptors, bound FSH receptors, activated adenylyl cyclase, cAMP, phosphorylated receptors, internalized receptors, phosphorylation rate. Inset: nos. are dimensionless.
on September 3, 2010
ajpendo.physiology.org
humans. A realistic model would thus be of great help in developing new strategies for the control of follicle maturation and understanding pathophysio-logical situations such as those encountered in polyovulating models. The Booroola Merino is a breed of sheep carrying a major gene that influences its ovulation rate. Homozygous (F/F) and heterozy-gous (F/⫹) carriers and noncarriers (⫹/⫹) of the gene have ovulation rates of ⱖ5, 3 or 4, and 1 or 2, respectively. Comparative studies (19) have shown that the F gene induces specific differences in follic-ular development because of the granulosa cells from
F/F and F⫹ ewes being more responsive to FSH and/or LH than granulosa cells from⫹/⫹ ewes with respect to cAMP synthesis. Similar observations have been made in polyovulating Romanov breeds compared with monoovulating Ile de France breeds (1). Furthermore, FSH-induced cAMP response was clearly greater in Romanov ewes, although the num-ber of FSH receptors was similar, suggesting a more efficient coupling between FSH receptors and
adeny-lyl cyclase in this breed. Interestingly, deregulation of cAMP production also seems to occur in women suffering from polycystic ovary syndrome. Prema-ture generation of preovulatory concentrations of cAMP in granulosa cells could be at the source of anovulation (37).
The model combines biochemical and physiological an-gles of FSH action on granulosa cells. It helps us gain a better understanding of the dynamic control of cAMP synthesis in granulosa cells during terminal follicular development. It allows us to investigate how FSH con-centrations will affect the responsiveness of follicles in terms of cAMP production. Variations in the model pa-rameter values correspond to physiological or pathologi-cal alterations in the different steps of FSH signal pro-cessing by granulosa cells. The resulting cAMP dynamics, in turn, control the commitment of granulosa cells to proliferation, differentiation, or apoptosis. Thus understanding FSH-induced cAMP dynamics is a first step in understanding how FSH controls granulosa cell behavior on the scale of the whole follicle.
Fig. 8. Response to different levels of FSH stimulation, showing from left to right and from top to bottom the correspondence of each panel to the next: FSH input, changes in the levels of free FSH receptors, bound FSH receptors, activated adenylyl cyclase, cAMP, phosphorylated receptors, internalized receptors, phosphorylation rate. Inset: nos. are in moles per liter.
on September 3, 2010
ajpendo.physiology.org
The main improvement to the present model would consist of giving a fully biochemically based formula-tion to the equaformula-tion describing changes in coupling efficiency. For the moment, this remains beyond reach, because little is known about the biochemical mecha-nisms underlying the increase in the cAMP response of granulosa cells to FSH stimulation. Obviously, the balance between activation and inactivation of G pro-teins is implicated in this mechanism, but further experimental investigation is needed before a more realistic model can be built. Incorporating LH signal-ing is also an important challenge, because synergistic signaling by FSH and LH seems to be the basis for the selection of the ovulatory follicle(s).
Whereas inadequate response of granulosa cells to gonadotropin signals may have major repercussions on follicular development and may even lead to infertility, a realistic model characterizing both physiological and pathological signal transduction would be very useful for simulating the development of new therapeutic strategies.
APPENDIX
Upper Bounds of Solutions
From Eqs. 1–6, one can see that, if any one of the variables RFSH, XFSH, cAMP, XpFSH, EFSH, and Riis zero and the other
variables are nonnegative, then that variable that is zero is nondecreasing. It immediately follows that, if the system starts in the physiologically relevant region with all variables nonnegative, then it remains there for all time. With the conservation equation Eq. 7, this implies that RFSH ⱕ RT,
XFSHⱕ RT, XpFSHⱕ RT, and Riⱕ RT. From XFSHⱕ RTand
Eq. 10, it follows that E˙FSHⱕ (RT⫺ EFSH)EFSH. Hence, if
EFSH(0)ⱕ RT, then EFSH(t)ⱕ RTfor all tⱖ 0, whereas if
EFSH(0)ⱖ RT, then, for any⑀ ⬎ 0, there exists a T ⱖ 0 such
that EFSH(t)ⱕ RT⫹ ⑀ for all t ⱖ T. Substituting this into Eq.
11, we see that as long as kPDE⬎ 0, then for any ⑀ ⬎ 0 there
exists a Tⱖ 0 such that
cAMP共t兲 ⱕRT kPDE
⫹ ⑀
for all tⱖ T.
Fig. 9. Response to nonconstant FSH input (real data), showing from left to right and from top to bottom the correspondence of each panel to the next: FSH input, changes in the levels of free FSH receptors, bound FSH receptors, activated adenylyl cyclase, cAMP, phosphorylated receptors, internalized receptors, phosphorylation rate.
on September 3, 2010
ajpendo.physiology.org
Existence and Uniqueness of Strictly Positive Roots of Eq. 19
We first notice that x⫽ 0 cannot be a root of Eq. 19. For x⬎ 0, let f共x兲 ⫽RT x and g共x兲 ⫽
冤
冉
1⫹ k⫺ k⫹FSH冊
⫹ ␣冉
k PDE x冊
␥ ␦␥⫹冉
kPDE x冊
␥冉
1 ki ⫹k1 r ⫹k 1 ⫹FSH冊
冥
The roots of Eq. 19 are the points of intersection between the curves of f and g. It can be seen clearly that f(x) is a strictly decreasing function of x that tends toward zero as x tends toward infinity and tends toward infinity as x tends toward zero. On the other hand, g(x) is an increasing and bounded positive function of x. It follows that there can be only one intersection point for x⬎ 0 and that Eq. 19 admits one and only one strictly positive root. This geometric reasoning is illustrated in Fig. 10.
Control of Steady-State Level cAMP*
Influence of FSH and model parameters except ␥. The influence of FSH and the model parameters on cAMP* is effected through their influence on X *FSH. Let X *FSH1 and X *FSH2
be the corresponding steady-state values on XFSHwhen
ap-plying respective input FSH1and FSH2, with FSH1⬍ FSH2.
Suppose that X *FSH 2 ⱕ X* FSH 1 . Because FSH 1⬍ FSH2, we have 1 k⫹FSH1⬎ 1 k⫹FSH2
Because* is an increasing function of X*FSH
␣
冉
k PDE X *FSH2冊
␥ ␦␥⫹冉
kPDE X *FSH2冊
␥ⱕ ␣冉
k PDE X *FSH1冊
␥ ␦␥⫹冉
kPDE X *FSH1冊
␥Substituting into Eq. 19 we obtain
RT⫽ X*FSH 1
冤
冉
1⫹ k⫺ k⫹FSH1冊
⫹ ␣冉
kPDE X *FSH 1冊
␥ ␦␥⫹冉
kPDE X *FSH1冊
␥ ⫻冉
k1 i⫹ 1 kr⫹ 1 k⫹FSH1冊
冥
⬎ X *FSH2冤
冉
1⫹ k⫺ k⫹FSH2冊
⫹ ␣冉
k PDE X *FSH2冊
␥ ␦␥⫹冉
kPDE X *FSH2冊
␥ ⫻冉
k1 i ⫹k1 r ⫹k 1 ⫹FSH2冊
冥
⫽ RTwhich is a contradiction. Hence, we must have X *FSH2 ⬎ X* FSH
1
whenever FSH1⬍ FSH2, so that
cAMP* FSH ⬎ 0
The same reasoning applied to the parameters leads to cAMP* ki ⬎ 0,cAMP* kr ⬎ 0,cAMP* k⫹ ⬎ 0 cAMP* ⬎ 0, cAMP* ⬎ 0, cAMP* ␦ ⬎ 0 and cAMP* k⫺ ⬍ 0, cAMP* kPDE ⬍ 0,cAMP* ␣ ⬍ 0
Influence of␥. Because X*FSH⬎ 0, let y ⫽ 1/ X*FSH.
Equa-tion 19 can then be written as yRT⫽
冤
冉
1⫹ k⫺ k⫹FSH冊
⫹ ␣冉
␦kPDE y冊
␥ ⫹ 1冉
1 ki ⫹1 kr ⫹ 1 k⫹FSH冊
冥
Fig. 10. Illustration of the search for the inter-section point S between the hyperbola passing through point H (1, RT) and the increasing
sigmoid curve bounded by (A, A⫹ B), which corresponds to the root of Eq. 19. In Figs. 10 and 11, A and B are given by
A⫽
冋
1⫹ k⫺ k⫹FSH册
B⫽ ␣冉
1 ki ⫹1 kr ⫹ 1 k⫹FSH冊
on September 3, 2010 ajpendo.physiology.org Downloaded fromFurthermore, let z⫽␦kPDE y then RT ␦kPDE z⫽
冋冉
1⫹ k⫺ k⫹FSH冊
⫹ ␣ z␥⫹ 1冉
1 ki ⫹1 kr ⫹ 1 k⫹FSH冊册
(A1) Let z*1and z*2be the roots of Eq. A1 respectivelycorrespond-ing to␥1and␥2, with␥1⬍ ␥2. Both are given through Eq. 20
as the points of intersection of the straight line whose slope is the left-hand term in front of z, with the curve representing the right-hand term function of z. The search for this inter-section point is illustrated in Fig. 11.
If RT ␦kPDE ⬎
冋冉
1⫹ k⫺ k⫹FSH冊
⫹ ␣ 2冉
1 ki ⫹1 kr ⫹ 1 k⫹FSH冊册
both roots are⬍1. Hence, z␥1⬎ z␥2, so that
␣ z␥1⫹ 1
冉
1 ki ⫹1 kr ⫹ 1 k⫹FSH冊
⬍ ␣ z␥2⫹ 1冉
1 ki ⫹1 kr ⫹ 1 k⫹FSH冊
It follows that z*1⬍ z*2. Recalling that z⫽␦k
PDE/(X*FSH),
we can conclude that XFSH*1 ⬎ XFSH*2 and that
cAMP* ␥ ⬍ 0 On the other hand, if
RT ␦kPDE ⬍
冋冉
1⫹ k⫺ k⫹FSH冊
⫹ ␣ 2冉
1 ki ⫹k1 r ⫹k 1 ⫹FSH冊册
then cAMP* ␥ ⬎ 0Hurwitz Criterion for Linear Stability Analysis
The dependence of* on cAMP* can be neglected when the value of * is close to that of ␣. In this case, the * term vanishes, and the Jacobian matrix Mjcan be rewritten as
Mj⫽
冤
⫺k⫹FSH⫺ kr k⫺⫺ kr 0 0 ⫺kr k⫹FSH ⫺共␣ ⫹ k⫺兲 0 0 0 0 2X* FSH ⫺X*FSH 0 0 0 0 ⫺kPDE 0 0 ␣ 0 0 ⫺ki冥
The eigenvalues of Mjare given by the roots of the
char-acteristic equation
兺
i⫽ 0 5aii⫽ 0
We can build the following sequence of determinants associ-ated with the ais
h1⫽ 兩a4兩, h2⫽
冏
a4 a5 a2 a3冏
, h3⫽冏
a4 a5 0 a2 a3 a4 a0 a1 a2冏
, h4⫽冨
a4 a5 0 0 a2 a3 a4 a5 a0 a1 a2 a3 0 0 a0 a1冨
, h5⫽冨
a4 a5 0 0 0 a2 a3 a4 a5 0 a0 a1 a2 a3 a4 0 0 a0 a1 a2 0 0 0 0 a0冨
The signs of these determinants can be determined using a symbolic manipulation package such as Maple. This allows us to show that all of the determinants are positive, which, by the Hurwitz criterion (5), is a necessary and sufficient con-dition for all the eigenvalues of Mjto have strictly negative
real parts. This, in turn, implies that the corresponding equilibrium is asymptotically stable.
Local Controllability of the System
In this section, we consider FSH a control variable. The linearization of system 8–12 about the steady state can be written after separation of the state and control variables as q˙⫽ Mjq⫹ Bu (A2)
where q⫽ (RFSH, XFSH, EFSH, cAMP, XpFSH)T, u⫽ FSH, the
Jacobian matrix Mj defines the drift vector field, and B ⫽
(⫺k⫹RFSH* , k⫹RFSH* , 0, 0, 0)T is the input vector field. The
Fig. 11. Illustration of the search for the inter-section point between the straight line of slope RT/(␦kPDE) with the decreasing sigmoid
curve bounded by (A, A ⫹ B), which corre-sponds to the root of Eq. 20. The straight line passing through point J, whose coordinates are (1, A⫹ B/2), delimits 2 distinct areas. For any intersection point whose abscissa is⬍1, such as I, the steady-state level of cAMP, cAMP*, decreases as the value of␥ increases. On the other hand, for any intersection point whose abscissa is⬎1, such as K, this level increases as the value of␥ increases.
on September 3, 2010
ajpendo.physiology.org