HAL Id: hal-02933391
https://hal.archives-ouvertes.fr/hal-02933391
Submitted on 8 Sep 2020
HAL is a multi-disciplinary open access
archive for the deposit and dissemination of
sci-entific research documents, whether they are
pub-lished or not. The documents may come from
teaching and research institutions in France or
abroad, or from public or private research centers.
L’archive ouverte pluridisciplinaire HAL, est
destinée au dépôt et à la diffusion de documents
scientifiques de niveau recherche, publiés ou non,
émanant des établissements d’enseignement et de
recherche français ou étrangers, des laboratoires
publics ou privés.
Distributed under a Creative Commons Attribution - NoDerivatives| 4.0 International
not always governing response to ocean acidification
Yi-Wei Liu, Jill Sutton, Justin B. Ries, Robert A. Eagle
To cite this version:
Yi-Wei Liu, Jill Sutton, Justin B. Ries, Robert A. Eagle. Regulation of calcification site pH is a
poly-phyletic but not always governing response to ocean acidification. Science Advances , American
Asso-ciation for the Advancement of Science (AAAS), 2020, 6 (5), pp.eaax1314. �10.1126/sciadv.aax1314�.
�hal-02933391�
O C E A N O G R A P H Y
Regulation of calcification site pH is a polyphyletic but
not always governing response to ocean acidification
Yi-Wei Liu1,2*, Jill N. Sutton1, Justin B. Ries3, Robert A. Eagle1,4,5*
The response of marine-calcifying organisms to ocean acidification (OA) is highly variable, although the mecha-nisms behind this variability are not well understood. Here, we use the boron isotopic composition (11B) of biogenic calcium carbonate to investigate the extent to which organisms’ ability to regulate pH at their site of calcification (pHCF) determines their calcification responses to OA. We report comparative 11B analyses of 10 species with divergent calcification responses (positive, parabolic, threshold, and negative) to OA. Although the pHCF is closely coupled to calcification responses only in 3 of the 10 species, all 10 species elevate pHCF above pHsw under elevated pCO2. This result suggests that these species may expend additional energy regulat-ing pHCF under future OA. This strategy of elevating pHCF above pHsw appears to be a polyphyletic, if not uni-versal, response to OA among marine calcifiers—although not always the principal factor governing a species’ response to OA.
INTRODUCTION
Uptake of CO2 by the oceans reduces calcium carbonate saturation
state
(
= [ Ca _2+ ] [ CO 32− ]K sp
)
of seawater. Some areas of the surface oceanhave already become undersaturated, which promotes CaCO3
dis-solution, with predictions that these areas will substantially expand throughout the century (1–3). A reduction in is expected to make it more difficult for CaCO3-mineralizing organisms to produce their
shells and skeletons, with deleterious impacts on the fitness of those organisms (1–6). Laboratory-based studies and field observations have shown a diversity in the response of marine calcifying organisms to CO2-manipulated saturation state (5, 7, 8). Some species exhibit a
more predictable negative net calcification response to CO2-induced
reductions in , while others exhibit relative resilience and even positive net calcification responses (5, 7, 8).
One of the first experimental studies to characterize the full diversity of responses to CO2-induced ocean acidification (OA),
in-cluding positive calcification responses, was presented by Ries et al. (5). The underlying reasons for these diverse responses are potentially complex, given the significant biological differences among the taxa studied. However, Ries (9) proposed a relatively parsimonious physicochemical model whereby these diverse net calcification responses could potentially be explained by differences in species’ ability to regulate pH and carbonate ion concentration ([CO32−]) of
the fluid from which they form CaCO3 through active removal of
protons. This model proposes that an organism with a high proton- pumping capacity may be more resilient—in some cases even faster calcifying—under OA conditions by maintaining (or increasing) [CO32−] at the site of calcification under elevated atmospheric pCO2.
Species with lower proton-pumping capacity would exhibit relatively negative responses to OA (parabolic to threshold negative to linearly negative) due to decreasing [CO32−] at the site of calcification with
increasing atmospheric pCO2. Other views of biomineralization,
for example, highlighted in studies of echinoderms, mollusks, and scleractinian corals (10–13), hold that CaCO3 biomineral formation
within many species of calcifiers is not only influenced by pH and [CO32−] at the site of calcification but may instead commence
intra-cellularly or in tightly regulated extracellular compartments and be controlled by organic molecules that, for example, induce crystal nucleation, guide crystal growth, and/or modulate the transformation of amorphous calcium carbonate (ACC) precursors into crystalline aragonite or calcite. It should be noted, however, that the two models are not necessarily incompatible, as calcification site chemistry and organic molecules may both influence the formation and distribu-tion of CaCO3 minerals in the shell-building process.
Here, we revisit the Ries et al. (5) study by using the boron isotope composition of biogenic CaCO3 material produced under a range of
pCO2 conditions to investigate the extent to which pH control at
the site of calcification is coupled to net calcification responses to CO2-induced OA within a divergent suite of marine-calcifying
organisms. We analyzed the boron isotope composition of the shells/ skeletons of 10 species of marine calcifiers, including mollusks, crustaceans, echinoids, scleractinian corals, serpulid worms, and coralline algae, which were previously cultured at four pCO2 conditions
spanning ca. 400 to 2850 parts per million (5). This suite of species collectively exhibits the full range of calcification response patterns to CO2-induced OA observed in the original study (5), as well as in
most subsequent studies to date (6) (Fig. 1, fig. S1, and table S1).
RESULTS AND DISCUSSION
We found that shell/skeletal 11B composition varied widely among the investigated species (Fig. 1 and table S1). In most cases, skeletal/ shell 11B deviates from the theoretical relationship between seawater borate 11B and pH
sw, consistent with prior studies that have inferred
biological control over pHCF from offsets between skeletal/shell 11B
and external seawater borate 11B for many types of marine calcifiers
[e.g., (14–20)].
1Université de Brest, UBO, CNRS, IRD, Ifremer, Institut Universitaire Européen de la Mer, LEMAR, Rue Dumont d’Urville, 29280 Plouzané, France. 2Institute of Earth Sciences, Academia Sinica, 128, Sec. 2, Academia Road, Nangang, Taipei 11529, Taiwan. 3Department of Marine and Environmental Sciences, Marine Science Center, Northeastern University, 430 Nahant Rd., Nahant, MA 01908, USA. 4Institute of the Environment and Sustainability, University of California–Los Angeles, La Kretz Hall, 619 Charles E. Young Dr. E #300, Los Angeles, CA 90095, USA. 5Atmospheric and Oceanic Sciences Department, University of California–Los Angeles, Math Sciences Building, 520 Portola Plaza, Los Angeles, CA 90095, USA.
*Corresponding author. Email: [email protected] (Y.-W.L.); robeagle@ g.ucla.edu (R.A.E.)
Copyright © 2020 The Authors, some rights reserved; exclusive licensee American Association for the Advancement of Science. No claim to original U.S. Government Works. Distributed under a Creative Commons Attribution NonCommercial License 4.0 (CC BY-NC). on September 8, 2020 http://advances.sciencemag.org/ Downloaded from
20 18 16 14 11B (‰) 8.2 8.0 7.8 7.6 7.4 7.2 pHsw 28 26 24 22 11B (‰) 8.2 8.0 7.8 7.6 7.4 7.2 pHsw 12 8 4 0 Net calcification r ate (wt %/60 days) 3.0 2.5 2.0 1.5 1.0 0.5 aragonite 22 20 18 16 14 12 11 B (‰) 8.2 8.0 7.8 7.6 7.4 7.2 pHsw 20 16 12 11B (‰) 8.2 8.0 7.8 7.6 7.4 7.2 pHsw 20 16 12 8 11 B (‰) 8.2 8.0 7.8 7.6 7.4 7.2 pHsw 50 40 30 20 10 0 Net calcification r ate (wt %/60 days) 3.0 2.5 2.0 1.5 1.0 0.5 aragonite 3 2 1 0 -1 Net calcification ra te (wt %/60 days) 3.0 2.5 2.0 1.5 1.0 0.5 aragonite -2 0 2 Net calcification r ate (wt %/60 days) 3.0 2.5 2.0 1.5 1.0 0.5 aragonite 10 5 0 -5 Net calcification ra te (wt %/60 days) 3.0 2.0 1.0 aragonite 45 40 35 30 25 20 11B (‰) 8.2 8.0 7.8 7.6 7.4 7.2 pHsw 30 20 10 0 Net calcification ra te (wt %/60 days) 3.0 2.0 1.0 aragonite 20 18 16 14 12 10 11B (‰) 8.2 8.0 7.8 7.6 7.4 7.2 pHsw 1000 800 600 400 200 Net calcification r ate (wt %/60 days) 3.0 2.0 1.0 aragonite K A L C M G Q I S H R T O E J N D P F B U V W AA AC AB AD Y X Z 20 18 16 14 11 B (‰) 8.2 8.0 7.8 7.6 7.4 7.2 pHsw 20 10 0 -10 Net calcification ra te (wt %/60 days) 3.0 2.0 1.0 aragonite 20 19 18 17 16 11 B (‰) 8.2 8.0 7.8 7.6 7.4 7.2 pHsw -20 0 20 Net calcification ra te (wt %/60 days) 3.0 2.0 1.0 aragonite Purple urchin Temperate coral Hard clam Oyster Blue mussel Coralline red alga Blue crab Serpulid worm Pencil urchin Shrimp 32 28 24 20 11B (‰) 8.2 8.0 7.8 7.6 7.4 7.2 pHsw 8.23 7.50 7.85 8.06 8.38 8.76 8.51 8.64 8.23 7.50 7.85 8.06 8.23 7.85 8.23 7.85 8.23 8.57 8.90 9.32 8.23 7.50 7.85 8.06 8.23 7.50 7.85 8.06 8.23 7.85 7.96 8.06 8.15 9.04 8.23 8.51 8.76 pH CF pH CF pH CF pH CF pH CF pH CF pH CF pH CF pH CF pH CF 60 40 20 0 Net calcification ra te (wt %/60 days) 3.0 2.5 2.0 1.5 1.0 0.5 aragonite
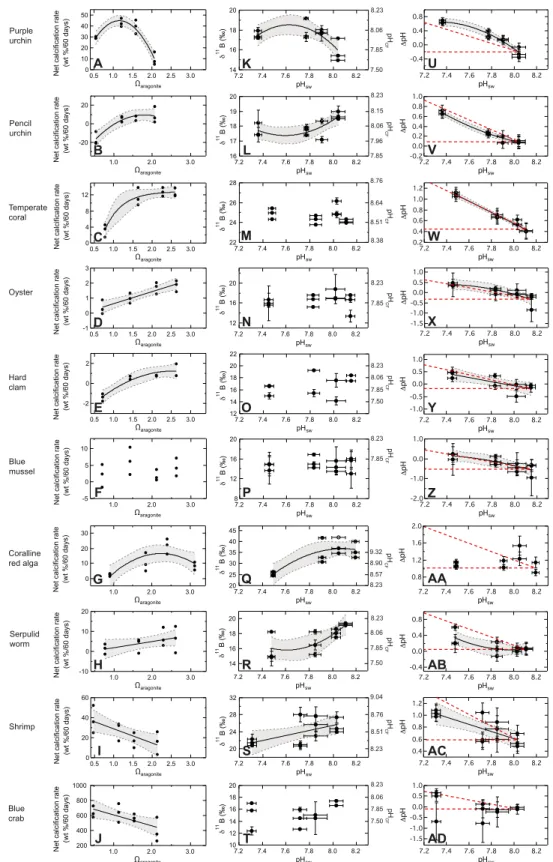
Fig. 1. Comparison of net calcification rate, 11B, pH
CF, and pH (pHCF − pHsw) responses to CO2-induced OA for the 10 investigated species of marine calcifiers.
(A) to (J) net calcification responses of the 10 species to OA. (K) to (T) 11B values of the 10 species and the boron-inferred pH
CF values versus pHsw. (U) to (AD) pH offsets of the 10 species versus pHsw; the pH control envelope, bounded by red dashed lines (see also Fig. 2) is superimposed over each plot. The 11B compositions of the 10 species ranged from 11 to 41‰, with coralline red algae exhibiting the highest 11B, followed by shrimp, temperate corals, urchins, serpulid worms, mollusks, and crabs. Values of pHCF estimated from measured 11B are plotted using the right axes of (K) through (T). In panels (U) to (AD), pH-pHsw trends below, within, and above the envelope indicate weak, moderate, and strong control over pHCF. Significant trends (P > 0.05) with 95% confidence levels are plotted as solid and dashed curve lines, respectively (see tables S1 to S3 for regression statistics). wt %, weight %.
on September 8, 2020
http://advances.sciencemag.org/
Although plotting 11B versus CO
2 is the most parsimonious
visualization of the data, we plot pHCF (calculated from shell/
skeletal 11B; see Materials and Methods) for each species across the
four pCO2 treatments from the 11B composition of the species’ shells
or skeletons (see Materials and Methods) and show these alongside 11B values in Fig. 1 (K to T). This methodology requires several key assumptions, including that the studied organisms precipitate their shells or skeletons from a discrete medium that is at least partially isolated from seawater (i.e., the calcifying fluid), that both the 11B
composition of total boron and the acid dissociation constant for boron (pKB) in the calcifying fluid and the surrounding seawater are
equivalent, that borate is the primary form of boron incorporated into the shells and skeletons of the studied organisms, and that the boron isotope fractionation factor used in the present study [Klochko et al. (21)] is accurate. Each of these assumptions has been thoroughly explored for a number of species in previous publications (16, 19) and is reviewed in the Supplementary Materials.
To our knowledge, these are the first reported measurements of 11B on the carbonate component of crustacean carapace, as well as the first reported estimates of pHCF for crustacea. The complex nature
of crustacean carapaces—which contain both chitin and carbonate components distributed within organic matrices—and uncertainty over how this material responds during the dissolution and purifi-cation steps of preparing the sample for 11B analysis may introduce additional uncertainties in the quantitative interpretation of the resulting 11B data. Furthermore, unlike many of the species examined here, the authors are not aware that any independent measurements of pHCF in crustacea have been obtained using different techniques,
which precludes cross-validation of the pHCF values estimated here
for crustacea.
The 11B data exhibit parabolic, neutral, threshold-negative, and
negative trends with decreasing pHsw (Fig. 1) with the coralline red
alga (see the Supplementary Materials for discussion of elevated 11B values), purple urchin, and blue mussel exhibiting 11B-pHsw
patterns that most closely mirror their net calcification response
patterns (Fig. 1). These results indicate that calcifying species exhibit a wide range of capacities for modifying pHCF in response to OA (table S1)
and that a species’ specific capacity for pHCF regulation does not
necessarily dictate its unique calcification response to OA. Notably, however, we found that all 10 species of calcifiers elevated pHCF relative
to pHsw in at least one of the acidified treatments, with 9 of 10 species
increasing the magnitude that pHCF is elevated relative to pHsw
(pH) with increasing pCO2. The coralline red algae, temperate corals,
shrimp, and urchins elevated pHCF above pHsw under all pHsw
con-ditions, while the oyster, hard clam, blue mussel, blue crab, and serpulid worm species elevated pHCF relative to pHsw only under some
acidi-fied conditions. Of this latter group, the serpulid worm and blue crab maintained a pHCF similar to pHsw under control conditions, while
the pHCF of the three mollusk species—the oyster, hard clam, and
blue mussel—was maintained at a lower pH than pHsw under
con-trol conditions. Notably, the mollusks, blue crabs, and temperate corals also maintained a relatively constant pHCF across pHsw
con-ditions, with pHCF averaging ca. 7.8 for the mollusks, 8.0 for the blue
crabs, and 8.5 for the temperate corals. The boron-inferred pHCF
values in this study are generally within the range of previous 11B-based, pH microelectrode–based, and pH-sensitive dye–based estimates of pHCF for many types of marine calcifiers, including
corals (22, 23) and mollusks (24).
We can also evaluate the extent to which the different species modify pHCF relative to pHsw (∆pH = pHCF − pHsw) under different
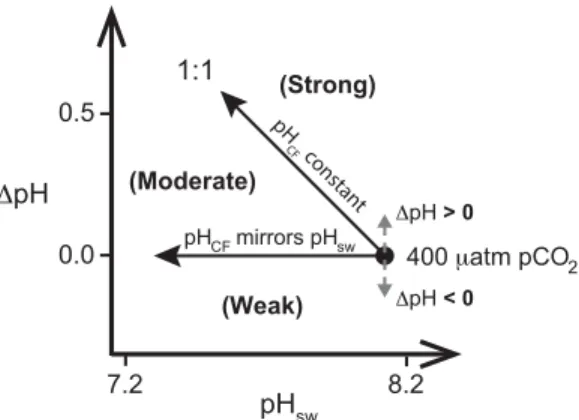
OA scenarios by superimposing a schematic “pH control envelope” (Fig. 2) on each species’ ∆pH-pHsw plot (Fig. 1). The upper boundary
of this envelope is defined by a 1:1 relationship between ∆pH and pHsw, such that species falling on this line maintain constant pHCF
as external pHsw declines. The lower boundary of the pH control
envelope is defined by the scenario in which organisms maintain a fixed ∆pH, independent of pHsw, such that changes in pHCF directly
track changes in pHsw. The envelope therefore describes three
categories of pHCF control as follows: weak control at or below
the lower boundary of the envelope, moderate control toward the center of the envelope, and strong control at or above the upper boundary (Fig. 2).
Consideration of the ∆pH versus pHsw plots (Fig. 1) in the
framework of the pH control envelope (Fig. 2 and table S3) permits additional inferences about the role of pHCF control in driving species-
level differences in calcification response to OA. For instance, ∆pH for the purple urchin varies parabolically with pHsw, with a trend
falling completely above the upper edge (i.e., 1:1 line) of the pH control envelope (Fig. 1). This finding indicates that the purple urchin has relatively strong control over pHCF to the extent that it can raise
pHCF when pCO2 increases, thereby converting some of the dissolved
inorganic carbon (DIC) at the site of calcification into additional CO32− for calcification—although the parabolic response of 11B to
pHsw indicates that this capacity is dampened for the purple urchin
under extreme pCO2. This parabolic trend in the purple urchin’s
11B-pHsw relationship is notably similar to its parabolic calcification responses to elevated pCO2 (Fig. 2), suggesting that purple urchin’s
calcification response to OA is largely dictated by its degree of control over pHCF. In contrast to the purple urchin, the pencil urchin exhibits
11B and, by extension, pHCF that decreases asymptotically with pHsw—suggesting that this species maintains a minimum pHCF
re-gardless of pHsw. The observation that the ∆pH-pHsw trend (Fig. 1)
for the pencil urchin falls in the central- upper region of the pH control envelope (moderate-strong pHCF control) is consistent with the pencil
pHsw pH 0.0 0.5 7.2 8.2 1:1
pHCF mirrors pHsw 400 atm pCO
2 pH CF constant (Weak) (Strong) (Moderate) pH > 0 pH < 0
Fig. 2. Schematic diagram of the “pH control envelope” to aid interpretation of ∆pH trends as a function of pHsw. The upper boundary of the pH control envelope
is defined by a 1:1 relationship between ∆pH and pHsw, such that pHCF remains constant regardless of pHsw. The lower boundary is defined by the scenario in which ∆pH remains fixed regardless of pHsw, such that changes in pHCF track changes in pHsw. The envelope therefore describes three categories of pHCF control: weak control at or below the lower bound of the envelope, moderate control within the envelope, and strong control at or above the upper bound of the envelope. The apex of the envelope is translated up or down relative to ∆pH = 0 if pHCF is respectively greater or less than pHsw under control pCO2 conditions.
on September 8, 2020
http://advances.sciencemag.org/
urchin’s semiresilient threshold-negative calcification response to OA (Fig. 1). The difference in 11B calcification patterns (Fig. 1) between the
two species may arise from the different habitats of the two species, with the temperate purple urchin experiencing lower and more variable pH conditions than the pencil urchin due to the elevated solubility of CO2
and increased upwelling of the purple urchin’s colder, higher latitude shelf environments versus the tropical carbonate bank environment of the pencil urchin, potentially rendering the purple urchin better adapted for calcification under challenging environmental conditions.
Analysis of 11B within the temperate coral suggests that this species
maintains an elevated but relatively constant pHCF (ca. 8.5 pHCF)
across pCO2 treatments (Fig. 1). The temperate coral’s pH-pHsw
trend falls directly on the 1:1 line of the pH control envelope (Figs. 1 and 2), indicating that this species exhibits moderate-to-strong control over pHCF when exposed to OA. Likewise, net calcification rates were
also relatively constant across pCO2 treatments, except in the highest
pCO2 treatment, where they declined precipitously, which can at least
be partly explained by rapid dissolution of exposed skeleton [previously documented at rates up to ca. 7 weight %/60 days in aragonite- undersaturated seawater (25)], rather than by the unfavorable condi-tions at the site of calcification.
Analyses of 11B within shells of the investigated mollusk species,
including the oyster, hard clam, and blue mussel, indicate that they, like the temperate coral, maintain a relatively constant pHCF (average
pHCF ~7.8) across pCO2 treatments—but at a level substantially lower
than the pHCF maintained by the other species investigated. However,
unlike all of the other species, the mollusks maintain pHCF below pHsw
under the control pCO2 treatment, but above the pHsw in the
el-evated pCO2 treatments. The observation that ∆pH-pHsw trends
for the mollusks are close to the 1:1 line of the pH control envelope (Fig. 1) suggests that the mollusks exert moderate-to-strong control over pH of their calcifying fluid—their so-called extrapallial fluid. However, the blue mussel is the only mollusk in our study that ex-hibits a calcification response to elevated pCO2 (neutral) consistent
with strong control over pHCF. The calcification responses of the hard
clam and oyster are more negative and, thus, decoupled from their apparently strong control over pHCF. This apparent decoupling of
pHCF control and calcification responses within mollusks may reflect
the apparently important roles that other physiological factors, such as ACC precursor mineral phases, organic molecules, and proteinaceous mineral templates, play in their biomineralization (10).
Analysis of 11B within the coralline red alga indicates that the pHCF of this species varies parabolically with pCO2 and exhibits a
substantial drop in pHCF under the highest pCO2 treatment. The ∆pH
for the coralline red alga also varies with pHsw, with the trend line
falling above the upper boundary of the pH control envelope (Fig. 1) under higher pHsw conditions and near the lower boundary under
lower pHsw conditions. This indicates an initially strong control over
pHCF of the coralline red alga, with this control diminishing under
higher pCO2 conditions.
Analysis of 11B within the calcareous tube of the serpulid worm
(Fig. 1) indicates that pHCF decreases asymptotically with pHsw,
sug-gesting that this species maintains a minimum pHCF regardless of
pHsw. The ∆pH trend for the serpulid worm falls in the lower portion
of the pH control envelope (moderate pHCF control), which is
con-sistent with its linearly negative calcification response to increasing pCO2 (Figs. 1 and 2).
Analyses of 11B within the crustaceans, including the blue crab and shrimp species, indicate that they too maintain elevated pHCF relative
to pHsw at the higher pCO2 treatments. In both species, pHCF declines
with decreasing pHsw. The shrimp, however, maintains a higher pHCF
than that of the blue crab. The observation that ∆pH-pHsw trends
fall toward the center of the pH control envelope (Fig. 1) for the shrimp and toward the bottom for the crab suggests that these crustaceans exert only weak-to-moderate control over their pHCF,
which is inconsistent with their unique, strongly positive net calci-fication responses to elevated pCO2. This apparent discrepancy may
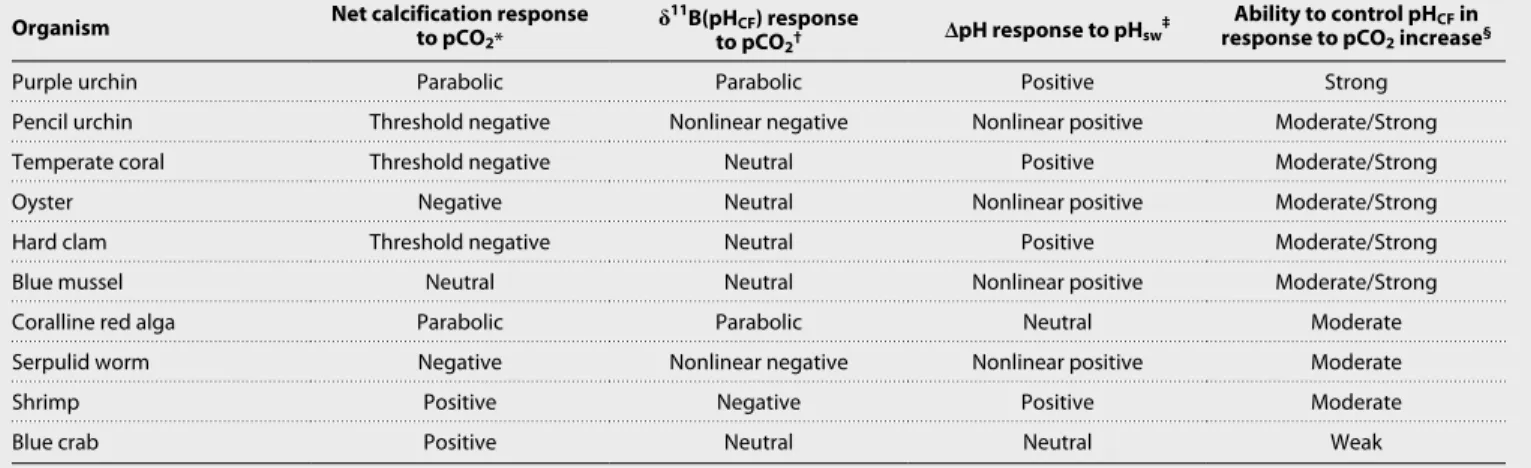
arise from the crustacean molting style of biomineralization, which requires them to mineralize an entirely new shell in a matter of hours to minimize exposure to predation during their soft-bodied phase. Table 1. Summary of the growth, boron isotope/boron–derived pHCF, and pH patterns as a function of aragonite saturation state or seawater pH and
the inferred pHCF regulation ability of the investigated organisms.
Organism Net calcification response to pCO2* 11B(pHCF) response
to pCO2† pH response to pHsw
‡ Ability to control pHCF in
response to pCO2 increase§
Purple urchin Parabolic Parabolic Positive Strong
Pencil urchin Threshold negative Nonlinear negative Nonlinear positive Moderate/Strong
Temperate coral Threshold negative Neutral Positive Moderate/Strong
Oyster Negative Neutral Nonlinear positive Moderate/Strong
Hard clam Threshold negative Neutral Positive Moderate/Strong
Blue mussel Neutral Neutral Nonlinear positive Moderate/Strong
Coralline red alga Parabolic Parabolic Neutral Moderate
Serpulid worm Negative Nonlinear negative Nonlinear positive Moderate
Shrimp Positive Negative Positive Moderate
Blue crab Positive Neutral Neutral Weak
*The net calcification response to variable pCO2 conditions as reported in Ries et al., (5). † and ‡Describes direction and shape of the best-fit regression of the 11B and pH as a function of seawater pH, respectively, via the least squares method. Detailed analysis is available in tables S2 and S3. The patterns are also shown in Fig. 1. §A species’ ability to control pHCF in response to pCO2 increase is classified based on pH versus pHsw trends relative to the theoretical pH control envelope (Fig. 2), not to the absolute offset of pHCF relative to pHsw under a single treatment.
on September 8, 2020
http://advances.sciencemag.org/
It is logical that this molting style of biomineralization would select for strong biological controls on calcification beyond, or in addition to, pHCF control to shorten their vulnerable soft-shelled stage,
which may ultimately render crustacea particularly resilient to OA. Values of ∆pH indicate that all of the investigated species elevated pH at their site of calcification relative to pH of their surrounding seawater under at least one of the elevated pCO2 treatments. However,
the considerable interspecies variation in ∆pH patterns across ex-perimental treatments indicates that the complex physiological controls that govern a species’ response to OA may be as diverse as the range of species examined. Nevertheless, the overall results of the present study are consistent with the assertion that the more control that a species exerts over its pHCF, the greater its resilience to OA, although
some species, such as the crustacea, demonstrate relatively strong resilience to OA despite exhibiting only weak-to-moderate control over pHCF (Table 1).
A species’ ability to control pHCF will be influenced by multiple
factors, including the residence time of the calcifying medium, proton transport and diffusion, formation and dissolution of shell/skeleton, input of DIC via respiration, DIC transport and diffusion, DIC re-speciation (including via the activity of enzymes like carbonic anhydrase), and, in the case of photosynthetic organisms, the photosynthetic draw-down of DIC. The rates of these processes may change under acid-ified conditions, either as a passive response to acidification (e.g., increased shell dissolution) or as an adaptive response by the organ-ism (e.g., increased proton pumping under acidified conditions). Rates of photosynthesis within marine algae have also been shown to increase under elevated pCO2, up to the point that CO2 is no longer
limiting for photosynthesis, and rates of DIC drawdown and proton release via calcification typically change under acidified conditions, both potentially affecting pHCF. For example, diel variations in
extra-cellular pH of the calicoblastic tissue of scleractinian corals have been attributed to daily cycles of respiration and photosynthesis (22), and observations of pH up to 9 within the diffusive boundary layer of algal turfs have been ascribed to the algae’s photosynthetic drawdown of aqueous CO2 (26). The balance of these diverse processes influencing
carbonate chemistry at the site of calcification may explain the range of pHCF versus pHsw relationships observed in the present experiment.
CONCLUSIONS
Boron isotope analysis of the shells and skeletons of 10 divergent marine-calcifying species cultured under various pCO2 conditions
reveals considerable interspecific differences in the regulation of pHCF
in response to OA. Although pHCF-pHsw trends for a few of the species,
including the purple urchin, coralline alga, and blue mussel, mirror net calcification responses to OA, these trends are decoupled in the majority of the species investigated, including the temperate coral, pencil urchin, hard clam, shrimp, blue crab, serpulid worm, and oyster. Despite this apparent disparity in the role that pHCF control plays in
marine calcifiers’ specific calcification response to OA, we observed that all 10 species adopted the chemically beneficial strategy of maintaining pHCF above pHsw (pH > 0) under elevated pCO2
con-ditions, indicating that the elevation of pHCF relative to pHsw is a
polyphyletic, if not universal, response among marine calcifiers to OA, even for mollusks that typically maintain pHCF below pHsw under
nonacidified conditions. Furthermore, 9 of the 10 species investigated increased the magnitude that pHCF was elevated above pHsw with
decreasing pHsw. Assuming that additional energy is required to
in-crease this pHCF-pHsw differential, these results support prior assertions
that biocalcification will be energetically more expensive for most, if not all, calcifying species under future, higher-pCO2 conditions.
MATERIALS AND METHODS
Specimen culturing
Ten species of marine calcifiers—the blue crab, Callinectes sapidus; the gulf shrimp, Penaeus plebejus; the purple urchin, Arbacia punctulata; a coralline red alga Neogoniolithon sp.; the blue mussel, Mytilus edulis; a temperate coral, Oculina arbuscula; the pencil urchin, Eucidaris tribuloides; a hard clam, Mercenaria mercenaria; a serpulid worm, Hydroides crucigera; and the eastern oyster, Crassostrea virginica—were subsampled from the prior study (5). These species were previously shown to exhibit a wide range of calcification responses to CO2-induced OA, including
negative, threshold, neutral, parabolic, and positive. A detailed de-scription of the culturing conditions is available in Ries et al. (5). In brief, specimens were cultured under four different pCO2
condi-tions (409, 606, 903, and 2856 atm) for 60 days in in seawater at constant temperature (25°C) and salinity (32 PSU). Calcium car-bonate formed exclusively under experimental conditions by these 10 species was identified relative to a 137Ba spike emplaced at the start of
the experiment. The salinity, pH, and total alkalinity of the experi-mental treatments were monitored throughout the duration of the ex-periment. Calcification rates were estimated from the percent change in buoyant weight of the specimens between the beginning and end of the experiment.
Three specimens of each species from each of the four pCO2
treatments (12 specimens total per species) were randomly selected for boron isotope analysis. However, only two specimens of the pencil urchin in the 606-atm pCO2 treatment, the hard clam in
the 409-, 606-, and 903-atm pCO2 treatments, and the blue crab in the
409- and 606-atm pCO2 treatments were analyzed due to insufficient
sample material. Calcium carbonate produced exclusively under the experimental conditions (identified relative to a Ba137 isotope marker emplaced in the skeleton at the start of the experiment) was obtained with a scalpel, gently pulverized in an agate mortar and pestle, and homogenized for boron isotopic analyses. The calcification responses of each species were defined with regression analyses and corre-sponding 95% confidence intervals. Of the 10 species investigated, only the blue mussel did not exhibit statistically significant trends in calcification rate as a function of seawater calcium carbonate saturation state (fig. S1).
MC-ICPMS measurements of boron
Boron isotopic compositions of the coralline red algae, pencil urchins, purple urchins, temperate corals, and serpulid worms were measured on a Thermo Finnigan Neptune MC-ICPMS (multicollector–inductively coupled plasma mass spectrometer) at Institut Français de Recherche pour l’Exploitation de la Mer (IFREMER), France, following the method from Sutton et al. (19).
Briefly, ca. 2 mg of dry sample was weighed and placed into an acid-cleaned microcentrifuge tube. The weighed samples were oxi-dized using a mixture of 200 l of 1% NH4OH and 1% H2O2 and
placed in an ultrasonic bath for 10 min. This was followed by 1 min of centrifugation, after which the supernatant was removed. The oxidation step was then repeated, after which the samples were rinsed with 400 l of UHQ (ultra-high-purity water sourced from a Millipore Direct-Q water purification system with a specific resistivity
on September 8, 2020
http://advances.sciencemag.org/
of 18.2 megaohm·cm) in an sonic bath for 10 min, and then cen-trifuged for 1 min—after which the supernatant was removed and measured for pH. The rinsing process was repeated until pH of the supernatant reached ca. 7, indicating removal of NH4OH. Samples
were then washed with 20 l of 0.001 M HNO3 and rinsed with 400 l
of UHQ water as described above. Samples were then dissolved in a mixture of 300 l of 0.05 M HNO3 and 70 l of 3 N HNO3 for ca.
20 hours. Approximately 180 l of 2% NH4OH was added after the
dissolution of the carbonate material to bring the pH back up to ca 7 to 8, which is required to successfully recover boron with the exchange resin used [Amberlite IRA 743; (27)].
Following the batch method described by Sutton et al. (19), Amberlite IRA 743 resin was used to extract boron from the sample matrices (19). Roughly 20 l of Amberlite IRA 743 resin (crushed and sieved to a 100 to 200 mesh) was placed in a 500-l acid-cleaned centrifuge tube and cleaned with 500 l of 0.5 N HNO3 to remove
boron absorbed by the resin. Following the acid wash, the resin was rinsed three times with UHQ water (buffered to pH 7 with 2% NH4OH) three times to elute unwanted cations and to condition the
resin to pH 7. A cleaned and conditioned dissolved carbonate sample (see above for details) was then placed into a microcentrifuge tube containing clean resin. The vial was capped and shaken for 30 min to ensure that the sample solution contacted the resin. The mixture was then centrifuged for 1 min and decanted. The resin was rinsed with 200 l of UHQ three times for 15 min to wash out the cations from the solution. Afterward, boron was recovered by adding 500 l of 0.05 N HNO3 to the vials and allowing 15 min for ion exchange.
After 1 min of centrifugation, the supernatant was transferred to an acid-cleaned 2-ml vial and analyzed for boron concentration and isotope composition using a MC-ICPMS.
To reduce boron memory effects [see Sutton et al. (19) for details], we applied an in-line ammonia gas flush with 3.0-ml/min flow rate. To account for drift in mass discrimination during analysis, samples were bracketed by standards (NIST SRM951) of similar concentra-tions to the samples [ca. 65 parts per billion (ppb) of boron in 0.05 N HNO3]. The mean values and reproducibilities of the international coral
standard JCp-1 and a laboratory coral standard, NEP, are 25.15 ± 0.87‰ (2, n = 5) and 26.18 ± 1.04‰ (2, n = 5), respectively.
TE-NTIMS measurements of B
Boron isotopic compositions of the crabs, shrimp, oysters, and hard clams were measured on a Thermo Finnigan Triton multicollector thermal ionization mass spectrometry (TIMS) under negative ion mode at the Institute of Earth Sciences, Academia Sinica, Taiwan. The total evaporation NTIMS (TE-NTIMS) method was applied to overcome the low concentration of boron in the shells of the crustacea and mollusks and high organic content in the crustacea. Samples were prepared for TE-NTIMS analysis via microsublimation of the sample solution to remove organic matter (e.g., CNO−) (28), which is known to interfere with boron analysis via negative thermal ionization mass spectrometry (NTIMS). This method was developed for and applied to measuring boron isotopes within a range of sample types, including seawater and bivalve shells (29, 30).
Cleaning, purification, and analysis of boron isotopes via TE- NTIMS followed the procedure from Liu et al. (30). In brief, sample powders were first cleaned with high-purity Milli-Q (MQ) water in an ultrasonic bath three times and then centrifuged, after which the supernatant was removed. Samples were then treated overnight with 10% H2O2 buffered with NaOH at room temperature to remove
or-ganic particles from the sample matrix. The samples were rinsed with MQ water, then with 0.001 N HNO3, and then with MQ water again.
After drying at 60°C, samples were weighed and dissolved in ca. 1.7 N HCl, yielding a boron concentration of approximately 750 ppb. Less than 50 l of sample solution was loaded onto the cap of a conical- bottom vial in an inverted position and put into the high-throughput system described in Liu et al. (29). To further clean the samples and improve reproducibility of the boron analysis of the calcium carbonate samples, an extra 2 l of 30% H2O2 was added to the purified solution
and reacted for 2 hours. One microliter of the purified solution was then loaded onto outgassed Re filament for a single run using the total evaporation method. The mean value and reproducibility of the coral standard NEP before the replacement of the ion source was 24.54 ± 1.73‰ (2, n = 6). After replacement of the ion source, the mean values and reproducibility of the coral standards JCp-1 and NEP were 23.71 ± 1.64‰ (2, n = 15) and 25.56 ± 1.94‰ (2, n = 6), respectively.
Comparison of the accuracy and precision of the MC-ICPMS and TE-NTIMS methods for analyzing boron isotope composition
The mean values and reproducibility of carbonate standards JCp-1 and NEP measured on MC-ICPMS were 25.15 ± 0.87‰ (2, n = 5) and 26.18 ± 1.04‰ (2, n = 5), respectively. This results in an un-certainty in calculated pHCF of 0.09 to 0.10 pH units. The mean values
and reproducibility of NEP on TE-NTIMS (before and after the replace-ment of the ion source) was 24.54 ± 1.73‰ (2, n = 6) and 25.56 ± 1.94‰ (2, n = 6), respectively, resulting in an uncertainty in calculated pHCF of ca. 0.18 pH units. The long-term mean value and
reproducibility of JCp-1 measured on TE-NTIMS was 23.71 ± 1.64‰ (2, n = 15). Although the precision of the 11B data obtained by MC-ICPMS was higher than that obtained by TE-NTIMS, the total sample required for TE-NTIMS analysis is about 1/20 of that required for MC-ICPMS, rendering TE-NTIMS the optimal method for analyzing the boron isotopic composition of calcium carbonate samples with low boron concentrations.
Calculations of pH and carbonate system parameters
Boron isotopic composition of the measured biogenic carbonates was converted to calcification site pH (pHCF) with the following equation
pH CF = pK B − log ( 11 B sw − 11 B CaCO3 ───────────────────── × 11 B CaCO3 − 11 B sw + 1000( − 1) ) where 11B
CaCO3 is 11B of biogenic calcium carbonate, pKB = 8.6152
at 25°C and 32 PSU (31), 11B
sw (11B of total seawater boron) =
39.61‰ (32), and = 1.0272 (21). The uncertainties and assump-tions have been explored for a number of the investigated species in previous publications (16, 19) and are reviewed here in the Supple-mentary Materials.
The offset between pHsw and pHCF is defined as ∆pH = pHCF −
pHsw. The analytical errors (2) of the boron isotopic analyses, derived
from repeat analyses of samples, seawater, and standards, were 0.87‰ and 1.73‰ for the MC-ICPMS and TE-NTIMS methods, respectively. This analytical error was propagated through the pHCF
calculations via the Monte Carlo simulation. Propagated uncertainties were between 0.03 and 0.91 pH units.
Full seawater carbonate chemistry of each replicate experimental treatment was determined from the direct measurement of seawater
on September 8, 2020
http://advances.sciencemag.org/
parameters, including pCO2, temperature, salinity, total alkalinity,
and pH, and has been previously reported (table S1) (5). Statistical methods
All regression analyses were performed via least squares method, with linear and quadratic models used to investigate general trends in the data. The regression analysis and corresponding 95% confidence interval that minimized the root mean square error (RMSE) are shown in Fig. 1 and fig. S1 and described in tables S2 and S3. Note that re-gression models only represent general trends of the data and do not necessarily implicate specific physical or biological mechanism(s).
SUPPLEMENTARY MATERIALS
Supplementary material for this article is available at http://advances.sciencemag.org/cgi/ content/full/6/5/eaax1314/DC1
Section S1. Species selection
Section S2. Consideration of the potential for non-pH effects on calcium carbonate 11B
Fig. S1. Calcification response patterns of the full sample collection and of the subset of samples used in this study.
Table S1. Seawater chemistry (pCO2 in atm, total alkalinity (TA) in umol/kg-SW, pHsw), net
calcification rate (% change/60 days), 11B (‰) of biogenic CaCO3, calcification site pH (pHCF),
and ∆pH (pHCF − pHsw).
Table S2. Linear and quadratic regression analysis of boron isotopic composition (11B) of
biogenic carbonates as a function of seawater pH via the least squares method.
Table S3. Linear and quadratic regression analysis of ∆pH as a function of seawater pH via the least squares method.
References (33–41)
REFERENCES AND NOTES
1. S. C. Doney, V. J. Fabry, R. A. Feely, J. A. Kleypas, Ocean acidification: The other CO2
problem. Ann. Rev. Mar. Sci. 1, 169–192 (2009).
2. IPCC, Climate change 2014: synthesis report. Contribution of Working Groups I, II and III to
the fifth assessment report of the Intergovernmental Panel on Climate Change, Core Writing
Team, R.K, Pachauri, L.A. Meyer, Eds. (IPCC, 2014), pp. 151.
3. J. C. Orr, V. J. Fabry, O. Aumont, L. Bopp, S. C. Doney, R. A. Feely, A. Gnanadesikan, N. Gruber, A. Ishida, F. Joos, R. M. Key, K. Lindsay, E. Maier-Reimer, R. Matear, P. Monfray, A. Mouchet, R. G. Najjar, G.-K. Plattner, K. B. Rodgers, C. L. Sabine, J. L. Sarmiento, R. Schlitzer, R. D. Slater, I. J. Totterdell, M.-F. Weirig, Y. Yamanaka, A. Yool, Anthropogenic ocean acidification over the twenty-first century and its impact on calcifying organisms.
Nature 437, 681–686 (2005).
4. G. E. Hofmann, J. P. Barry, P. J. Edmunds, R. D. Gates, D. A. Hutchins, T. Klinger, M. A. Sewell, The effect of ocean acidification on calcifying organisms in marine ecosystems: An organism-to-ecosystem perspective. Annu. Rev. Ecol. Evol. Syst. 41, 127–147 (2010).
5. J. B. Ries, A. L. Cohen, D. C. McCorkle, Marine calcifiers exhibit mixed responses to CO2-induced ocean acidification. Geology 37, 1131–1134 (2009).
6. K. J. Kroeker, R. L. Kordas, R. Crim, I. E. Hendriks, L. Ramajo, G. S. Singh, C. M. Duarte, J.-P. Gattuso, Impacts of ocean acidification on marine organisms: Quantifying sensitivities and interaction with warming. Glob. Chang. Biol. 19, 1884–1896 (2013). 7. J. Meyer, U. Riebesell, Reviews and syntheses: Responses of coccolithophores to ocean
acidification: a meta-analysis. Biogeosciences 12, 1671–1682 (2015).
8. M. N. Müller, T. W. Trull, G. M. Hallegraeff, Differing responses of three Southern Ocean Emiliania huxleyi ecotypes to changing seawater carbonate chemistry. Mar. Ecol. Prog.
Ser. 531, 81–90 (2015).
9. J. B. Ries, A physicochemical framework for interpreting the biological calcification response to CO2-induced ocean acidification. Geochim. Cosmochim. Acta 75, 4053–4064 (2011).
10. L. Addadi, S. Raz, S. Weiner, Taking advantage of disorder: Amorphous calcium carbonate and its roles in biomineralization. Adv. Mater. 15, 959–970 (2003).
11. N. Vidavsky, S. Addadi, A. Schertel, D. Ben-Ezra, M. Shpigel, L. Addadi, S. Weiner, Calcium transport into the cells of the sea urchin larva in relation to spicule formation. Proc. Natl.
Acad. Sci. U.S.A. 113, 12637–12642 (2016).
12. T. Mass, A. J. Giuffre, C.-Y. Sun, C. A. Stifler, M. J. Frazier, M. Neder, N. Tamura, C. V. Stan, M. A. Marcus, P. U. P. A. Gilbert, Amorphous calcium carbonate particles form coral skeletons. Proc. Natl. Acad. Sci. U.S.A. 114, E7670–E7678 (2017).
13. S. Von Euw, Q. Zhang, V. Manichev, N. Murali, J. Gross, L. C. Feldman, T. Gustafsson, C. Flach, R. Mendelsohn, P. G. Falkowski, Biological control of aragonite formation in stony corals. Science 356, 933–938 (2017).
14. C. E. Cornwall, S. Comeau, T. M. DeCarlo, B. Moore, Q. D’Alexis, M. T. McCulloch, Resistance of corals and coralline algae to ocean acidification: Physiological control of calcification under natural pH variability. Proc. Biol. Sci. 285, 20181168 (2018).
15. H. K. Donald, J. B. Ries, J. A. Stewart, S. E. Fowell, G. L. Foster, Boron isotope sensitivity to seawater pH change in a species of Neogoniolithon coralline red alga.
Geochim. Cosmochim. Acta 217, 240–253 (2017).
16. Y.-W. Liu, R. A. Eagle, S. M. Aciego, R. E. Gilmore, J. B. Ries, A coastal coccolithophore maintains pH homeostasis and switches carbon sources in response to ocean acidification. Nat. Commun. 9, 2857 (2018).
17. M. T. McCulloch, J. P. D’Olivo, J. Falter, L. Georgiou, M. Holcomb, P. Montagna, J. A. Trotter, Boron isotopic systematics in scleractinian corals and the role of pH up-regulation, in
Boron Isotopes: The Fifth Element, H. Marschall, G. Foster, Eds. (Springer International
Publishing, Cham, 2018), pp. 145–162.
18. D. E. Penman, B. Hönisch, E. T. Rasbury, N. G. Hemming, H. J. Spero, Boron, carbon, and oxygen isotopic composition of brachiopod shells: Intra-shell variability, controls, and potential as a paleo-pH recorder. Chem. Geol. 340, 32–39 (2012).
19. J. N. Sutton, Y.-W. Liu, J. B. Ries, M. Guillermic, E. Ponzevera, R. A. Eagle, 11B as monitor
of calcification site pH in divergent marine calcifying organisms. Biogeosciences 15, 1447–1467 (2018).
20. J. W. B. Rae, Boron isotopes in foraminifera: Systematics, biomineralisation, and CO2 reconstruction, in Boron Isotopes: The Fifth Element, H. Marschall, G. Foster, Eds. (Springer International Publishing, Cham, 2018), pp. 107–143.
21. K. Klochko, A. J. Kaufman, W. Yao, R. H. Byrne, J. A. Tossell, Experimental measurement of boron isotope fractionation in seawater. Earth Planet. Sci. Lett. 248, 276–285 (2006).
22. F. A. Al-Horani, S. M. Al-Moghrabi, D. de Beer, The mechanism of calcification and its relation to photosynthesis and respiration in the scleractinian coral Galaxea fascicularis.
Mar. Biol. 142, 419–426 (2003).
23. A. A. Venn, E. Tambutté, M. Holcomb, J. Laurent, D. Allemand, S. Tambutté, Impact of seawater acidification on pH at the tissue–skeleton interface and calcification in reef corals. Proc. Natl. Acad. Sci. U.S.A. 110, 1634–1639 (2013).
24. M. A. Crenshaw, The inorganic composition of molluscan extrapallial fluid. Biol. Bull. 143, 506–512 (1972).
25. J. B. Ries, M. N. Ghazaleh, B. Connolly, I. Westfield, K. D. Castillo, Impacts of seawater saturation state (A = 0.4–4.6) and temperature (10, 25 °C) on the dissolution kinetics of whole-shell biogenic carbonates. Geochim. Cosmochim. Acta 192, 318–337 (2016). 26. J. A. Short, O. Pedersen, G. A. Kendrick, Turf algal epiphytes metabolically induce local pH
increase, with implications for underlying coralline algae under ocean acidification.
Estuar. Coast. Shelf Sci. 164, 463–470 (2015).
27. E. Kiss, Ion-exchange separation and spectrophotometric determination of boron in geological materials. Anal. Chim. Acta 211, 243–256 (1988).
28. N. G. Hemming, G. N. Hanson, A procedure for the isotopic analysis of boron by negative thermal ionization mass spectrometry. Chem. Geol. 114, 147–156 (1994).
29. Y.-W. Liu, S. M. Aciego, A. D. Wanamaker Jr., B. K. Sell, A high-throughput system for boron microsublimation and isotope analysis by total evaporation thermal ionization mass spectrometry. Rapid Commun. Mass Spectrom. 27, 1705–1714 (2013).
30. Y.-W. Liu, S. M. Aciego, A. D. Wanamaker Jr., Environmental controls on the boron and strontium isotopic composition of aragonite shell material of cultured Arctica
islandica. Biogeosciences 12, 3351–3368 (2015).
31. A. G. Dickson, Thermodynamics of the dissociation of boric acid in synthetic seawater from 273.15 to 318.15 K. Deep Sea Res. Part A 37, 755–766 (1990).
32. G. L. Foster, P. A. E. Pogge, von Strandmann, J. W. B. Rae, Boron and magnesium isotopic composition of seawater. Geochem. Geophys. Geosyst. 11, Q08015 (2010).
33. J. B. Ries, Skeletal mineralogy in a high-CO2 world. J. Exp. Mar. Bio. Ecol. 403, 54–64
(2011).
34. E. Balan, F. Pietrucci, C. Gervais, M. Blanchard, J. Schott, J. Gaillardet, First-principles study of boron speciation in calcite and aragonite. Geochim. Cosmochim. Acta 193, 119–131 (2016).
35. J. R. Farmer, O. Branson, J. Uchikawa, D. E. Penman, B. Hönisch, R. E. Zeebe, Boric acid and borate incorporation in inorganic calcite inferred from B/Ca, boron isotopes and surface kinetic modeling. Geochim. Cosmochim. Acta 244, 229–247 (2019). 36. V. Mavromatis, V. Montouillout, J. Noireaux, J. Gaillardet, J. Schott, Characterization
of boron incorporation and speciation in calcite and aragonite from co-precipitation experiments under controlled pH, temperature and precipitation rate. Geochim.
Cosmochim. Acta 150, 299–313 (2015).
37. J. Noireaux, V. Mavromatis, J. Gaillardet, J. Schott, V. Montouillout, P. Louvat, C. Rollion-Bard, D. R. Neuville, Crystallographic control on the boron isotope paleo-pH proxy. Earth
Planet. Sci. Lett. 430, 398–407 (2015).
38. G. D. Saldi, J. Noireaux, P. Louvat, L. Faure, E. Balan, J. Schott, J. Gaillardet, Boron isotopic fractionation during adsorption by calcite – implication for the seawater pH proxy.
Geochim. Cosmochim. Acta 240, 255–273 (2018).
on September 8, 2020
http://advances.sciencemag.org/
39. M. Stumpp, M. Y. Hu, F. Melzner, M. A. Gutowska, N. Dorey, N. Himmerkus,
W. C. Holtmann, S. T. Dupont, M. C. Thorndyke, M. Bleich, Acidified seawater impacts sea urchin larvae pH regulatory systems relevant for calcification. Proc. Natl. Acad. Sci. U.S.A. 109, 18192–18197 (2012).
40. M. Cusack, N. A. Kamenos, C. Rollion-Bard, G. Tricot, Red coralline algae assessed as marine pH proxies using 11B MAS NMR. Sci. Rep. 5, 8175 (2015).
41. L. C. Hofmann, K. Schoenrock, D. de Beer, Arctic coralline algae elevate surface pH and carbonate in the dark. Front. Plant Sci. 9, 1416 (2018).
Acknowledgments
Funding: This work was supported by the “Laboratoire d’Excellence” LabexMER (ANR-10-LABX-19) and cofunded by a grant from the French government under the program “Investissements d’Avenir”. R.A.E. and J.B.R. acknowledge support from NSF grants OCE-1437166 and OCE-1437371. R.A.E. also acknowledges support from the Pritzker Endowment to UCLA IoES. Y.-W.L. acknowledges the support of a postdoctoral fellowship from the Institute of Earth Sciences, Academia Sinica, Taiwan. Author Contributions: R.A.E. and J.B.R. conceived of the original study. R.A.E., Y.-W.L., and J.B.R.
designed the research. J.B.R. performed the culture experiment and characterized the polymorph mineralogy and calcification rates of the specimens. Y.-W.L. and J.N.S. performed the isotope analyses. Y.-W.L. analyzed the data and drafted the manuscript, with input from R.A.E., J.N.S., and J.B.R. All authors contributed to the revision of the manuscript. Competing interests: All authors declare that they have no competing interests. Data and materials availability: All data needed to evaluate the conclusions in the paper are present in the paper and/or the Supplementary Materials. Additional data related to this paper may be requested from the authors.
Submitted 24 February 2019 Accepted 21 November 2019 Published 29 January 2020 10.1126/sciadv.aax1314
Citation: Y.-W. Liu, J. N. Sutton, J. B. Ries, R. A. Eagle, Regulation of calcification site pH is a polyphyletic but not always governing response to ocean acidification. Sci. Adv. 6, eaax1314 (2020).
on September 8, 2020
http://advances.sciencemag.org/
DOI: 10.1126/sciadv.aax1314 (5), eaax1314.
6 Sci Adv
ARTICLE TOOLS http://advances.sciencemag.org/content/6/5/eaax1314
MATERIALS
SUPPLEMENTARY http://advances.sciencemag.org/content/suppl/2020/01/27/6.5.eaax1314.DC1
REFERENCES
http://advances.sciencemag.org/content/6/5/eaax1314#BIBL
This article cites 38 articles, 6 of which you can access for free
PERMISSIONS http://www.sciencemag.org/help/reprints-and-permissions
Terms of Service
Use of this article is subject to the
is a registered trademark of AAAS.
Science Advances
York Avenue NW, Washington, DC 20005. The title
(ISSN 2375-2548) is published by the American Association for the Advancement of Science, 1200 New
Science Advances
License 4.0 (CC BY-NC).
Science. No claim to original U.S. Government Works. Distributed under a Creative Commons Attribution NonCommercial Copyright © 2020 The Authors, some rights reserved; exclusive licensee American Association for the Advancement of
on September 8, 2020
http://advances.sciencemag.org/