HAL Id: hal-02655358
https://hal.inrae.fr/hal-02655358
Submitted on 29 May 2020
HAL is a multi-disciplinary open access
archive for the deposit and dissemination of
sci-entific research documents, whether they are
pub-lished or not. The documents may come from
teaching and research institutions in France or
abroad, or from public or private research centers.
L’archive ouverte pluridisciplinaire HAL, est
destinée au dépôt et à la diffusion de documents
scientifiques de niveau recherche, publiés ou non,
émanant des établissements d’enseignement et de
recherche français ou étrangers, des laboratoires
publics ou privés.
Genomic conservation of cattle microsatellite loci in wild
gaur (Bos gaurus) and current genetic status of this
species in Vietnam.
Trung Thanh Nguyen, Sem Genini, Linh Chi Bui, Peter Voegeli, Gerald
Stranzinger, Jean Paul Renard, Jean-Charles Maillard, Bui Xuan Nguyen
To cite this version:
Trung Thanh Nguyen, Sem Genini, Linh Chi Bui, Peter Voegeli, Gerald Stranzinger, et al.. Genomic
conservation of cattle microsatellite loci in wild gaur (Bos gaurus) and current genetic status of this
species in Vietnam.. BMC Genetics, BioMed Central, 2007, 8 (77), 8p. �hal-02655358�
Open Access
Research article
Genomic conservation of cattle microsatellite loci in wild gaur (Bos
gaurus) and current genetic status of this species in Vietnam
Trung Thanh Nguyen
†1, Sem Genini
†2, Linh Chi Bui
1, Peter Voegeli
3,
Gerald Stranzinger
3, Jean-Paul Renard
4, Jean-Charles Maillard
5and
Bui Xuan Nguyen*
1Address: 1Vietnamese Academy of Sciences and Technology, Hanoi, Vietnam, 2Parco Tecnologico Padano (PTP), CERSA, Via Einstein, 26900 Lodi,
Italy, 3Institute of Animal Sciences, Breeding Biology, Swiss Federal Institute of Technology, 8092 Zurich, Switzerland, 4UMR Biologie du
Développement et de la Reproduction. INRA, 78350 Jouy en Josas, France and 5Centre de Coopération Internationale en Recherche Agronomique
pour le Développement (CIRAD), Montpellier, France
Email: Trung Thanh Nguyen - nguyentt@mnhn.fr; Sem Genini - sem.genini@tecnoparco.org; Linh Chi Bui - linh-chi.bui@univ-paris5.fr; Peter Voegeli - peter.voegeli@inw.agrl.ethz.ch; Gerald Stranzinger - irmtraut.gerald@ggaweb.ch; Jean-Paul Renard -
jean-paul.renard@jouy.inra.fr; Jean-Charles Maillard - jean-charles.maillard@cirad.fr; Bui Xuan Nguyen* - saola@netnam.vn * Corresponding author †Equal contributors
Abstract
Background: The wild gaur (Bos gaurus) is an endangered wild cattle species. In Vietnam, the total number of wild gaurs
is estimated at a maximum of 500 individuals. Inbreeding and genetic drift are current relevant threats to this small population size. Therefore, information about the genetic status of the Vietnamese wild gaur population is essential to develop strategies for conservation and effective long-term management for this species. In the present study, we performed cross-species amplification of 130 bovine microsatellite markers, in order to evaluate the applicability and conservation of cattle microsatellite loci in the wild gaur genome. The genetic diversity of Vietnamese wild gaur was also investigated, based on data collected from the 117 successfully amplified loci.
Results: One hundred-thirty cattle microsatellite markers were tested on a panel of 11 animals. Efficient amplifications
were observed for 117 markers (90%) with a total of 264 alleles, and of these, 68 (58.1%) gave polymorphic band patterns. The number of alleles per locus among the polymorphic markers ranged from two to six. Thirteen loci (BM1314, BM2304, BM6017, BMC2228, BMS332, BMS911, CSSM023, ETH123, HAUT14, HEL11, HEL5, ILSTS005 and INRA189) distributed on nine different cattle chromosomes failed to amplify wild gaur genomic DNA. Three cattle Y-chromosome specific microsatellite markers (INRA124, INRA126 and BM861) were also highly specific in wild gaur, only displaying an amplification product in the males. Genotype data collected from the 117 successfully amplified microsatellites were used to assess the genetic diversity of this species in Vietnam. Polymorphic Information Content (PIC) values varied between 0.083 and 0.767 with a mean of 0.252 while observed heterozygosities (Ho) ranged from 0.091 to 0.909 (mean of 0.269). Nei's unbiased mean heterozygosity and the mean allele number across loci were 0.298 and 2.2, respectively.
Conclusion: Extensive conservation of cattle microsatellite loci in the wild gaur genome, as shown by our results,
indicated a high applicability of bovine microsatellites for genetic characterization and population genetic studies of this species. Moreover, the low genetic diversity observed in Vietnamese wild gaur further underlines the necessity of specific strategies and appropriate management plans to preserve this endangered species from extinction.
Published: 6 November 2007
BMC Genetics 2007, 8:77 doi:10.1186/1471-2156-8-77
Received: 28 May 2007 Accepted: 6 November 2007 This article is available from: http://www.biomedcentral.com/1471-2156/8/77
© 2007 Nguyen et al; licensee BioMed Central Ltd.
This is an Open Access article distributed under the terms of the Creative Commons Attribution License (http://creativecommons.org/licenses/by/2.0), which permits unrestricted use, distribution, and reproduction in any medium, provided the original work is properly cited.
BMC Genetics 2007, 8:77 http://www.biomedcentral.com/1471-2156/8/77
Background
The wild gaur, also known as the Indian bison or sela-dang, is a member of the subfamily Bovinae and is cur-rently classified among endangered species and listed as vulnerable by International Union for Conservation of Nature and Natural Resources [1]. According to the Asian Wild Cattle Conservation Assessment and Management Plan (CAMP – [2]), three wild subspecies are generally rec-ognized, including Bos gaurus laosiensis (Myanmar to China), Bos gaurus hubbacki (Thailand and Malaysia) and Bos gaurus gaurus (India and Nepal). Recently, the species name Bos gaurus was suggested for wild gaur instead of Bibos gauris or Bos frontalis by the International Commis-sion on Zoological Nomenclature [3]; this name is cur-rently used.
The gaur is one of the most impressive and largest of the wild cattle. A typical adult wild gaur bull may measure up to two meters at the shoulders and 900 kg in weight [4]. Gaurs are gregarious animals that live in hilly terrains below an altitude of 1,800 meters in herds ranging from 6 to 40 individuals. The distribution of wild gaur includes areas of southern and south-eastern Asia, from India to peninsular Malaysia, occurring in India, Nepal, Bhutan, Bangladesh, Myanmar, Thailand, China, Laos, Cambodia, Vietnam and Malaysia [5,6]. In India, wild gaurs have been probably domesticated about 2500 years ago [7], mainly for work and meat [8]. Domesticated gaurs are referred to as "gayal" or "mithan" (Bos frontalis) and are completely interfertile with their wild relatives [9], which display a karyotype of 2n = 58 [10]. Furthermore, herders breed mithans or cross them with cattle to obtain off-spring with enhanced production and performance, how-ever usually only F1 females are fertile and can be used for further breeding purposes.
The global population of wild gaur ranges from 13,000 to 30,000 with a population of mature individuals between 5,200 and 18,000. In the last decades, the number of wild gaurs decreased dramatically due to the loss of suitable habitat (in favour of agriculture and its domestic counter-part), hunting or hybridization with domestic cattle [11]. The latter threat also caused the transmission and out-break of various devastating diseases, such as foot-and-mouth, rinderpest and anthrax [12]. In Vietnam, the total number of wild gaurs is estimated at a maximum of 500 individuals of which 10% distributed in the Cat Tien National Park, localized close to the Ho Chi Minh City in the south of the country. During 1991–1995, 120 wild gaurs were reported to be killed (more than one genera-tion [1]). Thus, informagenera-tion about the current genetic sta-tus of the Vietnamese wild gaur population is important and necessary to develop strategies for conservation and effective long-term management for this species.
Successful amplification and extensive conservation of cattle microsatellite sequences in several species of Bovi-dae and CerviBovi-dae families have been documented in numerous works [13,14], thus allowing possible popula-tion genetic studies on related Bovidae species for which microsatellites have not been developed [15-18]. Further-more, cross-species amplification was also applied to the study of population variations in geographically isolated or endangered species [19,20]. These studies suggest that a characterization of wild gaur, as a member of the sub-family Bovinae, with bovine microsatellite markers is highly pertinent and suitable.
Previous genetic studies were carried out on gaur [21,22], however they were limited to a domesticated group of Bos frontalis and only a low number of cattle microsatellites were analyzed. Therefore, the questions about the conser-vation of cattle microsatellite DNA sequences, as well as the applicability of these markers for population genetic studies in Bos gaurus remain open.
The principal aims of this study were (1) to evaluate the applicability and conservation of cattle microsatellite DNA sequences in the wild gaur genome and (2) to esti-mate the current genetic status of this species in Vietnam.
Results and discussion
One hundred-thirty cattle microsatellite markers were tested for amplification of genomic DNA from a panel of 11 wild gaurs. Three Brown Swiss cattles (Bos taurus) were used as positive control. Although some amplification failures were observed, 90% of the microsatellites from cattle could be successfully amplified by PCR on gaur genomic DNA, of which 68 markers (58.1%) were poly-morphic. A total of 264 alleles were detected across the 117 amplified loci with the number of alleles ranging from one to six (Table 1) with a mean of 2.2 alleles per locus. Thirteen microsatellites (10%) distributed on cattle chromosomes 8 (BM2304), 10 (ILSTS005), 18 (HAUT14), 21 (HEL5), 24 (CSSM023), 26 (BM1314, BMS332 and HEL11), 29 (BMC2228), X (BM6017, BMS911 and ETH123) and Y (INRA189), respectively, failed to amplify in wild gaur. Notably, the non-amplification of locus ILSTS005 indicated the absence of this sequence in both wild gaur and mithan [22]. As expected, all the microsat-ellite markers could be successfully amplified in the posi-tive control samples (Bos taurus), with 92% of them being polymorphic.
The applicability of bovine microsatellite markers for genetic studies in several Bovidae species has been reported in different studies and demonstrated extensive genomic conservation of cattle DNA microsatellite sequences during evolution. However, this conservation varies consistently within the Bovidae subfamilies and
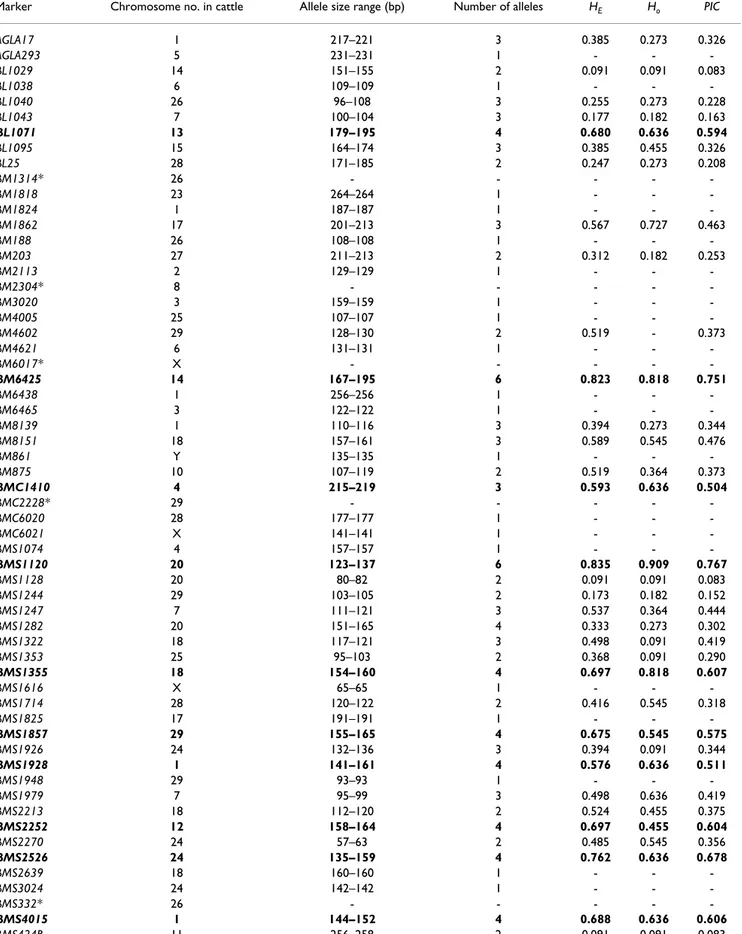
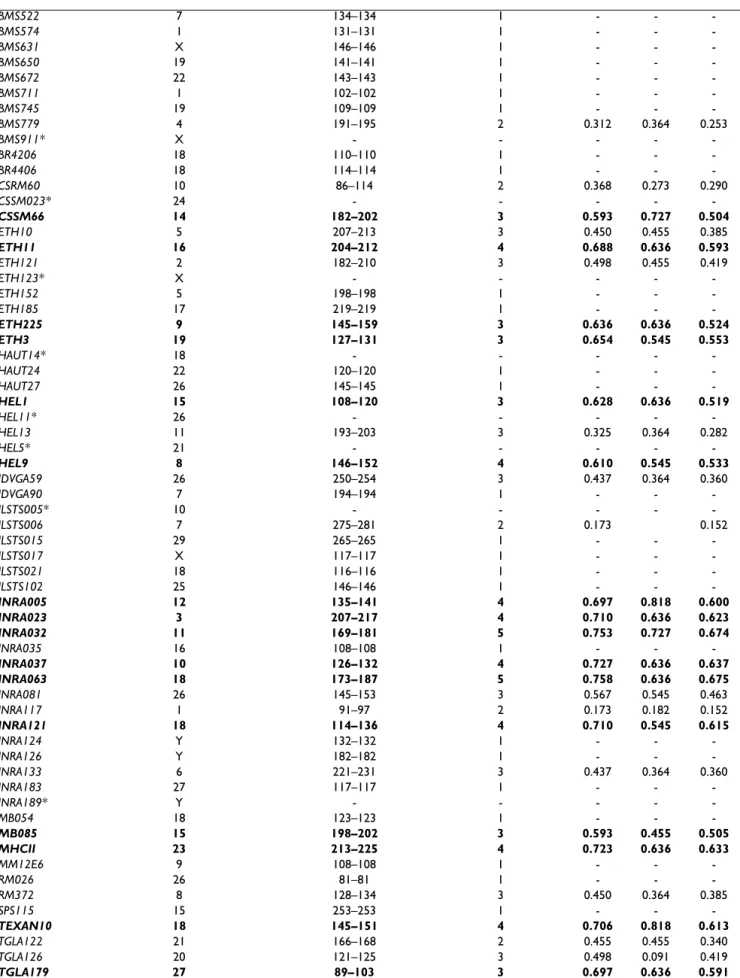
Table 1: Characterisation of 130 bovine microsatellites tested on a panel of 11 wild gaurs
Marker Chromosome no. in cattle Allele size range (bp) Number of alleles HE Ho PIC
AGLA17 1 217–221 3 0.385 0.273 0.326 AGLA293 5 231–231 1 - - -BL1029 14 151–155 2 0.091 0.091 0.083 BL1038 6 109–109 1 - - -BL1040 26 96–108 3 0.255 0.273 0.228 BL1043 7 100–104 3 0.177 0.182 0.163 BL1071 13 179–195 4 0.680 0.636 0.594 BL1095 15 164–174 3 0.385 0.455 0.326 BL25 28 171–185 2 0.247 0.273 0.208 BM1314* 26 - - - - -BM1818 23 264–264 1 - - -BM1824 1 187–187 1 - - -BM1862 17 201–213 3 0.567 0.727 0.463 BM188 26 108–108 1 - - -BM203 27 211–213 2 0.312 0.182 0.253 BM2113 2 129–129 1 - - -BM2304* 8 - - - - -BM3020 3 159–159 1 - - -BM4005 25 107–107 1 - - -BM4602 29 128–130 2 0.519 - 0.373 BM4621 6 131–131 1 - - -BM6017* X - - - - -BM6425 14 167–195 6 0.823 0.818 0.751 BM6438 1 256–256 1 - - -BM6465 3 122–122 1 - - -BM8139 1 110–116 3 0.394 0.273 0.344 BM8151 18 157–161 3 0.589 0.545 0.476 BM861 Y 135–135 1 - - -BM875 10 107–119 2 0.519 0.364 0.373 BMC1410 4 215–219 3 0.593 0.636 0.504 BMC2228* 29 - - - - -BMC6020 28 177–177 1 - - -BMC6021 X 141–141 1 - - -BMS1074 4 157–157 1 - - -BMS1120 20 123–137 6 0.835 0.909 0.767 BMS1128 20 80–82 2 0.091 0.091 0.083 BMS1244 29 103–105 2 0.173 0.182 0.152 BMS1247 7 111–121 3 0.537 0.364 0.444 BMS1282 20 151–165 4 0.333 0.273 0.302 BMS1322 18 117–121 3 0.498 0.091 0.419 BMS1353 25 95–103 2 0.368 0.091 0.290 BMS1355 18 154–160 4 0.697 0.818 0.607 BMS1616 X 65–65 1 - - -BMS1714 28 120–122 2 0.416 0.545 0.318 BMS1825 17 191–191 1 - - -BMS1857 29 155–165 4 0.675 0.545 0.575 BMS1926 24 132–136 3 0.394 0.091 0.344 BMS1928 1 141–161 4 0.576 0.636 0.511 BMS1948 29 93–93 1 - - -BMS1979 7 95–99 3 0.498 0.636 0.419 BMS2213 18 112–120 2 0.524 0.455 0.375 BMS2252 12 158–164 4 0.697 0.455 0.604 BMS2270 24 57–63 2 0.485 0.545 0.356 BMS2526 24 135–159 4 0.762 0.636 0.678 BMS2639 18 160–160 1 - - -BMS3024 24 142–142 1 - - -BMS332* 26 - - - - -BMS4015 1 144–152 4 0.688 0.636 0.606 BMS424B 11 256–258 2 0.091 0.091 0.083
BMC Genetics 2007, 8:77 http://www.biomedcentral.com/1471-2156/8/77 BMS522 7 134–134 1 - - -BMS574 1 131–131 1 - - -BMS631 X 146–146 1 - - -BMS650 19 141–141 1 - - -BMS672 22 143–143 1 - - -BMS711 1 102–102 1 - - -BMS745 19 109–109 1 - - -BMS779 4 191–195 2 0.312 0.364 0.253 BMS911* X - - - - -BR4206 18 110–110 1 - - -BR4406 18 114–114 1 - - -CSRM60 10 86–114 2 0.368 0.273 0.290 CSSM023* 24 - - - - -CSSM66 14 182–202 3 0.593 0.727 0.504 ETH10 5 207–213 3 0.450 0.455 0.385 ETH11 16 204–212 4 0.688 0.636 0.593 ETH121 2 182–210 3 0.498 0.455 0.419 ETH123* X - - - - -ETH152 5 198–198 1 - - -ETH185 17 219–219 1 - - -ETH225 9 145–159 3 0.636 0.636 0.524 ETH3 19 127–131 3 0.654 0.545 0.553 HAUT14* 18 - - - - -HAUT24 22 120–120 1 - - -HAUT27 26 145–145 1 - - -HEL1 15 108–120 3 0.628 0.636 0.519 HEL11* 26 - - - - -HEL13 11 193–203 3 0.325 0.364 0.282 HEL5* 21 - - - - -HEL9 8 146–152 4 0.610 0.545 0.533 IDVGA59 26 250–254 3 0.437 0.364 0.360 IDVGA90 7 194–194 1 - - -ILSTS005* 10 - - - - -ILSTS006 7 275–281 2 0.173 0.152 ILSTS015 29 265–265 1 - - -ILSTS017 X 117–117 1 - - -ILSTS021 18 116–116 1 - - -ILSTS102 25 146–146 1 - - -INRA005 12 135–141 4 0.697 0.818 0.600 INRA023 3 207–217 4 0.710 0.636 0.623 INRA032 11 169–181 5 0.753 0.727 0.674 INRA035 16 108–108 1 - - -INRA037 10 126–132 4 0.727 0.636 0.637 INRA063 18 173–187 5 0.758 0.636 0.675 INRA081 26 145–153 3 0.567 0.545 0.463 INRA117 1 91–97 2 0.173 0.182 0.152 INRA121 18 114–136 4 0.710 0.545 0.615 INRA124 Y 132–132 1 - - -INRA126 Y 182–182 1 - - -INRA133 6 221–231 3 0.437 0.364 0.360 INRA183 27 117–117 1 - - -INRA189* Y - - - - -MB054 18 123–123 1 - - -MB085 15 198–202 3 0.593 0.455 0.505 MHCII 23 213–225 4 0.723 0.636 0.633 MM12E6 9 108–108 1 - - -RM026 26 81–81 1 - - -RM372 8 128–134 3 0.450 0.364 0.385 SPS115 15 253–253 1 - - -TEXAN10 18 145–151 4 0.706 0.818 0.613 TGLA122 21 166–168 2 0.455 0.455 0.340 TGLA126 20 121–125 3 0.498 0.091 0.419 TGLA179 27 89–103 3 0.697 0.636 0.591
TGLA227 18 72–84 3 0.584 0.455 0.490 TGLA23 13 100–104 3 0.567 0.818 0.436 TGLA49 1 115–117 2 0.247 0.273 0.208 TGLA53 16 151–175 5 0.701 0.727 0.606 TGLA73 9 116–126 4 0.749 0.727 0.663 UWCA25 13 102–102 1 - - -XBM11 X 182–182 1 - - -XBM7 X 174–174 1 - - -* = markers not amplified
HE = expected heterozygosity
Ho = observed heterozygosity
PIC = polymorphism Information Content
The 28 microsatellites with PIC value > 0.5 are bold-faced. Information concerning the bovine microsatellite markers used can be acquired from internet sites [32-34].
Table 1: Characterisation of 130 bovine microsatellites tested on a panel of 11 wild gaurs (Continued)
species (Table 2), as one can also expect by phylogenetic analyses. Additionally, percentage variations of conserved and polymorphic loci also depend on experimental con-ditions; specifically the number and the identity of the specific set of markers, as well as the number of animals tested play essential roles. This explains the variable levels of marker conservation in water buffalo, goat and sheep obtained from different studies (see Table 2 for refer-ences). The average conservation of cattle microsatellite loci across Caprinae species was generally lower than for Bovinae; in fact goat [23] and sheep [13] showed the low-est among all Bovidae. However, these results do not com-pletely account for the experimental differences discussed above, which might influence the finding. With the same set of cattle microsatellites used in this study, our data sug-gest that Bos indicus is more closely related to Bos taurus than either Bos gaurus, Poephagus grunniens or Pseudoryx nghetinhensis (Table 2 and references therein). Within the
Bovini, a close relationship between wild gaur and ban-teng (Bos javanicus) could be expected, as 90% and 94% of cattle microsatellites were conserved in their genomes, respectively (Table 2). These results were in line with recent taxonomy classifications of Bovidae based on molecular phylogenetic analyses [24,25] and AFLP data [26]. Additionally, genomic conservation of cattle micro-satellites has been tested on Cervidae, whereas 73.7% and 74.1% of bovine markers could be successfully amplified in sika deer (Cervus nippon) and red deer (Cervus elaphus), respectively [14]. Within species of Bos, wild gaur showed the lowest proportion of polymorphic markers (Table 2). This finding was in agreement and is possibly related to the small effective population size of Vietnamese wild gaurs, compared to other bovid species. The average allele sizes of most successful amplified markers in wild gaur were smaller compared to those obtained in cattle. This
Table 2: Genomic conservation of cattle microsatellite loci within the Bovidae and Cervidae families using cross species amplification
Taxon Species – common name Conserved loci Polymorphic loci References
Bovidae, Bovinae
Bovini, Bovina Bos gaurus – Wild gaur 90% 58.1% this study
Bos indicus – Zebu 97.6% 87.3% Nguyen – person. comm.
Bos javanicus – Banteng 94% 75% Hishida et al. [40]
Poephagus grunniens – Yak 94.6% 94.3% Nguyen et al. [18] Bovini, Bubalina Bubalus bubalis – Water buffalo 70% 82% Moore et al. [19]
75% 56% Navani et al. [16] 85% 57% Hishida et al. [40]
Syncerus caffer – African buffalo 83% 90% van Hooft et al. [15] Bovini, Pseudoryina Pseudoryx nghetinhensis – Saola 96.8% 59.3% Nguyen et al. [20]
Bovidae, Caprinae
Caprini Capra hircus – Goat 57% 33% Kemp et al. [23] 79.4% 81.5% Kim et al. [17]
Ovis aries – Sheep 58% 67% de Gortari et al. [13] 73.4% 42.5% Slate et al. [14] Naemorhedini Naemorhedus caudatus – Korean goral 85.3% 55.2% Kim et al. [17]
Cervidae, Cervinae
Cervus Cervus elaphus – Red deer 74.1% 55.8% Slate et al. [14]
BMC Genetics 2007, 8:77 http://www.biomedcentral.com/1471-2156/8/77
was expected [27] and in agreement with previous studies using cross-species amplification [15,17].
The conservation of DNA sequences flanking microsatel-lites in the sex chromosomes among cattle and wild gaur was evaluated by testing the amplification of nine micro-satellite loci, which mapped to BTAX (BM6017, BMC6021, BMS1616, BMS631, BMS911, ETH123, ILSTS017, XBM11 and XBM7) and four additional loci (INRA124, INRA126, INRA189 and BM861), which mapped to BTAY. All these sex-specific microsatellite markers were monomorphic. The loci BM6017, BMS911, ETH123 and INRA189 failed to amplify sex-chromosome specific DNA in wild gaur. Recently, it has also been reported that locus BM6017 could not be amplified in yaks [18]. This could be attributed to the absence of homologous sequences in both species. Moreover, studies demonstrated that BM861 and INRA126 successfully amplified from both sexes in yak [18,21] and saola (Pseu-doryx nghetinhensis – [20]), suggesting that they are not Y-specific. These findings indicated that yak and saola X chromosome retained a homologous segment of the Y chromosome, which contains both BM861 and INRA126 microsatellite markers. Contrary to these studies, we could amplify INRA124, INRA126 and BM861 only in male wild gaurs, indicating that they are Y specific markers in this species. Hanotte et al. [28] also tried to amplify locus INRA124 in two males of mithan but failed to obtain an amplification product. Even though we could not find any polymorphism for INRA124, INRA126 and BM861, these three microsatellites were polymorphic in several bovid species, including domestic cattle, bison, mithan, swamp buffalo and yak [21,28]. This may be due to the relative small number (7) of male wild gaurs ana-lyzed, which may have limited the informative content of this marker. In addition, the significant difference in allele size of locus BM861 between wild (135 bp) and domestic gaur (mithan, 150–156 bp -[21]) might be explained by the introgressive hybridisation of mithan, leading to the loss of the 135 bp allele from its wild ancestor.
Finally, genotype data collected from the 117 successfully amplified microsatellites were used for genetic studies of the Vietnamese wild gaur population. The expected heter-ozygosity value per locus across the population varied between 0.091 (BL1029, BMS1128 and BMS424B) and 0.835 (BMS1120) (Table 1). Accordingly, markers BL1029, BMS1128 and BMS424B showed the lowest PIC value (0.083), whereas BMS1120 had the highest (0.767) with a mean of 0.252. In addition, the observed heterozy-gosities (Ho) ranged from 0.091 to 0.909. Twenty-eight microsatellites (BL1071, BM6425, BMC1410, BMS1120, BMS1355, BMS1857, BMS1928, BMS2252, BMS2526, BMS4015, CSSM66, ETH11, ETH225, ETH3, HEL1, HEL9, INRA005, INRA023, INRA032, INRA037, INRA063,
INRA121, MB085, MHCII, TEXAN10, TGLA179, TGLA53 and TGLA73; bold-faced in Table 1) showed good level of informativeness, having a PIC value higher than the threshold of 0.5 that is considered the value from which markers begin to be informative and therefore they would be the most suitable for diversity studies. Among these 28 most informative microsatellites, ten (CSSM66, ETH225, ETH3, HEL1, HEL9, INRA023, INRA032, INRA037, INRA063 and TGLA53) are also in the FAO standard panel of 30 microsatellites for diversity studies, allowing the study of introgression.
The average observed heterozygosity value (Ho = 0.269) was lower than the average expected heterozygosity (Nei's unbiased mean heterozygosity; HE = 0.298) and this
dif-ference was statistically significant. Eleven (BM4602, BMS1322, BMS1353, BMS1926, ILSTS006, INRA037, INRA063, MHCII, TEXAN10, TGLA126 and TGLA73) out of 117 loci (9.4%) showed significant deviation from the Hardy-Weinberg equilibrium at p < 0.05. Over all loci, departure from Hardy Weinberg equilibrium was statisti-cally highly significant (p < 0.001), reflecting the devia-tion in the direcdevia-tion of heterozygote deficit. These results indicate a frequent portion of homozygous individuals in the Vietnamese wild gaur population, resulting in an inbreeding coefficient value [F = (HE - Ho)/HE] of 0.10. Deviations from Hardy-Weinberg equilibrium of the pop-ulation studied might be the results of inbreeding, but could also have been caused by the presence of non-amplifying (null) alleles, which could have contributed to the heterozygote deficiencies. In addition, the low average heterozygosity of wild gaurs may also be the consequence of the use of cattle derived microsatellite markers, which are expected to perform less in related species, having a higher fraction of null alleles and being less polymorphic.
Conclusion
The degree of polymorphism in the high number of mic-rosatellite markers tested provides important information about the current genetic status of Vietnamese wild gaur. Its small population size would be dramatically adversely affected by high inbreeding and genetic drift. Therefore, the use of cattle microsatellites is adequate and recom-mended for further population genetic analyses, aimed to develop effective long-term conservation plans and strate-gies for this threatened species in Asia, especially in Viet-nam. The reported low level of genetic diversity in wild gaur possibly reflects a bottleneck effect following the dra-matic population reduction that occurred in this country during 1991–1995.
Methods
Sample collection
Eleven wild gaur samples (7 males and 4 females) were randomly collected in South Vietnam from the Chu Mom
Ray Nature Reserve, Kon Tum province and Thao Cam Vien (Zoo and Botanical Garden), Ho Chi Minh City. Genomic DNA was extracted from tissue samples, fibrob-last cells and bone fragments following standard methods [29,30] with minor modifications. DNA from three Brown Swiss cattles (Bos taurus) was obtained from EDTA-anticoagulated whole blood [31] and used as positive control.
Microsatellite analysis
The same set of 130 bovine microsatellite markers ana-lyzed by Nguyen et al. [18], excluded BPLP, and distrib-uted across the entire cattle genome (Table 1) was tested for PCR amplification on wild gaur genomic DNA. The primer pairs, which show extensive polymorphism in cat-tle, were selected from internet sites [32-34]. The forward primer of each microsatellite was 5'-labeled with either FAM, JOE, TAMRA, HEX or TET fluorescent tag. PCR amplification was carried out, as described by Nguyen et al. [18], in a total reaction volume of 25 µl containing 20– 30 ng DNA template, 1× PCR buffer (10 mM Tris-HCl, pH 8.3, 50 mM KCl, 1.5 mM MgCl2), 1.25 mM of dNTP mix, 20 µM of each primer and 1.25 units of Taq polymerase (SIGMA, Buchs, Switzerland). Samples were cycled in a PCR Express Machine (Thermocycler PCR Express, Hybaid) at 95°C for 5 min, followed by 35 cycles of 95°C for 30 s, 52–60°C annealing temperature (depending on the microsatellite used) for 30 s and 72°C for 30 s. The final elongation was at 72°C for 7 min. Gel electrophore-sis was performed with a 377 ABI sequencer (Applied Bio-systems, Rotkreuz, Switzerland) with Genescan-350 TAMRA or ROX as internal standards. Fragment sizing and analysis were done using ABI 672 Genescan software and Genotyper (version 2.1) software (Applied Biosystems). Statistical analysis
Genotypes were assigned for each individual based on allele size data. Allele frequencies, expected heterozygos-ity (HE = 1 - ∑ Pi2, where Pi = frequency of allele i),
observed heterozygosity (Ho) for all loci were computed using the Microsatellite Toolkit version 3.1 [35]. Genetic diversity was estimated according to Nei [36], using the average heterozygosity across all loci. Probability tests of Hardy-Weinberg equilibrium [37] based on Markov chain approaches (5000 iterations) were performed using the GENEPOP package version 3.4 [38]. The polymorphism information content (PIC) was calculated using the fol-lowing formula:
where Pi and Pj are frequencies of ith and jth alleles [39].
Authors' contributions
TTN and SG prepared the DNA samples, performed the microsatellite analysis and drafted the manuscript. LCB carried out the statistical analysis and drafted the manu-script. PV, GS and JPR coordinated the analyses and helped in drafting the manuscript. JCM and BXN con-ceived and supervised the entire study. All authors read and approved the final manuscript.
Acknowledgements
We are grateful to Dr Do Tuoc, Forest Inventory and Planning Institute, Ministry of Forestry, Hanoi, Vietnam for the bone samples. We also thank Dr Uoc NT for sample collection and preparation. The gaur fibroblast cells were provided by the Laboratory of Embryotechnology, Vietnamese Acad-emy of Science and Technology, Hanoi, Vietnam. This work was supported by BIODIVA-VAST project and the Swiss Federal Institute of Technology (ETH), Zurich.
References
1. IUCN Red List of Threatened Species [http://www.iucn
redlist.org/]
2. Byers O, Hedges S, Seal US: Asian Wild Cattle Conservation
Assessment and Management Plan workshop. Working Doc-ument. Apple Valley, MN, USA: IUCN/SSC Conservation Breeding
Specialist Group; 1995.
3. ICZN: Opinion 2027 (Case 3010). Usage of 17 specific names
based on wild species, which are pre-dated by or contempo-rary with those based on domestic animals (Lepidoptera, Osteichthyes, Mammalia): conserved. Bull Zool Nomencl 2003, 60:81-84.
4. Prater PH: The Book of India Animals. Bombay, India: Bombay National History Society; 1980.
5. Ellerman JR, Morrison-Scott TCS: Checklist of Palaearctic and
Indian Mammals 1758 to 1946. London: British Museum; 1951.
6. Corbet GB, Hill JE: The Mammals of the Indomalayan Region:
a Systematic Review. Oxford: Oxford University Press; 1992.
7. Felius M: Cattle Breeds – An Encyclopedia. Doetinchem: Misset; 1995.
8. Simoons FJ: Gayal or mithan. In Evolution of Domesticated Animals Edited by: Mason IL. London: Longman; 1984:34-39.
9. Payne WJA: Domestication: a forward step in civilization. In Cattle Genetic Resources Edited by: Hickman CG. Amsterdam: Elsevier; 1991:51-72.
10. Gallagher DS Jr, Womack JE: Chromosome conservation in the
Bovidae. J Hered 1992, 83:287-298.
11. National Research Council: Little known Asian animals with a
Promising Economic Future. Washington, D.C: National
Acad-emy Press; 1983.
12. Choudhury A: Distribution and conservation of the Gaur Bos
gaurus in the Indian Subcontinent. Mam Rev 2002, 32:199-226.
13. de Gortari MJ, Freking BA, Kappes SM, Leymaster KA, Crawford AM, Stone RT, Beattie CW: Extensive genomic conservation of
cat-tle microsatellite heterozygosity in sheep. Anim Genet 1997, 28:274-290.
14. Slate J, Coltman DW, Goodman SJ, MacLean I, Pemberton JM, Wil-liams JL: Bovine microsatellite loci are highly conserved in red
deer (Cervus elaphus), sika deer (Cervus nippon) and Soay sheep (Ovis aries). Anim Genet 1998, 29:307-315.
15. van Hooft WF, Hanotte O, Wenink PW, Groen AF, Sugimoto Y, Prins HH, Teale A: Applicability of bovine microsatellite markers
for population genetic studies on African buffalo (Syncerus caffer). Anim Genet 1999, 30:214-220.
16. Navani N, Jain PK, Gupta S, Sisodia BS, Kumar S: A set of cattle
microsatellite DNA markers for genome analysis of riverine buffalo (Bubalus bubalis). Anim Genet 2002, 33:149-154.
17. Kim KS, Min MS, An JH, Lee H: Cross-species amplification of
Bovidae microsatellites and low diversity of the endangered Korean goral. J Hered 2004, 95:521-525.
18. Nguyen TT, Genini S, Menetrey F, Malek M, Vogeli P, Goe MR, Stran-zinger G: Application of bovine microsatellite markers for
PIC Pi P P i i j j i i = − − = = = +
∑
∑
∑
1 2 1 2 2 1 1Publish with BioMed Central and every scientist can read your work free of charge
"BioMed Central will be the most significant development for disseminating the results of biomedical researc h in our lifetime."
Sir Paul Nurse, Cancer Research UK
Your research papers will be:
available free of charge to the entire biomedical community peer reviewed and published immediately upon acceptance cited in PubMed and archived on PubMed Central yours — you keep the copyright
Submit your manuscript here:
http://www.biomedcentral.com/info/publishing_adv.asp
BioMedcentral
BMC Genetics 2007, 8:77 http://www.biomedcentral.com/1471-2156/8/77
genetic diversity analysis of Swiss yak (Poephagus grun-niens). Anim Genet 2005, 36:484-489.
19. Moore SS, Evans D, Byrne K, Barker JS, Tan SG, Vankan D, Hetzel DJ:
A set of polymorphic DNA microsatellites useful in swamp and river buffalo (Bubalus bubalis). Anim Genet 1995, 26:355-359.
20. Nguyen TT, Menetrey F, Genini S, Nguyen VL, Vogeli P, Nguyen BX, Stranzinger G: Application of bovine microsatellite markers
on Saola (Pseudoryx nghetinhensis). J Anim Breed Genet 2005, 122:195-198.
21. Edwards CJ, Gaillard C, Bradley DG, MacHugh DE: Y-specific
mic-rosatellite polymorphisms in a range of bovid species. Anim
Genet 2000, 31:127-130.
22. Ritz LR, Glowatzki-Mullis ML, MacHugh DE, Gaillard C:
Phyloge-netic analysis of the tribe Bovini using microsatellites. Anim
Genet 2000, 31:178-185.
23. Kemp SJ, Hishida O, Wambugu J, Rink A, Longeri ML, Ma RZ, Da Y, Lewin HA, Barendse W, Teale AJ: A panel of polymorphic
bovine, ovine and caprine microsatellite markers. Anim Genet
1995, 26:299-306.
24. Hassanin A, Ropiquet A: Molecular phylogeny of the tribe
Bovini (Bovidae, Bovinae) and the taxonomic status of the Kouprey, Bos sauveli Urbain 1937. Mol Phylogenet Evol 2004, 33:896-907.
25. Verkaar EL, Nijman IJ, Beeke M, Hanekamp E, Lenstra JA: Maternal
and paternal lineages in cross-breeding bovine species. Has wisent a hybrid origin? Mol Biol Evol 2004, 21:1165-1170.
26. Buntjer JB, Otsen M, Nijman IJ, Kuiper MT, Lenstra JA: Phylogeny of
bovine species based on AFLP fingerprinting. Heredity 2002, 88:46-51.
27. Ellegren H, Moore S, Robinson N, Byrne K, Ward W, Sheldon BC:
Microsatellite evolution – a reciprocal study of repeat lengths at homologous loci in cattle and sheep. Mol Biol Evol
1997, 14:854-860.
28. Hanotte O, Okomo M, Verjee Y, Rege E, Teale A: A polymorphic
Y chromosome microsatellite locus in cattle. Anim Genet 1997, 28:318-319.
29. Laird PW, Zijderveld A, Linders K, Rudnicki MA, Jaenisch R, Berns A:
Simplified mammalian DNA isolation procedure. Nucleic Acids
Res 1991, 19:4293.
30. Hassanin A, Pasquet E, Vigne JD: Molecular systematics of the
subfamily Caprinae (Artiodactyla, Bovidae) as determined from cytochrome b sequences. J Mamm Evol 1998, 5:217-236.
31. Higuchi R: Rapid, efficient DNA extraction for PCR from cells
or blood. Amplifications 1989, 2:1-3.
32. The Cattle Diversity Database [http://www.projects.ros
lin.ac.uk/cdiv/accessdb.html]
33. The Cattle Genome Mapping Project database [http://
www.marc.usda.gov/genome/genome.html]
34. The BOVMAP database [http://locus.jouy.inra.fr/cgi-bin/bovmap/
intro2.pl]
35. The Microsatellite Toolkit [http://animalgenomics.ucd.ie/sde
park/ms-toolkit/]
36. Nei M: Estimation of Average Heterozygosity and Genetic
Distance from a Small Number of Individuals. Genetics 1978, 89:583-590.
37. Guo SW, Thompson EA: Performing the exact test of
Hardy-Weinberg proportion for multiple alleles. Biometrics 1992, 48:361-372.
38. Raymond M, Rousset F: GENEPOP: population genetics
soft-ware for exact tests and ecumenicism. J Hered 1995, 86:248-249.
39. Botstein D, White RL, Skolnick M, Davis RW: Construction of a
genetic linkage map in man using restriction fragment length polymorphisms. Am J Hum Genet 1980, 32:314-331.
40. Hishida O, Hanotte O, Verjee Y, Tanaka K, Namikawa T, Teale A, Rege JEO: Crossspecies amplification and polymorphism of
microsatellite loci in Asian bovidae. In Proceedings of the 8th
AAAP Animal Science Congress: 13–18 October 1996; Tokyo, Japan Japa-nese Society of Zootechnical Science; 1996:354-355.