HAL Id: hal-00726370
https://hal.archives-ouvertes.fr/hal-00726370
Submitted on 25 Jan 2021
HAL is a multi-disciplinary open access
archive for the deposit and dissemination of
sci-entific research documents, whether they are
pub-lished or not. The documents may come from
teaching and research institutions in France or
abroad, or from public or private research centers.
L’archive ouverte pluridisciplinaire HAL, est
destinée au dépôt et à la diffusion de documents
scientifiques de niveau recherche, publiés ou non,
émanant des établissements d’enseignement et de
recherche français ou étrangers, des laboratoires
publics ou privés.
Volcanic layers in Antarctic (Vostok) ice cores: Source
identification and atmospheric implications
Isabelle Basile-Doelsch, Jr Petit, S Touron, Fe Grousset, N Barkov
To cite this version:
Isabelle Basile-Doelsch, Jr Petit, S Touron, Fe Grousset, N Barkov. Volcanic layers in
Antarc-tic (Vostok) ice cores: Source identification and atmospheric implications. Journal of
Geophys-ical Research:
Atmospheres, American Geophysical Union, 2001, 106 (D23), pp.31915-31931.
�10.1029/2000JD000102�. �hal-00726370�
JOURNAL OF GEOPHYSICAL RESEARCH, VOL. 106, NO. D23, PAGES 31,915-31,931, DECEMBER 16, 2001
Volcanic layers in Antarctic (Vostok) ice cores: Source
identification and atmospheric implications
Isabelle
Basile,
1'2
Jean
Robert
Petit,
2 Stephanie
Touron
3, Francis
E. Grousset,
4
and Nartsiss Barkov s
Abstract. Fifteen visible volcanic ash layers (tephra) from Vostok ice cores have been
analyzed for major elements, trace elements, and Sr and Nd isotope composition.
Comparison of their geochemical signatures to lava composition from the inventory of
Antarctic and subantarctic volcanoes, which have been active over the last 0.5 million years, indicates that nine layers originate from activity of the South Sandwich volcanic
arc, three from southern South America, one from the Antarctic Peninsula (Bransfield
Strait), and one from West Antarctica (Marie Byrd Land province). The large size of the
tephra (up to 50 gm) requires rapid atmospheric transfer from the volcanic centers to
East Antarctica. Rapid tropospheric transport from the southwestern Atlantic,
penetrating East Antarctica, therefore predominates during the period studied, whether
in glacial or interglacial climatic mode. In spite of the low frequency of occurrence of
visible tephra layers in Vostok core (one event every 20 kyr), the overall atmospheric
pathway of these ash events appears consistent with the almost continuous advection of
continental dust from South America.
1. Introduction
The reconstruction of past atmospheric circulation patterns as well as the investigation of long-term links between volcanic aerosols and climatic change are today subjects of major interest and considerable debate. Representing potential archives of both climate and volcanic events, ice cores can be an important source of data for such studies. Although ash layers in ice cores do not always provide information on the climatic impact of volcanism, they do provide a record of atmospheric loading and thc pathways taken by volcanic clouds.
Past volcanic activity is recorded as visible volcanic ash (tephra) layers and/or sulfate-rich layers. Sulfuric acid can be detectcd by an electrical method [Hammer, 1977] or by direct chemistry [Zielinski et al., 1994, 1996, 1997]. The sulfuric acid record is an indicator of a large- scale atmospheric loading, and particular events, which are documented either by the observations or geological studies, are of interest because they could help in establishing the ice core chronology. Conversely, the dating of ice cores by independent methods (e.g., by varve or layer counting as for the Greenland ice records) can improve the documentation of the historical observations [Zielinski et al., 1994].
•Ce•tre Europden de Recherche et d'Enseignement en
G•osciences de l'Environnement, Europ61e M•diterranden de
l'Arbois, Aix-en-Provence, France.
:Laboratoire de Glaciologie et Gdophysique de
l'Environnement, St. Martin d'H•res, France.
•Laboratoire de Gdologie des Chaines Alpines, Institut
Dolomieu, Grenoble, France.
4Ddpartement de Gdologie et Ocdanographie, Univ. of
Bordeaux I, Talence, France.
>Arctic and Antarctic Research Institute, St. Petersburg,
Russia.
Copyright 2001 by the American Geophysical Union.
Paper number 2000JD000102. 0148-0227/01/2000JD000102509.00
However, the dating of ice cores is not always a
straightforward task. This is particularly true for sites
with low snow accumulation such as those in East Antarctica where the absence of seasonal variations of
proxies prevents the detection of annual layers.
Moreover. deep ice cores cover time periods of up to half
a naillion years, and the tephrochronology beyond the last
2000 years is still poorly documented. Unlike sulfuric
acid events, the tephra layers can potentially provide information on source location through the "fingerprints"
left by their elemental and trace composition. This makes
tla½ study of tcphra layers of particular interest for the
documentation of eruptive volcanic events in the middle
to late Pleistocene period. The amount of available material in ice is always very small, seldom exceeding a few milligrams. This restricts analytic methods and prevents the application of dating inethods (e.g.,
3•;Ar/4øAr).
However,
an inventory
of the tephra
in ice can
provide event markers that are extremely useful when
investigating the stratigraphic correlation between different ice cores [Fz.tji et al., 1999] or between ice cores and marine sediment records [Zielinski et al., 1997]. In addition, it should be possible to link the tephra with the
volcanic source if the amount of lava materials is
sufficient for absolute dating methods.
For the south polar regions, Smellie [1999] provides a
review of upper Cenozoic tephra records. Focusing on the
Antarctic ice records, volcanic ash layers from several cores have been already examined. In the Byrd ice core, in West Antarctica (Figure 1), Go•v and Williamson
[1971] identified ahnost 2000 visible ash layers, most of
them concentrated in ice corresponding to the last glacial period. The vicinity of the Marie Byrd Land volcanic
province and the possible triggering of eruptive activity
from bedrock isostatic adjustment consecutive to the ice sheet thickening have been suggested to explain the abundance of volcanic layers at this time [Kyle et al., 1981; Pa/aix, 1985]. Among volcanoes, Mount Takahe, located 450 km away t¾om the drilling site, has been
proposed as a possible source [Kyle and •lezek, 1978;
31,916 BASILE ET AL.: VOLCANIC LAYERS OF VOSTOK CORE
90'W
SOUTH AMERICA (Hawkesworth et al., 1979) (Futa and Stern, 1988) NSVZ = Northern South
Volcanic Zone
SSVZ = Southern South
Volcanic Zone AVZ = Antarctic Volcanic
Zone 60'W / I NAZGA PLATE BRANSFIELD STRAIT (Smellie, 1989) (Gonzal s-Ferrand, 1981) Br: Bridgeman; Pe: Penguin; Li: Livingston; De: Deception
120'W x x \ -,, JAMES ROSS PROVINCE (Smellie, 1989) Pa' Paulet SN' Seal Nunatak
SOUTH
SANDWICHS
ISLANDS
13 islands: (Pearce et al., 1995)(Baker et al., 1989) Protector Shoal, Zavodovski, Leskov,
Visikoi, Candlemas, Vindication,
Saunders, Montagu, Bristol, Freezland,•
Bellinghausen,
.Cook,
iiThule
i.?
150'E
OCEANIC PLATE (P. type MORB and OIB)
Verwoerd et al., 1989 Bo: Bouvet; PE: Prince Edward; Ma: Madon; Cr: Crozet; Ke: Kerguelen; McD: Mc Donald; He: Heard; StP: St Paul;
Am: Amsterdam;
An: Anfipode; Pe: Peter
.Am 60'E
} 90'E
//
/
/ 120'E LEGEND'•,•
Mid-ocean
ridge
Inferred boundary of the West Antarctic Rift SystemSubduction
Extension of iCe shelves WRhin plate volcano Subduction volcano
Ice core site
MARIE
BYRD
LAND !80'
(Le Masuder et al., 1989) ..
(Mcintosh and Wilch, 1997) NEW ZEALAND
(Rowley, 1989)
Hu: Hudson; To :Toney; (Ewart and Stipp, 1968)
Ta: Takahe; Wa: (Shane et al., 1996)
Waesche; Si: Siple;
Mo: Moulton; Be: Berlin TVZ ß Taupo Volcanic Zone
I
SP' South pole; DC' Dome C; V' Vostok; B' Byrd.
VICTORIA LAND Ky•e, 1989a, Rockoil, 1995
Erebus Province: (Kyle, 1989c)
Er: Mt Erebus;
RSR: Royal Society Range Melbourne Province: Kyle, 1989b
Me: Mt Melbourne; PI :The Pleiades HP: Hallet Province (Mcintosh and Kyle, 1989)
Ba: Balleny Islands (Wright and Kyle, 1989)
i
0 1000 2000 3000 4000 km I • ,i • ,I
BASILE ET AL.' VOLCANIC LAYERS OF VOSTOK CORE 31,917
Ky/e el al., 1981; Palais, 1985]. In the Dome C ice core (East Antarctica), only one tephra was found. It was at a depth of 726 m and has been identified as coming from Mount Takahe [Kyle et a/.,1981]. In shallow ice cores fi'om Vostok and South Pole, Kyle et al. [1984] and Pa/ais el a/. [1987] studied tephra layers by SEM-EDX and electron microprobe methods and compared their results with the major element composition of nearby sources. The authors suggested a common source (Candelmas Island in the South Sandwich Islands) for one event at 3200 years B.P. (before present), providing a visible tephra horizon for both sites. Therefore the tephra suggest an initial stratigraphic correlation between two Antarctic ice cores -1200 km apart and-5000 km from
the direct source.
In a deep Vostok ice core (called "3G") covering the last 160 kyr, Palais et al. [1989] detected numerous cloudy and faint tephra layers after careful inspection of the core. The amount of available material was low, making quantitative analysis extremely difficult. As in previous studies, the source was identified for five layers by the major element composition. However, from a theoretical point of view, this method has a number of limitations for source identification: (1) the major element composition of tephra can be heterogeneous within a given layer; (2), different volcanoes and/or different volcanic provinces may produce tephra with similar major element composition; (3) conversely, for a •1 ¾•11 ¾kJl•l, llU• tilL., L.,L/IIIIJL//DILIL/11 111Cl,.y L'11CI,11•; 11•Jlll UII• eruption to another or even within a given eruption if' there is a zoned magma chamber.
To mitigate these problems, a more complete geochemical identity card can be established using the analysis of trace elements and the strontium-neodymium isotopic signature. This provides complementary constraints to those fi'om the major element composition and the comparison with sources. A matching source composition will, however, also be dependent on the data available fi'om the literature and from the lava samples which have been analyzed and published for each potential source volcano (hereinafter PSV).
Vostok cores contain a total of-20 levels of visible
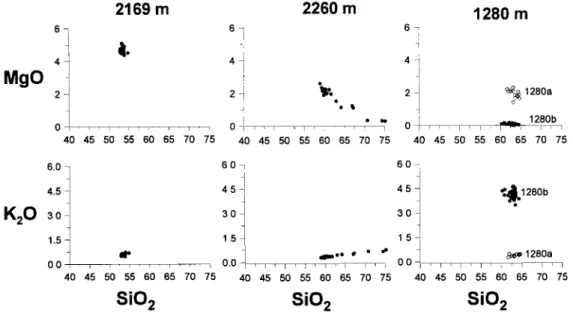
tephra with significant amounts of material. These layers are located ahnost randomly in ice from the interglacial period or glacial period (Figure 2). This strongly differs fi'om the Byrd core, however Vostok is located in central East Antarctica, relatively far from volcanic centers. The Vostok ice core provides a climatic record of the last 400,000 years [Petit et al., 1999], the longest climatic
sequence ever obtained. Climate is depicted by the isotope of the water and taken as a proxy of the
temperature (Figure 2). Ice chronology was obtained by
development of a glaciological model, and the age of the
ice layers is estimated to within -5% accuracy [Petit et a/., 1999].
In this paper we present results of the analysis of 15 levels to which we applied an extended geochemical tracer method (major elements, trace elements, and Sr and Nd isotopic compositions) for comparison with the composition of volcanic material of the source. First of all, the elemental composition and the geochemical signatures of glass shards are used to determine the layers
exhibiting a similar tectonic setting with respect to their
parental magma (subduction zone or within-plate volcanoes). Next, we establish an inventory of volcanoes surrounding Antarctica, located from 90øS up to 30øS latitude, which have been active at some time over the last 0.5 naillion years. All these volcanoes are considered
as PSVs. This represents numerous volcanoes (see Figure
1) set within subduction or within-plate (continental or
oceanic) provinces. We then compare the geochemical
signatures of the tephra with available geochemical data
for PSVs. We are aware that slight geochemical differences may result from the use of different analytical
techniques [e.g., Kyle et al, 1984] or from different
eruption characteristics, i.e., lava flow or pyroclastic.
Fortunately, they are not significant compared to the
geochemical differences that exist between the two
tectonic settings, which helps us rapidly analyze the PSVs
and predict the source of the tephra. We will then discuss
some of the implications in terms of atmospheric pathways of air masses for glacial and interglacial
periods.
2. Samples and Analytical Methods
Ash layers were recovered during successive
expeditions at Vostok Station from a shallow ice core
named "BHI," and from two deep ice cores named "4G2" and "5G" (Figure 2). The 15 tephra layers studied here (Table 1) were detected visually. The layers are from a few to 20 mm thick with a variable whitish, brownish,
or grayish color. The total amount of material is about 1
to 5 mg. The selected ice samples were first decontaminated by washing with deionized water in a dust-free clean room. The inner part of the core was then melted, and two aliquots of the water were filtered through two Nucleopore© filters (13 mm diameter and
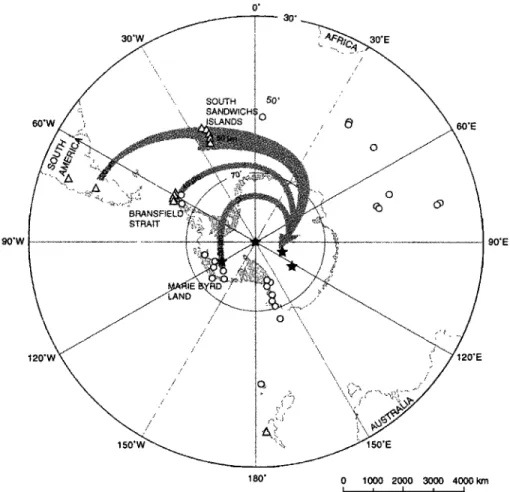
Figure 1. Location in the Southern Hemisphere of volcanic provinces mad PSVs in their tectonic settings
(activity dating back less than 500 kyr). The provinces and the main references on tectonic settings and
dating are McMurdo volcanic group [Kyle, 1989a, 1989b and 1989c; ?er•voed et al., 1989; Rocholl et al,
1995]; Marie Byrd Land province (MBL) [LeMasurier, 1989, Rowley et al., 1989]; James Ross Islands
volcmaic group and Bransfield strait volcanoes [Smellie, 1989; Tokarski, 1991; Gonzales-Ferran, 1991 ];
South Sm•dwich Islands (SSIs) [Baker et al., 1989; Pearce et al., 1995]; New Zealand [Ewart and Stipp, 1968; Sirekin and Siebert, 1994; Shane et al., 1996]; South America [Hawkesworth et al., 1979; Futa and
Stern, 1988]. Additional references are given in the discussion (see text). Adapted from LeMasurier and
Thomson [1989]. The locations of Antarctic drilling sites are also shown. V, Vostok; PS, Admunsen-
31,918 BASILE ET AL.' VOLCANIC LAYERS OF VOSTOK CORE
Deuterium
5D O/oo
Vostok
Cores
-480 -460 -440 -420 0- 100 200 3OO 4OO 5OO 6OO 7OO 8OO 9OO 1000 1 lOO 1200 1300 1400 1500 1600 1700 1800 1900 2000
2•oo
•
2200 •2300
2400
25002600
2700
ssI BS SA and SSI SAM•L
Age EGT4 yr SSI 'P-- 104-BH1 3,500 ? -- 181-5G 6,870 I I i•--- 547-4G2 35,170
I I b-- 1280-4G2 90,600 •-- 1431-4G2 101,840•
1981-4G2
1992-5G141,500
1996-5G 2169-4G2 160,700 i____ 2231-4G2 r-- 2260-5G1 170,770 • _1 2326-4G2 179,330t
....
2502-4G2
201,600
I h -- 2587-5G1 213,700 [ SSI SSI SSI SSI SSI SSVZFigure 2. Position of the visible ash layers in the Vostok core studied, recorded along with the isotopic
composition (deuterium) of the ice and the age of the layer [Petit et al., 1999]. The identified sources of
ash layers are SSIs (South Sandwich Island), BS (Bransfield Strait), SA (South America), SSVZ (southern part of southern volcanic zone), MBL (Marie Byrd Land).
0.4 pm porosity) fitted for microscope observations. For each layer, one filter was embedded with epoxy resin and polished using diamond pastes (grain size 6, 3, 1, and 0.25 pm) to obtain flat surfaces for quantitative microprobe analysis.
Tephra were observed with an optical microscope in transmission ]node (with natural and polarized light) and
in reflection mode. Additional observations were
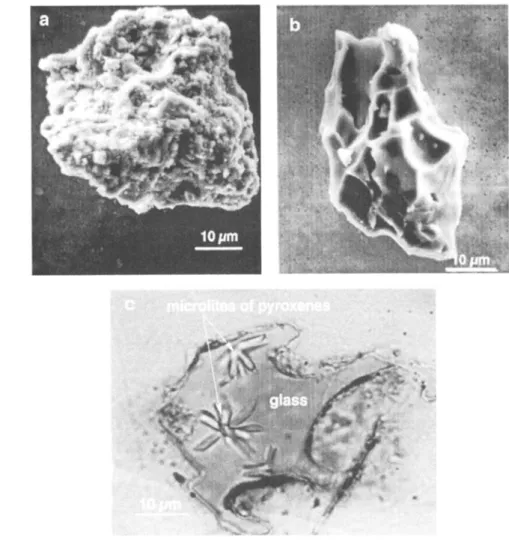
performed with a scanning electron microscope. The size of the tephra varies from a few micrometer up to 50 pm (see Table 1). Under the optical microscope, shards appear brown, orange, or colorless. All the observations indicated that the tephra layers are a mixture of three different types of particles: (1) glass shards (70 to 90%) resulting from the quenching of erupted magma (Figure 3b), (2) lithie fragments (5 to 30%) composed of cryptocrystalline glass (i.e., glass partly recrystallized) probably from prior eruptions (Figure 3a), and (3)
microlites of feldspar or ferroma•nesian minerals which may or may not have been included in the glassy phase (Figure 3c).
The quantitative major element composition of glass shards was obtained using a wavelength-dispersive X-ray (WDX) electron microprobe. This method is more accurate and precise and was preferred to scanning electron microprobe (SEM) energy dispersive X-ray spectrometry [Palais et al., 1987]. Analyses were
performed on particles greater than 5 pm because of the
limitation of the required minimum for analytical volume.
To prevent the loss of Na under the beam [Nielsen and
$igurdsson, 1981], we set the beam current and the
accelerating voltage to 6 nA and 15 kV respectively. The
number of analyzed particles varies from 7 to 33 for each
layer. Results are presented in Table 2.
Trace elements were analyzed using an inductively coupled plasma mass spectrometer (ICP-MS- VG
BASILE ET AL.' VOLCANIC LAYERS OF VOSTOK CORE 31,919
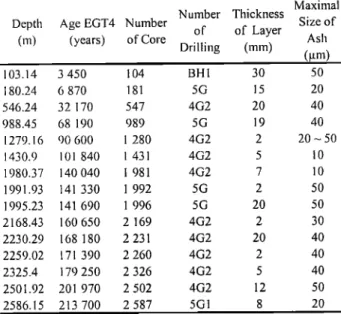
Table 1. Asia Layers Sampled From Different Vostok Ice
Cores: BH1,4G2 and 5G a
Number Thickness
Depth Age EGT4 Number of of Layer (m) (years) of Core Drilling (mm) Maximal Size of Ash 103.14 3 450 104 BH1 30 50 180.24 6 870 181 5G 15 20 546.24 32 170 547 4G2 20 40 988.45 68 190 989 5G 19 40 1279.16 90 600 1 280 4G2 2 20-50 1430.9 101 840 1 431 4G2 5 10 1980.37 140040 1 981 4G2 7 10 1991.93 141 330 1 992 5G 2 50 1995.23 141 690 1 996 5G 20 50 2168.43 160 650 2 169 4G2 2 30 2230.29 168 180 2 231 4G2 20 40 2259.02 171 390 2 260 4G2 2 40 2z;25•4 179 250 2 326 4G2 5 40 2501.92 201 970 2 502 4G2 12 50 2586.15 213700 2587 5G1 8 20
"Age "GT4" is fi'om Petit et al. [1999]. Ash layer label refers to the bottom depth of the 1 m long ice core increment containing the layer. Size of tephra was measured using an
optical microscope.
Plasmaquad PQ 2 Turbo©) with a standard quantitative method. The tephra samples were first dried (-5 mg of sample obtained) then dissolved with a mixture of Tefion©-distilled acids [HF + HC104+ HNO3] [Falkner et al., 1995]. For five samples, the amount of available
material was too small for accurate trace element
analysis. Results are presented in Table 2.
Sr and Nd isotopic compositions were measured using a multicollector thermo-ionisation mass spectrometer (TIMS) (Finnigan MAT 261 ©). After dissolution, Sr and
Nd were chemically separated using ionic
chromatographic columns. We followed chemical and mass spectrometer procedures as previously described by Grousset e! al. [1988]. Results are presented in Table 2.
For convenience,
measured
(14•Nd/•44Nd)Meas
ratios
were
normalized with respect to a standard of CHondritic Uniform Reservoir (CHUR) with a value of 0.512636 [.Jacobsen e! 14/asserburg, 1980] using the relationship
14• 144
l•Nd(O)=((
•4•Nd/•44Nd)Meas/(
'Nd/ Nd)cHU
R- 1)xl
04.
3. Tephra Composition and Groupings
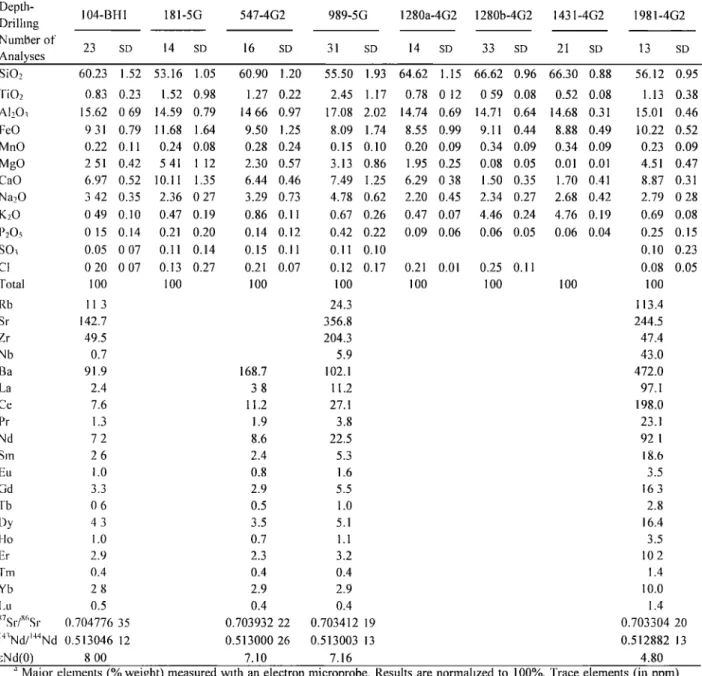
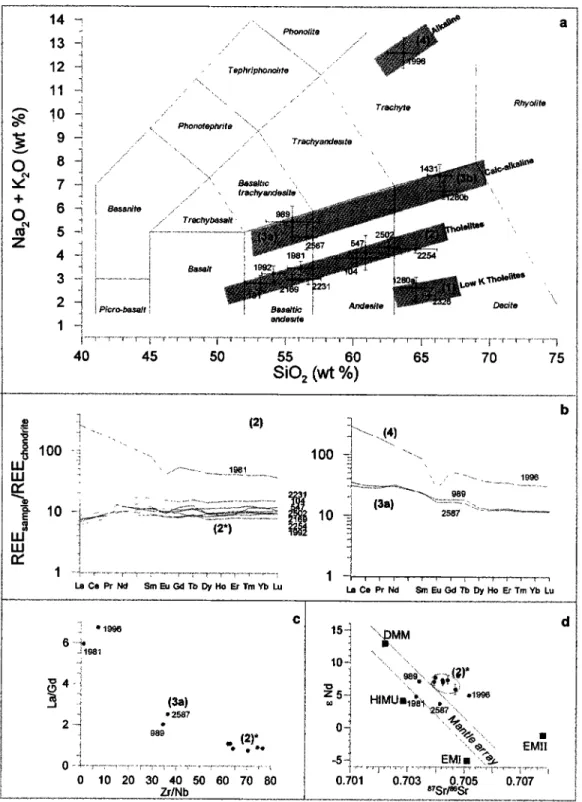
3.1. Variability of the Major Element Composition Microprobe analyses were performed only on glass shards because they represent the magma at the time of the eruption. To point out the variability in glass shard composition from a given layer, we represent, in Figure 4, the composition of several single shards from three different depths (1280, 2169 and 2260 m) on a plot of the concentration of K20 and of MgO versus SiO2. The other major elements are not represented because they show similar patterns and lead to the same conclusions. For the discussion, we use the classification of volcanic rocks based on alkaline elements versus SiO2 concentrations (Figure 5a) as suggested by Cox e! al. [1979] and adapted by Le Maitre et al. [1989].
The three samples illustrate different degrees of homogeneity inside a single tephra layer (Figure 4). The 2169 m layer is composed of basaltic andesite glass
shards and appears very homogeneous. By comparison
the 2260 m layer ranges from andesite to dacite: SiO2 and MgO varying from 60 to 75% and from 3 to 0.3%, respectively. This straight-line trend probably results fi'om fractional crystallization and the presence of a zoned lnagma chamber prior to the eruption [Zielinski et a/., 1995]. The third example is the 1280 m layer which shows two distinct coinpositions featuring dacite (K20 0.51%, noted 1280a) and rhyolite (K20 • 4.5%, noted
1280b), respectively. In addition, the size distribution of the shards is bimodal, showing one mode at 20-40 lam and another at 5-20 lam. This indicates that 1280 m tephra represents, in fact, two independent eruptive events, and the mixed volcanic cloud deposited tephra simultaneously at Vostok. This layer was divided into two subgroups:
1280a mad 1280b.
3.2. Major Element Compositions and Classification of Tephra Layers
The major element compositions are given in Table 2 and represent for each layer the average value from multiple analyses. In Figure 5a we plot the mean composinon of alkalis (Na20+K20) versus SiO2 to classify the different tephra layers accordingly. Four main groups could be identified according to the increase of the
total alkali content.
1. Set I contains two layers (1280a, and 2326 m) and is composed of dacite with a very low alkali content (K20 • 0.5%). They belong to a low-K tholelite series.
2. Set 2 contains nine layers (104, 181, 547, 1981, 1992, 2169, 2231,2260 and 2502 m) and is also tholeiitic n•agma but slightly more alkaline (Na20+K20 from 2 to 4'% ) than set 1.
3. Set 3 contains four layers (989, 2587, 1280b and 1431 m) and represents calc-alkaline magma. However, their SiO: content is significantly different (•55% and •70%), and we therefore divide them into two subgroups: set 3a with two layers (989 and 2587 m) and set 3b with two layers (1280b and 1431 m). The high TiO2 content (TiO2 • 2.5%) in the 989 m layer (Table 2) could be a signature of tholeiitic or alkaline within-plate volcanism [Albarade, 1992] (see below).
4. Set 4 contains one layer (1996 m) with a composition much different fi'om that of the other layers. It is a trachyte from an alkaline series (K20+Na20 •10%).
Tinis classification gives an initial indication of the tectonic setting of the volcanic sources' tholeiitic and calc-alkaline series typically come from subduction- related provinces, xvhereas the alkaline series probably come from within-plate tectonic sources.
3.3. Complementary Discrimination Using Trace Element Composition
The formation of a magma follows three main steps: (1) the partial fusion of mantle rocks, (2) the collection rand migration of the magma, and (3) the storage and fractional crystallization. Different additional processes may occur that modify the composition during magma genesis. Magma may be mixed and contaminated by
31,920 BASILE ET AL.: VOLCANIC LAYERS OF VOSTOK CORE
Figure 3. Microscope
observations:
(a) scanning
electron
microscope
picture
of !ithic material
composed
of cryptocrysta!!ine
glass;
(b) scanning
electron
microscope
picture
of glassy
shard
with a
blocky
morphology
typical
of phreatomagmatic
ash
grains
[Heiken
a,d Wohletz,
1985];
(c) picture
of the
polished
surface
of a glassy
shard
observed
with an optical
microscope
using
transmitted
light;
microlites
of p•'oxcnes
appear
in a spherolite
structure
in the glassy
matrix.
various crustal rocks with different compositions
of
continental or oceanic origin. Trace element behavior is
very sensitive to all these petrogenetic processes. This
makes it possible
for the origin of a magma
to be
characterized
according
to the tectonic
setting
(tholeiitic,
calcaikaline
or alkaline
series).
Moreover,
in a given
tectonic setting, each volcanic area inherits specific
characteristics
of trace
elements.
Among
trace
elements,
rare earth element
(REE) enrichment
with respect
to a
standard
(normalized
chondrite
composition),
negative
Europium anomaly, light REE (LRRE) enrichment or
depletion
given
by the ratio of La to Gd, to Sm or to Tb,
Nb to Zr ratio,
as well as Sr and
Nd isotopic
signatures
are the classical proxies used to characterize and discriminate between magmas and volcanic rocks [ Wilson, 1989]. We apply this approach to the
composition
of the Vostok
tephra.
The REE profiles,
the
La/Gd
versus
Zr/Nb ratio
and
the isotopic
composition
of
set 2, 3a and 4 are shown in Figure 5b, c, d. For set I and
set 3b and $e 181 rn layer of set 2, the amount of
available material was unfortunately too small for ICPMS or TIMS analysis.
Among the nine layers of set 2, seven layers (104, 547, 1992, 2169, 2231, 2260 and 2502 m) differ from the 1981 m layer with respect to the REE profile. Their profile is enriched by 6 to 17 times the chondritic
abundance (Figure 5b) and a slight LREE depletion
occurs (La/Gd = 0.8) (Figure 5c). They also have a high
Zr/Nb ratio (62-76) (Figure 5c) and a Nd isotopic
composition
(l•Nd(0)) from +6 to +8 as well as a 87Sr/86Sr
ratio from 0.70393 to 0.70478 (Figure 5d), indicating a
rather radiogenic signature. These data in addition to the
tholeiitic composition indicate a typical parental magma
from oceanic subduction zones. For convenience these
seven layers will be called set 2* or "depleted LREE"
layers hereinafter.
Set 3a includes the 989 and 2587 m layers. The REE
concentration is 12 to 35 times higher than the chondritic
abundance (Figure 5b) with a slight LREE enrichment
BASILE ET AL.: VOLCANIC LAYERS OF VOSTOK CORE 31,921
Table 2. Analytical Results of Major and Trace Elements
Depth-
104-BH1
Drilling Number of 23 SD Analyses 181-5G 547-4G2 989-5G 1280a-4G2 1280b-4G2 14 SD 16 SD 31 SD 14 $D 33 $D 1431-4G2 1981-4G2 21 SD 13 SD giO2 TiO2 A120• FeO MnO MgO CaO Na20 K20 P20• SOs CI Total Rb 11.3 Sr 142.7 Zr 49.5 Nb 0.7 Ba 91.9 La 2.4 Ce 7.6 Pr 1.3 Nd 7.2 Sm 2.6 Eu 1.0 Gd 3.3 Tb 0.6 I)y 4 3 Ho I 0 gr 2 9 Tm 0 4 Yb 2 8 I Ju 0 5 '•7Sr/'$•'Sr 0.704776 35 143Nd/144Nd 0.513046 12 aNd(O) 8.00 60.23 1.52 53.16 1.05 0.83 0.23 1.52 0.98 15.62 0.69 14.59 0.79 9.31 0.79 11.68 1.64 0.22 0.11 0.24 0.08 2.51 0.42 5.41 1.12 6.97 0.52 10.11 1.35 3.42 0.35 2.36 0.27 0.49 0.10 0.47 0.19 0.15 0.14 0.21 0.20 0.05 0.07 0.11 0.14 0.20 0.07 0.13 0.27 100 100 60.90 1.20 1.27 0.22 14.66 0.97 9.50 1.25 0.28 0.24 2.30 0.57 6.44 0.46 3.29 0.73 0.86 0.11 0.14 0.12 0.15 0.11 0.21 0.07 100 168.7 3.8 11.2 1.9 8.6 2.4 0.8 2.9 0.5 3.5 0.7 2.3 0.4 2.9 0.4 0.703932 22 0.513000 26 7.10 55.50 1.93 64.62 1.15 66.62 0.96 66.30 0.88 56.12 0.95 2.45 1.17 0.78 0.12 0.59 0.08 0.52 0.08 1.13 0.38 17.08 2.02 14.74 0.69 14.71 0.64 14.68 0.31 15.01 0.46 8.09 1.74 8.55 0.99 9.11 0.44 8.88 0.49 10.22 0.52 0.15 0.10 0.20 0.09 0.34 0.09 0.34 0.09 0.23 0.09 3.13 0.86 1.95 0.25 0.08 0.05 0.01 0.01 4.51 0.47 7.49 1.25 6.29 0.38 1.50 0.35 1.70 0.41 8.87 0.31 4.78 0.62 2.20 0.45 2.34 0.27 2.68 0.42 2.79 0.28 0.67 0.26 0.47 0.07 4.46 0.24 4.76 0.19 0.69 0.08 0.42 0.22 0.09 0.06 0.06 0.05 0.06 0.04 0.25 0.15 0.11 0.10 0.10 0.23 0.12 0.17 0.21 0.01 0.25 0.11 0.08 0.05 100 100 100 100 100 24.3 113.4 356.8 244.5 204.3 47.4 5.9 43.0 102.1 472.0 11.2 97.1 27.1 198.0 3.8 23.1 22.5 92.1 5.3 18.0 1.6 3.5 5.5 16.3 1.0 2.8 5.1 16.4 1.1 3.5 3.2 10.2 0.4 1.4 2.9 10.0 0.4 1.4 0.703412 19 0.703304 20 0.513003 13 0.512882 13 7.16 4.80'• Major elelnents (% weight) measured with an electron microprobe. Results are normalized to 100%. Trace elements 87 86 14 (in ppm)
is 2cy x 10-'. Measured Sr/ 'St and •Nd/
are measured by ICPMS. Isotopic compositions are measured by TIMS. Error 86 88 14{• 144
ratios have been con'ected tbr mass fractionation by normalizing to 'Sr/ Sr=0.1194 and 'Nd/ Nd=0.7219, respectively. Blanks
87 86
were negligible. Our measurements for the strontium standard (NIST SRM 987) yielded an average value tbr Sr/ 'Sr equal to 0.710205 {+/-0.00002) for 6 measurements, compared to the certified value of 0.710245. The neodymium standard (La Jolla) was
analyzed 5 times and gave an average value for 14•Nd/144Nd equal to 0.511846 (+/-0.000015) compared to the certified value of
0.5 ! 1865. The observed differences between our data and the certified values are within the range of the measurement uncertainty.
Zr/Nb ratio (•35, Figure 5c), but they differ by their Nd and Sr isotopic compositions, which however are both
included in the array of the mantle composition (Figure
5d). These characteristics suggest a parental magma from
a subduction setting, although the high TiO2 content (TiO: • 2.5%, Table 2) of the 989 m layer is unusual for a subduction magma. These compositions possibly suggest a more complex tectonic environment[Albarbde, 1992].
Although the 1981 m layer from set 2 and the 1996 m layer from set 4 belong to different major element trends, they both display a similar pattern for trace elements. The
REE profiles show an enrichment 30 to 300 times the chondritic abundance (Figure 5b) and a strong LREE enrichment (La/Gd = 5.3) (Figure 5c). They both display a negative Europium anomaly, a low (<7) Zr/Nb ratio,
m•d similar [;Nd(0) signatures (4.76 and 4.97). Their
87Sr/86Sr
compositions
are different,
and
the 1996
m layer
with a value of 0.70517 is more radiogenic than the 1981 m layer with 0.70330 (Figure 5d). We conclude for the parental magma that the two layers originate from a magma with a tectonic setting of continental within-plate volcanism, but for the 1981 m layer, there is a setting
31,922 BASILE ET AL.' VOLCANIC LAYERS OF VOSTOK CORE Table 2. (Continued)
Depth-
1992-5G
Drilling Number of 26 SD Analyses 1996-5G 2169-4G2 2231-4G2 2260-4G2 17 SD 20 SD 15 SD 20 SD 2326-4G2 4G22502- 10 SD 16 2587-5G1 SD 14 SD SiO2 TiO2 A1203 FeO MnO MgO CaO Na20 K20 P205 SO.• CI Total Rb Sr Zr Nb Ba La Ce Pr Nd Sm Eu Gd Tb Dy Ho Er Tm Yb Lu '•7Sr/86Sr 54.12 0.86 0.88 0.29 15.66 0.84 9.95 1.05 0.21 0.09 5.48 0.98 10.17 0.57 2.82 0.32 0.42 0.11 0.16 0.17 0.04 0.05 0.09 0.06 100 10.0 123.7 59.6 09 84 5 28 77 12 72 21 0.7 2.5 0.5 2.8 0.6 2.0 0.3 1.9 0.3 0.704680 33 143Nd/144Nd 0.512941 41 aNd(O) 5.95 63.68 1.15 55.52 0.47 56.67 0.95 0.41 0.16 1.23 0.07 1.29 0.11 14.40 1.04 15.14 0.21 15.01 0.30 6.85 1.03 10.57 0.46 12.01 0.48 0.45 0.45 0.20 0.07 0.24 0.11 0.03 0.04 4.86 0.19 3.49 0.22 1.08 0.32 9.22 0.14 7.97 0.40 7.55 0.56 2.38 0.21 2.40 0.23 5.08 0.34 0.61 0.07 0.62 0.06 0.15 0.13 0.15 0.04 0.15 0.07 0.04 0.07 0.25 0.13 0.07 0.02 0.11 0.02 100 100 100 191.2 16.2 15.2 75.9 103.9 206.1 560.6 94.9 91.4 79.2 1.2 1.5 107.5 97.4 150.4 107.6 3.1 4.8 218.6 8.9 13.6 25.4 1.4 2.1 100.1 10.3 12.2 19.8 2.8 3.8 2.3 0.8 1.3 15.9 3.6 4.4 2.7 0.7 0.9 14.6 3.5 5.4 3.0 0.8 1.2 8.5 2.4 3.7 1.1 0.3 0.5 7.8 2.4 3.8 1.1 0.4 0.6 0.705172 37 0.704416 14 0.703971 12 0.512893 12 0.513014 30 0.513034 13 5.01 7.37 7.76 66.26 5.76 65.59 0.46 62.59 0.71 56.53 0.81 0.74 0.27 0.91 0.07 0.74 0.30 1.43 0.47 14.16 0.87 14.30 0.22 15.40 0.90 16.39 1.14 8.25 2.30 8.67 0.32 8.07 0.83 8.90 1.67 0.26 0.12 0.23 0.06 0.19 0.06 0.19 0.08 1.75 0.74 1.65 0.13 1.90 0.36 3.49 0.40 5.78 1.53 5.93 0.15 6.29 0.45 7.66 0.44 1.90 0.39 1.88 0.15 3.93 0.32 3.82 0.49 0.51 0.15 0.47 0.04 0.48 0.08 0.98 0.22 0.09 0.05 0.14 0.04 0.14 0.15 0.39 0.25 0.06 0.07 0.13 0.11 0.26 0.07 0.20 0.03 0.21 0.08 0.09 0.07 100 100 100 100 19.1 11.2 26.1 138.2 140.7 374.2 89.5 68.7 136.0 1.1 1.1 3.7 97.5 98.8 270.0 3.0 2.6 12.7 8.5 7.7 29.4 1.3 1.2 4.1 9.7 8.5 21.2 2.8 2.5 5.4 0.9 0.9 1.4 3.6 3.1 5.1 0.8 0.6 0.9 3.6 3.6 4.7 0.8 0.8 1.0 2.6 2.5 3.1 0.4 0.4 0.4 2.6 2.5 3.0 0.4 0.4 0.4 0.704266 16 0.704247 10 0.704137 7 0.512985 38 0.512996 25 0.512827 12 6.81 7.02 3.73with a low alkali content comparable to tholeiitic
magmas.
At this step, we may already decipher two main
tectonic settings for the studied tephra: first the 1996 m
layer, which appears well apart, and probably the 1981 m
layer, both correspond to a setting of within-plate
magmatism; second, the "depleted LREE" layers (set 2'),
the 989 m layer, and the 2587 m layer originate from
different subduction zones.
4. Comparison With PSV Signatures
4.1. Inventory of PSVs
The location of the main volcanic centers with
documented activity over the last 500 kyr is shown in
Figure 1 (with references herein).
The volcanic provinces in a within-plate setting are James Ross Province, Marie Byrd Land, and Victoria Land on the Antarctic continental plate and the oceanic
islands scattered over the Antarctic oceanic crust. The
volcanic provinces in a subduction setting are the southern part of South America, the South Sandwich Islmqds (SSIs), the Bransfield Strait, and the New Zealand
volcanoes.
The geochemical signatures of PSVs are taken from the literature. Unfortunately, some PSVs are poorly documented and cannot be compared directly with our data. We will therefore restrict comparisons by using only
the available chemical data which seem to be the most
pertinent.
First of all, we can already rule out some PSVs from
BASILE ET AL.: VOLCANIC LAYERS OF VOSTOK CORE 31,923
the differentiation degree of the magmas. The least differentiated tephra at Vostok are basaltic andesites (Figure 5a) with a SiO2 content higher than 52%. Thus the PSVs, which emitted only basalt (i.e., no differentiated products), are unlike the source for any of the Vostok layers. So we can already discard the following centers: Penguin, Greenwich, and Livingston Islands in the Bransfield Strait [Smellie, 1989; Gonzales- Ferrari, 1991]; Seal Nunatak and Paulet Islands in the James Ross Province [Smellie, 1989]; and Antipodes Islands on the New Zealand continental shelf [Gamble and 7hornson, 1989]. We now focus discussion on within-plate and subduction settings.
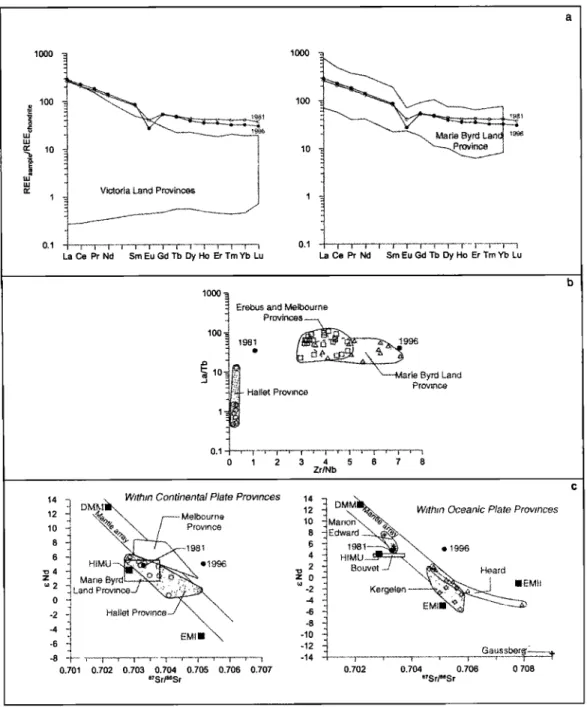
4.2. Within-Plate PSVs
Two tephra layers belong to this setting: 1981 and 1996m. The within-plate volcanic provinces under consideration are Victoria Land, including Hallett, Melbourne, and Erebus volcanic provinces, the Marie Byrd Land province, and the intraoceanic volcanoes in the Indian part of the Antarctic plate and one in the Pacific part (Peter Island). In Figure 6 the geochemical signatures of the 1981 and 1996 m layers are compared to these PSVs. Peter Island is not included because only major elements (with a typical alkaline trend) are available in the literature [Verwoerd et al., 1989]. For both layers the REE enrichments (Figure 6a) are higher than REE profiles from all the provinces from Victoria Land [Rocholl et al., 1995] which we eliminate. They seem very close to REE from Marie Byrd Land province [LeA4asztrier et al., 1976] but the trace elements (Figure 6b) and the Sr-Nd isotopic data (Figure 6c) have different signatures.
For the 1996 m layer the REE (Figure 6a and 6b) profile is close to the Marie Byrd Land signature as well
as the 14-•Nd/•44Nd
composition
(Figure
6c) [LeMasurier
et al., 1989], but the 87Sr/86Sr
isotopic
composition
(0.70517) seems more radiogenic. However, this difference could be nonsignificant because a radiogenic
tendency
for 87sr/assr
was already
noted
in the Marie
Byrd Land province with values up to 0.70422. This was
interpreted as contamination of the magma by continental
crust [?anter e! al., 1994; Kyle et al., 1994]. This, and the major elements composition which corresponds to an alkaline magma series [LeMasurier et al., 1989], appear therefore consistent with the Marie Byrd Land lava
composition. Such an alkaline composition could also
suggest
Peter
Island
as
a PSV,
but
the
radiogenic
87Sr/86Sr
isotopic signature is incompatible with its within-oceanic
plate setting.
For the 1981 m layer the REE enrichment profile (Figure 6a) is similar to that of Marie Byrd Land, but trace element depletion (Zr/Nb<l, Figure 6b) points
instead to Victoria Land Province with an intermediate
signature between Hallett province and
Melbourne/Erebus province signatures. Moreover, as the
isotopic composition (Figure 6c) could not discriminate
Hallett province from Marie Byrd Land province, no
conclusion can be drawn for these within-continental
plate provinces. On the other hand, concerning
withinoceanic-plate volcanoes, Peter Island can be
rejected because of its alkaline composition [Verwoerd et
al., 1989]. Only the transitional tholelites of Oceanic
Island basalts could correspond to the major element signature of the 1981 m layer. Marion, Bouvet, and Prince Edward can also be rejected because of a Zr/Nb ratio between 6 and 18 [Yer•voerd et al., 1989; Hart,
1988]. The other volcanoes of this province (Kerguelen,
Heard Island, etc.) present the "DUPAL" anomaly
[Dztt•r• and zlll•gre, 1983] with enriched isotopic Pb and
Sr signatures (Figure 6c) [Dosso and Muthy, 1980;
Barling and Goldstein, 1990] which do not fit with the
1981 m layer (or with the 1996 m layer).
MgO
2169 rn 6- 6 •i
I'
2 2• i 40 45 50 55 60 65 70 75 2260 rn 40 45 50 55 60 65 70 75 1280 rn 4i2
J
• 1280a
J
•,
12•80b
40 45 50 55 60 65 70 756.0
•
6.0
•
6.0
-
• 1280bK20
3.o
al'"3.o
•
i ß "3.o
!
J • 1280a'
0.0
• i ' i • •0.0
J
• T j • ' ••'•"• ß • • 0.0
;•,
•• • ,
I I I ] r 40 45 50 55 60 65 70 75 40 45 50 55 60 65 70 75 40 45 50 55 60 65 70 75SiO 2
SiO 2
SiO 2
Figure 4. Electron microprobe analysis for layers at 2169 m (20 shards), 2260 m (20 shards), and 1280 m (47 shards) plotted on Harker diagrams of K20 versus SiO2 and MgO versus SiO2. The 1280 m layer is divided in two subgroups 1280a and 1280b.
31,924 BASILE ET AL.' VOLCANIC LAYERS OF VOSTOK CORE ... Phono#te Tephriphonohte ... . Phonotephrite - .:::..::. Trachyande•ite T•8•chy•f½ Rhyotite 6 ... i BasaniCe "' "? ... ' ...
5 ...
,'"'::
...
::4
...
'"•"•"-*•••'•;"
250
• ...
....•_•..'"'•--•
'•o•
.
3 ... • L..,.:/"*•'"""•<•:•., • :;•';•' ½•:• ... 1280 ... Andestie Dac•te .... Picro-ba•att • ( Basaltic '• • ... I ... andesRe 40 45 50 55 60 65 70 75SiO 2 (wt %)
(2) .... :; :;:i' ... (4) ...::•
100 -..-.-..•
'"•
•'
...
•
!:11
:....
,•
=====================================
...
,•,•
•,,.•,.•
~...
":.
,•
:..:
2231
(3a) ...
:'
...
:::::::-:::::::'
...
.-I•
....
;
• Oe Pr Nd Sm Eu 6d Tb • Ho Er Tm Yb Lu • Oe Pr Nd 8m Eu 6d Tb Dy Ho Er Tm Yb Lu ß .•' 1981 ß 0 4 m ... • (3a) ... ß 25872 ...
;
98;
iii•i . (2)* 0 ... • ... ;'• ... ; ... :• ... :'i ... • ... • ... •' ... • ... ; ... • ... • ... '• ... • ... • ... ? ... • 0 !0 20 30 40 50 60 70 80 Zr/Nb 1 EMII 0.701 0.703 0.705 0.707 s7Sr/•SrFigure 5. Geochemical characteristics of Vostok ash layers. The ash layer label refers to the bottom depth of the l m long ice core increment containing the layer. See text for definition of sets 1 to 4. Set 2* represents set 2 without 1981 m. (a) Alkali content versus SiO2. Error bars represent the standard deviation obtained from our measurements. (b) REE profiles normalized to chondrite composition [Taylor and McLennan, 1985]. (c) La/Tb versus Zr/Nb. (d) Isotopic compositions in the theoretical model reservoirs [Hart et al., 1992]: DMM, depleted mantle; HIMU, U/Pb enriched mantle; EMI, enriched mantle with lower crust affinity; EMII, enriched mantle with upper crust affinity; mantle array represents the signature of a large number of oceanic basalts [Rollinson, 1993]. Errors bars (2c 0 are smaller than the symbol size.
BASILE ET AL.' VOLCANIC LAYERS OF VOSTOK CORE 31,925
1000
lOO
•
q V•cioda
Land
Provinces
La Ce Pr Nd Sm Eu Gd Tb Dy Ho Er Tm Yb Lu
1000 =.
100 J '•-- ...
• ... • Marie Byrd Lanq •
10
-•
'• Province
•
I •
La Ce Pr Nd Sm Eu Gd Tb Dy Ho Er Tm Yb Lu
1000
-• Erebus
and
Melbourne
•
Provinces
loo
::
•'•;•
'•arie
Byrd
Land
• lO
0 I 2 3 4 5 6 7 8
Zr/Nb
14 q '• DMM lii-. .. Within Continental Plate Provinces 12 j '-?• ".. •-• Melbourne 10 • *•. '%. / Province
6 • HIMU
...
et9•
-6
-8 'f ... • ... %•%'• • ... l ... •T•m"• •? ... 0.701 0.702 0.703 0.704 0.705 0.706 0.707 87Srl•eSr14
• DM..•'tiI•/•x
W•thin
Oceanic
P•ate
Provinces
12 10 •Mano•'• •%. 8 tiEdward ... '••z0
u-2
. H
•
-• Kergelen-• ' • -10 w -12 • T • w Gaussbergs.--. • 0.702 0.704 0.706 0.708 .7SrP6SrFigure 6. Geochemical characteristics of within-plate Potential Source Volcanoes and related ash layers (black circles). (a) REE profiles for 1981 and 1996 m layers; shaded areas represent the limits of most rand least enriched profiles of Victoria Land provinces [Rocholl e! al., 1995] and Marie Byrd Land province [Lemasurier et al., 1976]. (b) La/Tb versus Zr/Nb signatures of 1981 and 1996 m layers of Victoria Land provinces (open circle, Hallett province [Rocholl e! al., 1995]; open square, Erebus province and Melbourne province [Kyle, 1989b, 1989c]) and Marie Byrd Land province (open triangle) [Lemasurier et al., 1989]. (c) Isotope signature of the 1981 and 1996 m layers (black circles); within continental (right) and oceanic plate (left) provinces are separated for legibility. See Figure 5d for reservoir definitions. Hallett province [Rocholl et al., 1995], Melbourne province [WOrner et al., 1989], Marie Byrd Land province [Kyle et al., 1994], Kerguelen islands [Dosso and Muthy, 1980], Heard Island [Barling and Goldstein, 1990], Bouvet Island [Verwoerd et al., 1989], Marion and Edward Islands [Hart, 1988].
We conclude that the source of the 1996 m layer is very likely located in Marie Byrd Land province. The source of the 1981 m layer is probably restricted to a within-continental plate source (Victoria Land or Marie Byrd Land province), but we cannot discriminate in any greater detail.
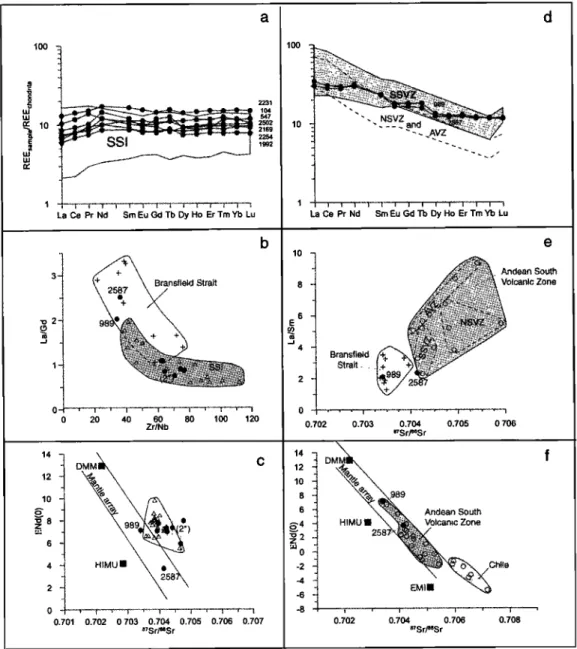
4.3. Subduction Zone PSVs
For subduction PSVs the provinces are the SSIs, the Bransfield Strait, the South American and the New Zealand provinces. Set 2* contains seven "depleted REE"
Vostok layers that appear to correspond to the signature
31,926 BASILE ET AL.: VOLCANIC LAYERS OF VOSTOK CORE
lOO
•i
2231
25O2
2169 2254 lgg2 La Ce Pr Nd Sm Eu Gd Tb Oy Ho Er Tm Yb Lu 3' •2 0 20 40 60 80 100 120 Zr/Nb 0.701 0.702 0.703 0.704 0,705 0,706 0.707 87Sr/•SrlOO
ß
10
!
La Ce Pr Nd Sm Eu Pod To Dy Ho Er Tm Yb Lu2
•i'• ... '. Andean South8
lcanic
Zone
Strait
2
•/ 258'7
0.702 0.703 0.704 0.705 0.706
e7Sr•Sr
6
xx '•"'":• VolcanicAndean
South
Zone•-4 HIMU
11258
'•o•
-2 •
/Ch•ie
0.702 0.704 0.7• 0.708
S7Sr/SSSr
Figure 7. Geochemical characteristics of subduction potential source volcanoes. (a-c) signatures of the
SSIss m•d the "depleted LREE" layers (black circles). (b, d, e, f) show the Bransfield Strait and the
Andem• signatures with the 989 and 2587 m layers. Shaded areas represent the limits of most and least
depleted REE profiles for each province. Crosses, Bransfield Strait [Weaver et al., 1979]; open triangle,
SSIs [Pearce et al., 1995]; open circles, South America [Hawkesworth and al., 1979; Futa and Stern,
1988].
their trace elements (Figure 7b) and their isotope compositions (Figure 7c). Some Vostok layers display a Sr composition slightly more radiogenic than the SSIs lava composition given by Pearce et al., [1995]. However, such an isotopic signature is typical of young oceanic subduction for which the SSIs (age < 3Ma) are the unique candidate among the PSVs. We have no explanation for this difference, but such a shift between the in situ lavas and their relative pyroclastics has already been observed [e.g., Ewart and $tipp, 1968] and points out the limits of the comparison between pyroclastics and
lavas.
We can extend the SSIs comparison to layers for
which no trace elements are available. Pearce et al.
[1995] have shown that SSIs lava follows three distinct magmatic trends in major elements: a 1ow-K tholeiitic
series, a tholeiitic series, and a calc-alkaline series of oceanic arcs. SSIs are also the only volcanoes that produce 1ow-K tholeiitic magmas among the PSVs. Thus using these arguments, we classify the two events of set 1 as !ow-K tholeiitic (1280a and 2326 m) originating from
the SSIs.
The 989 and 2587m layers (set 3a) are basaltic
andesites (Figure 5) from calcalkaline series lava which
do not correspond to SSIs composition (Figure 7a, 7b, and 7c). They neither correspond to a New Zealand signature since the Taupo volcanic zone produced only
rhyolitic emissions (SIO2>70%) over the last 0.5 million
years [E•art and Stipp, 1968; Simkin and Siebert, 1994]. Thus only the Bransfield Strait or volcanic zones in South
America could be the sources. Both are associated with a
BASILE ET AL.: VOLCANIC LAYERS OF VOSTOK CORE 31,927
continental plate). There is a slight geochemical distinction between those two volcanic provinces, as
illustrated
by the La/Sm
versus
*7Sr/a6Sr
plot (Figure
7e),
where the Bransfield Strait displays a less radiogenic strontium isotope signature and a lower LREE enrichment than the Andean volcanoes (see appendix for tectonic justification). Thus regarding the isotopic information and the high content of TiO2 (Table 2), the 989 m layer seems to correspond to the Bransfield Strait signature [Smellie, 1989]. Unfortunately, for the
Bransfield
Strait,
REE profiles
and 143Nd/144Nd
data are
not available to confirm our suggestion. For the 2587 m layer, the REE profile (Figure 7d) suggests South America and probably the southern south volcanic zone (SSVZ) as a possible source.
We may also suggest a source for the 1280b and 1431m layers (set 3b) for which we do not have trace element data. These layers belong to the calc-alkaline series, and taking into account their relative acidity (SIO2=66%), their low TiO2 content, and the rather small size of the particles, we may suggest with confidence an Andean origin. The 181 m layer belongs to set 2, which includes both within-plate and subduction volcanoes. In this case, the major elements are not sufficient to discriminate, and no source can be proposed.
5. Discussion
5.1. Source Volcanoes
We finally suggest that the subduction volcanoes of the SSIs are sources of the "depleted LREE" layers (104, 547, 1992, 2169, 2231, 2254, and 2502 m) as well as the 1280a and 2326 m layers. Sources for the 1280b, 1431, and 2587 m layers are probably located in the Andean cordillera. The 2587 m layer is probably restricted to the
southern south volcanic zone of South America.
Bransfield Strait is the source for the 989 m layer. The 1996 m layer originates from Marie Byrd Land province, while the 1981 m layer is from West Antarctica.
The SSIs appear therefore as an important source for visible tephra layers discovered in the Vostok ice core (i.e., more than 65% of the events). The SSIs signature has already been suggested for two Vostok layers found at depths of 100.8 and 550m from previous cores adjacent to our Vostok ice cores. Kyle e! al. [1984] and Palais et al. [1987] studied one layer at 100.8 m from a shallow ice core that is equivalent to our 104 m layer on BH1, and ?alais et al. [1989] analyzed the 550 m layer in the "3G" Vostok core that is equivalent to our 547 m layer from "4G2." From the major element composition these authors proposed the Candlemas volcano (one of the 13 SSIs volcanoes) as the source for the two layers. Our data also suggest a SSIs source but from other volcanoes. From the study of Pearce e! al. [1995], Candlemas volcano belongs to the low-K tholeiitic trend (K20--•0.35% at SIO2---60%) and has a high LREE depletion (La/Sm<0.8). By comparison our results show for the 104 m layer a similar composition for major elements (K20=0.5% at SiO2-60.23%) but a low LREE depletion (La/Sm=0.92). This composition corresponds more closely to tholeiitic SSIs volcanoes such as Bellingshausen, Saunders, or Visokoy Islands as defined
by Pearce and coworkers. It was also found that lava from
Cook and Thule Islands with tholeiitic signatures could
also be the source. The 547 m layer (K20=0.86% at
SiO2-60.90% and a La/Sm=l.58) corresponds more
closely to a talcalkaline series in which Leskov and
Freezland are represented [Pearce et al., 1995]. These
two examples show once again the interest of the traces
and at the same
time the limitation
of the interpretation
wlnen
only major element
composition
is used
and only
scarce data on sources are available in the literature.5.2. Atmospheric Transport
It is obvious that in addition to the frequency of the eruptions, the height of injection, the circulation of tropospheric air masses, and the distance between the
volcanic center and the location of the studied Antarctic
ice core site also greatly affects the occurrence of tephra in central Antarctica. For example, the Byrd ice core is located ,-500 km from the Marie Byrd volcanoes, and the ice record, which covers the last • 100 kyr contains •2000 tephra events. This gives an overall frequency of 1 per 50 years. For Vostok, a total of---20 tephra have been detected, mostly from SSIs and •-5000 km away. Over the 400 kyr of the ice record, this gives a frequency of 1 per 20,000 years. It is of interest to note the decrease by 3 orders of magnitude in occurrence of tephra when the distance to the source changes by I order of magnitude. Interestingly, the occurrence of tephra in the Dome-F
core also in East Antarctica but closer to SSIs centers is
50% higher (1.5 per 20000 years) than in the Vostok core [l:•.t•i e• a/., 1999]. However, the transport is not in a direct line to Antarctica, and it is necessary to take into account not only the distance between the volcanic center
and the Antarctic site but also the circulation of
tropospheric air masses.
The transport of volcanic clouds from the SSIs to East Antarctica seeins a priori consistent with the general atmospheric circulation with tropospheric air masses spiraling southward toward Antarctica. However, the size of particles restricts the duration of transport because most of the ash particles are found in the first hundred kilometers around volcanoes [Fisher, 1964]. For example, 20 [tin particles settle rapidly in the atmosphere and according to Stoke's law fall by 500 to 1000 m per day. Taking into account the 4000 m elevation of the East Antarctic plateau, the volcanic ash would have to reach a very great height after eruption. So assuming that SSIs volcanic eruptions can inject tephra up to a 6000 m altitude in the troposphere, corresponding to a volcanic explosivity index (VEI) of 2 to 3 [Newhall and Self, 1982], the transport duration to Vostok should not exceed 2 to 4 days. This represents direct advection with an apparent average horizontal speed of •100 km/h, a value that increases with particle size and with the lower level reached by the volcanic cloud. Thus the tephra event in the ice core is probably associated with a particular synoptic situation leading to high eddies and strong tropospheric perturbations which penetrate almost directly to the center of Antarctica (Figure 8). This scheme of transport can be extended to South America (1280b, 1431 and 2587 m layers) and to Antarctic Peninsula (989 m layer) which represent more distant
![Figure 2. Position of the visible ash layers in the Vostok core studied, recorded along with the isotopic composition (deuterium) of the ice and the age of the layer [Petit et al., 1999]](https://thumb-eu.123doks.com/thumbv2/123doknet/13773788.439143/5.918.222.725.101.728/figure-position-visible-vostok-recorded-isotopic-composition-deuterium.webp)