HAL Id: hal-01909519
https://hal.archives-ouvertes.fr/hal-01909519v2
Submitted on 28 May 2020
HAL is a multi-disciplinary open access
archive for the deposit and dissemination of
sci-entific research documents, whether they are
pub-lished or not. The documents may come from
teaching and research institutions in France or
abroad, or from public or private research centers.
L’archive ouverte pluridisciplinaire HAL, est
destinée au dépôt et à la diffusion de documents
scientifiques de niveau recherche, publiés ou non,
émanant des établissements d’enseignement et de
recherche français ou étrangers, des laboratoires
publics ou privés.
carbon location: 3-D X-ray microscopy and NanoSIMS
results
A. Alexandre, I. Basile-Doelsch, T. Delhaye, D. Borshneck, Jean-Charles
Mazur„ P. Reyerson, G. M. Santos
To cite this version:
A. Alexandre, I. Basile-Doelsch, T. Delhaye, D. Borshneck, Jean-Charles Mazur„ et al.. New highlights
of phytolith structure and occluded carbon location: 3-D X-ray microscopy and NanoSIMS results.
Biogeosciences, European Geosciences Union, 2015, 12 (3), pp.863-873. �10.5194/bg-12-863-2015�.
�hal-01909519v2�
www.biogeosciences.net/12/863/2015/ doi:10.5194/bg-12-863-2015
© Author(s) 2015. CC Attribution 3.0 License.
New highlights of phytolith structure and occluded carbon location:
3-D X-ray microscopy and NanoSIMS results
A. Alexandre1, I. Basile-Doelsch1, T. Delhaye2, D. Borshneck1, J. C. Mazur1, P. Reyerson3, and G. M. Santos4
1Centre Européen de Recherche et d’Enseignement des Géosciences de l’Environnement (UMR 7330), CNRS, Aix-Marseille
Université, Europôle méditerranéen de l’Arbois BP 80, 13545 Aix en Provence CEDEX 04, France
2Plateforme NanoSIMS, OSUR, Université de Rennes 1, Campus de Beaulieu, 35042 Rennes CEDEX, France 3Department of Geography, University of Wisconsin-Madison, 550 North Park Street, Madison, WI 53706, USA 4Department of Earth System Science, University of California, Irvine, B321 Croul Hall, Irvine, CA 92697-3100, USA Correspondence to: A. Alexandre (alexandre@cerege.fr)
Received: 29 August 2014 – Published in Biogeosciences Discuss.: 14 October 2014 Revised: 19 December 2014 – Accepted: 12 January 2015 – Published: 12 February 2015
Abstract. Phytoliths contain occluded organic compounds
called phytC. Recently, phytC content, nature, origin, pale-oenvironmental meaning and impact in the global C cycle have been the subject of increasing debate. Inconsistencies were fed by the scarcity of in situ characterizations of phytC in phytoliths. Here we reconstructed at high spatial resolu-tion the 3-D structure of harvested grass short cell (GSC) phytoliths using 3-D X-ray microscopy. While this technique has been widely used for 3-D reconstruction of biological systems it has never been applied in high-resolution mode to silica particles. Simultaneously, we investigated the loca-tion of phytC using nanoscale secondary ion mass spectrom-etry (NanoSIMS). Our data evidenced that the silica structure contains micrometric internal cavities. These internal cavities were sometimes observed isolated from the outside. Their opening may be an original feature or may result from a be-ginning of dissolution of silica during the chemical extrac-tion procedure, mimicking the progressive dissoluextrac-tion pro-cess that can happen in natural environments. The phytC that may originally occupy the cavities is thus susceptible to rapid oxidation. It was not detected by the NanoSIMS technique. However, another pool of phytC, continuously distributed in and protected by the silica structure, was observed. Its N / C ratio (0.27) is in agreement with the presence of amino acids. These findings constitute a basis to further characterize the origin, occlusion process, nature and accessibility of phytC, as a prerequisite for assessing its significance in the global C cycle.
1 Introduction
When absorbing nutrients in the soil, plants roots also uptake a significant amount of silicon (Si). The Si fluxes recycled by plants are substantial; for example, Si take up by tropi-cal forests or grasslands can reach 2 to 10 times Si fluxes generated from the dissolution of soil silicates that are ex-ported to stream water (e.g., Blecker et al., 2006; Struyf and Conley, 2009; Cornelis et al., 2011; Alexandre et al., 2011). Inside the plant, Si is transported in the sap and de-posited inside the cells, in the cell walls and in extracellular spaces of stems and leaves as micrometric hydrous amor-phous silica particles called phytoliths. Upon plant decay, part of the phytolith production can be incorporated into soils or sediments and preserved for as long as millions of years (Alexandre et al., 2011; Miller et al., 2012; Strömberg et al., 2013). These fossil phytolith assemblages can be used for re-constructing past vegetation and climate conditions via their morphological and geochemical signatures (Piperno, 2006; Alexandre et al., 2012). Phytoliths occlude small amounts of organic compounds, first evidenced by the production of carbon (C) and nitrogen (N) during dry ashing (Jones and Beavers, 1963). Later on, scanning transmission electron mi-croscopy (STEM) and energy dispersive X-ray (EDX) anal-yses of phytoliths in the plant tissues confirmed that the occluded organic compounds contained C, N and phospho-rus (P) (Laue et al., 2007). By extension, these occluded com-pounds are here called phytC. PhytC, which is assumed to be
protected from natural oxidation by the siliceous structure, has been the subject of increasing attention and debate.
Based on the assumption that phytC originated from the photosynthesis of atmospheric CO2 in the host plant,
sev-eral studies used phytC14C and δ13C signatures respectively as a dating tool (Piperno and Becker, 1996; Piperno and Stothert, 2003; McMichael et al., 2012) and a paleoenviron-mental proxy (Kelly et al., 1991; Smith and White, 2004; Carter, 2009; Webb and Longstaffe, 2010; McInerney et al., 2011). However, very recently, 14C-AMS measurements of phytC samples from modern grasses yielded ages of several thousand years, which suggested that phytoliths may incor-porate a substantial amount of old carbon, potentially from the soil (Santos et al., 2010, 2012). Amino acids from soils have been shown to be taken up by plants, and transported in small proportions to roots, stems and shoots (Paungfoo-Lonhienne et al., 2008; Whiteside et al., 2009, 2012; Gao et al., 2010; Warren, 2012). Thus it is not inconsistent to assume that C and N derived from these soil amino acids have been trapped in phytoliths. Although the hypothesis still needs to be verified, it raises the question of the molecular nature of phytC. Several techniques such as high-performance liquid chromatography (HPLC), gas chromatography mass spec-trometry (GC–MS), protein staining, micro-Raman analysis and X-ray photoelectron spectroscopy (XPS) have been used to characterize phytC and led to contradictory results, espe-cially regarding the presence or not of amino acids (Harri-son, 1996; Pironon et al., 2001; Smith and Ander(Harri-son, 2001; Elbaum et al., 2009; Watling et al., 2011). The problem is that these methods were applied on phytolith concentrates that were not proven to be completely devoid of extraneous organic remains. Chemical extractions leading to high-purity phytolith concentrates are indeed difficult to implement. Al-though the absence of organic particles can be checked by scanning electron microscopy (SEM) coupled with EDX (Corbineau et al., 2013), the presence of extraneous organic remains on the phytolith surface cannot be accurately de-tected.
Differences in the efficiency of phytolith extraction pro-tocols may also explain the inconsistencies in phytC quan-tification. Accurately quantifying the phytC is important for the assessment of its significance in the terrestrial C cycle. Multiple studies have recently claimed that phytC may play a role in atmospheric CO2sequestration and climate change
mitigation (Parr and Sullivan, 2005; Parr et al., 2010; Song et al., 2014; Huang et al., 2014; Li et al., 2014; Zuo et al., 2014), although the fluxes of phytC from vegetation to soils and the residence time of phytC in soils are still largely un-known. PhytC content as high as 20 % dry weight was ob-tained when using a phytolith extraction method based on microwave digestion (Parr and Sullivan, 2014). This value was more than 20 to 200 times higher than the values ob-tained using a chemical method verified to be 100 % effi-cient for removing extraneous organic particles (from 0.1 to 1 % dry weight; Smith and White, 2004). The difference was
somewhat justified by partial dissolution of phytC when us-ing aggressive protocols. The assumption that phytC may be located at different sites in the silica structure, with differ-ent accessibility to oxidation, has been put forward (Parr and Sullivan, 2014). This assumption supplemented a previous one, widely found in the literature, that micrometric opaque areas observed by natural light (NL) microscopy on some phytoliths were holes containing the phytC (Prychid et al., 2003; Piperno, 2006; Carter et al., 2009; Song et al., 2012; Parr and Sullivan, 2014). No measurements were however performed to support any of these hypotheses.
Finally, the debates on content, location, nature, origin and paleoenvironmental meaning of phytC have been fed by the scarcity of in situ characterizations of phytC in phy-toliths, despite few seminal works (Harrison, 1996; Laue et al., 2007). Here we reconstructed, at high spatial resolu-tion, the 3-D structure of grass phytoliths using 3-D X-ray microscopy. Simultaneously, we characterized the location of phytC using nanoscale secondary ion mass spectrome-try (NanoSIMS).
2 Material and methods
Grasses are among the main producers of phytoliths. The leaves of Triticum durum wheat (TD-F-L), were harvested in 2012 at the Genomics Research Centre in Fioren-zuola d’Arda (Italy). Hundreds of grams were made available to us for phytC investigation. Phytoliths were extracted from 50 g of dry leaves using a wet chemical protocol recently set up for geochemical analysis of phytC. The protocol was de-scribed in detail in Corbineau et al. (2013). The organic mat-ter was oxidized with H2SO4, H2O2, HNO3and KClO3, and
potential remains on the phytolith surface were dissolved us-ing KOH (pH of 11). The absence of residual extraneous or-ganic particles was checked using SEM-EDX (Corbineau et al., 2013). Dominant phytolith types were recognized accord-ing to Madella et al. (2005) usaccord-ing NL microscopy at 600× and 1000× magnifications. As expected, the grass short cell group (GSC) and the bulliform cell group dominated the as-semblage. These groups, which form in all grass epidermis, also dominate phytolith assemblages produced by grasslands and recovered from soils (e.g., Alexandre et al., 2011). Sev-eral NL microscopy and SEM pictures, illustrating the com-position of the TD-F-L phytolith assemblage were taken. For the purpose of morphological comparison, pictures of fos-sil GSC and bulliform phytoliths from available soil assem-blages described in previous papers, were additionally taken. The 3-D structure of the GSC phytoliths was reconstructed by X-ray imaging at the micro-scale, using a 3-D X-ray mi-croscope Zeiss Ultra XRM L 200. A few phytoliths, ran-domly selected from the bulk sample, were deposited on the inner surface of a bevel-cut Kapton tube of 50 µm internal di-ameter. Five individual GSC phytoliths were recognized by optical microscopy at 200× magnification and their position
located for 3-D visualization. The principle of the 3-D X-ray microscopy technique is based on focusing the X-ray beam on a rotating sample using an optical lens; then transmitted X-rays are diffracted by a Fresnel zone plate on a scintilla-tor in front of an optical device to produce a 200× magni-fied image of the phytolith captured by a charge-coupled de-vice (CCD) image sensor. Using a 1K × 1K detector, it leads to a voxel size of 63 nm. The X-ray beam path is continu-ously flushed with helium to minimize the absorption of X-rays by air, the sample and the optics excepted. While this technique has been widely used for 3-D reconstruction of bi-ological systems it has never been applied in high-resolution mode to silica particles. Analysis of the phytoliths proceeded at 150 nm resolution for a 65 µm field of view, in conven-tional absorption contrast imaging mode at 8 keV (copper rotating anode; power set at 40 kV and 30 mA). Using this mode, the contrast was generated both from the different X-ray attenuation coefficients of the chemical elements com-posing the sample and from the density. A total of 901 X-ray projections were recorded between −90 and +90◦at an an-gle step of 0.2◦and an exposure time of 80 s per view. After 20 h of analysis, reconstruction of the phytolith volume was performed using XMReconstructor (Zeiss Xradia software). The resulting stack of 2-D grayscale slices was then exported to Avizo Fire (FEI group) for further image processing.
NanoSIMS analyses were performed on cross sections of TD-F-L phytoliths embedded in epoxy resin. One mil-ligram of phytoliths was deposited on polytetrafluoroethy-lene (PTFE) filters (9 mm i.d.) stuck onto double face tape. Polypropylene (PP) tubes (10 mm i.d. and 15 mm long) were placed on the tape, encircling the phytoliths. Epoxy resin (Araldite 100/Hardener 16) was slipped into the tubes up to 3 mm height and left to dry for 3 h at 40◦C. Resin of 7 mm height was added and left to dry for 48 h at 40◦C. Those two steps prevented the resin from leaking from the base of the tube. Embedded samples were taken off the tubes and pol-ished with diamond paste up to 0.1 µm, until the PTFE fil-ter was completely removed and cross sections of phytoliths were visible in NL microscopy. Samples were sawn into 4 mm thick blocks. Dozens of GSC phytoliths cross sections to be analyzed with the NanoSIMS were located by SEM. The NanoSIMS technique is based upon the sputtering of a few atomic layers from the surface of a sample induced by a primary ion bombardment. The primary ion impact triggers a cascade of atomic collision. Atoms and atomic clusters are ejected. During the ejection process, some atoms and clusters are spontaneously ionized. These secondary ions are charac-teristic of the composition of the analyzed area. They are sep-arated according to their mass and an image of the intensity of the secondary ion beam is made for a selected mass (http:// www.cameca.com/instruments-for-research/sims.aspx. Over the past few years, the NanoSIMS technique has increasingly been used in geosciences to investigate the elemental and iso-topic composition of organic and inorganic materials (Her-rmann et al., 2007; Hatton et al., 2012; Mueller et al., 2012,
2013). The NanoSIMS technique however has only scarcely been used for measuring secondary ion emission from amor-phous silica. One study showed NanoSIMS images of a thin section of a giant siliceous sponge spicule (several mil-limeters in diameter). A micrometric proteinaceous scaffold, which averaged 2 % C dry weight, could be detected in the siliceous structure (Müller et al., 2010). The NanoSIMS tech-nique was also used for identifying silicification sites in rice roots (Moore et al., 2011). Here, we analyzed the inten-sities of [28Si]−, [16O]−, [24C2]− and [26CN]− ions
pro-duced by selected areas of the GSC phytoliths polished cross sections using a Cameca NanoSIMS 50. The section was coated with 25 nm gold and introduced in the NanoSIMS. A [Cs]+ primary ion probe with 16 kV primary ion im-pact energy and a 8 kV secondary ion extraction voltage was used. The best adjustment for obtaining secondary ion im-ages of [28Si]−, [16O]−, [12C]− and [26CN]− was the fol-lowing: the selected phytolith surface were first pre-sputtered with a de-focused primary beam on a 60 µm × 60 µm area for 3 min. Then 256 × 256 pixel images were made using a 2.2 pA primary ion current (primary diaphragm diameter of 300 µm) and a counting time of 10 ms per pixel for ar-eas of 30 µm × 30 µm. Analyses with longer counting time or larger primary diaphragm/higher primary beam intensity were also tested. Secondary ion images of [28Si], [16O]−, [12C]−and [26CN]−were processed using the ImageJ soft-ware (http://imagej.nih.gov/ij). Colors were assigned to dif-ferent signal intensities, increasing from black to red. Images of the [26CN]−/ [12C]− ratio were also created. Line scans were drawn across the analyzed surfaces and ion intensity vs. distance along the line were plotted.
For comparison with the NanoSIMS results, the C and N contents of the bulk TD-F-L phytolith sample were measured by chemiluminescence after combustion at 1350◦C (for C) and 1000◦C (for N). The C and N contents of the epoxy resin were measured with an elemental analyzer (EA) after combustion at 1350◦C.
3 Results
Three morphological categories of phytoliths, commonly found in grasses, constituted the bulk sample. SEM pictures of phytoliths placed on the aluminum mount illustrate these categories in Fig. 1. SEM pictures of cross sections of the same categories are shown in Fig. 2. For each category, the mode of silica deposition is specified below when it has been previously evidenced in SEM, TEM, fluorescence mi-croscopy or NanoSIMS images of plant cross sections (Sang-ster and Parry, 1969; Sowers and Thurston, 1979; Harrison, 1996; Currie and Perry, 2007; Law and Exley, 2011; Moore et al., 2011). The first phytolith category is constituted by thin fragments of multi-cellular silica sheets, several tenths of a micrometer long and wide but less than a few microme-ters thick (Figs. 1a, b, 2a, b). These silica “skeletons”
(Sang-25mm 50mm (d) a b Rondel types Silica sheets 15mm 10mm e 10mm c Figure 1. d f 10mm
Figure 1. SEM images of TD-F-L wheat phytolith assemblage,
de-posited on an aluminum mount. Three categories are illustrated: (1) silica sheets (a, b), (2) stellate type from intercellular space (c) and (3) GSC phytoliths including rondel (d, e) and polylobate types
(f).
ster and Parry, 1969; Law and Exley, 2011) were shown to result from the silicification of the middle lamella of the cells walls in grass epidermis and mesophyll, possibly as an early step of silicification (Laue et al., 2007; Law and Ex-ley, 2012). Although abundant in plants (Piperno, 2006), the multi-cellular silica sheets are rapidly subjected to fragmen-tation and dissolution and are scarcely preserved in soils and sediments (Alexandre et al., 1994). The second phytolith cat-egory is constituted by stellate silica particles, of 10–15 µm width (Fig. 1c) that were shown to form in the intercellular spaces of the grass epidermis (Lins et al., 2002). This mode of silica precipitation was described as centripetal, starting as a narrow band lining the cavity, then partially or com-pletely infilling the intercellular space (Sangster and Parry, 1981). The third category dominated the wheat phytolith as-semblage. It is made of monocellular phytolith types of 10– 50 µm of length, width and thickness. Most of them are GSC phytoliths and belong to the rondel (Fig. 1d, e) and polylo-bate (Fig. 1f) types. The formation of the monocellular phy-tolith type was also shown to be centripetal, starting in or against the cell walls and progressively infilling the lumen (e.g., Zhang et al., 2013). The processes that lead to com-plete silicification of the cells and to organic compounds oc-clusion are still unknown. Cellulose fibrils from the cell wall may regulate the silica formation (Laue et al., 2007).
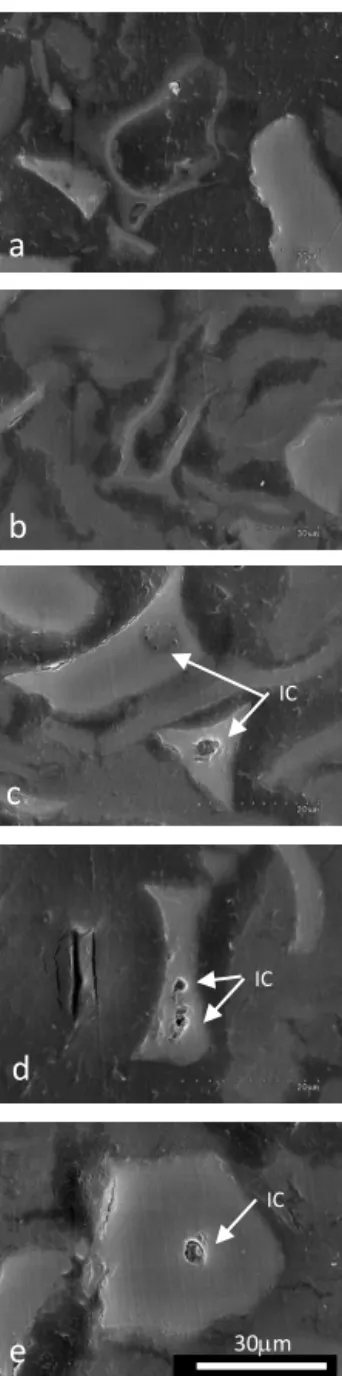
SEM observations of cross sections of dozens of GSC phytoliths evidenced one or two internal cavities a few mi-crometers in diameter in the silica structure (Fig. 2c, d, e). They were similar in shape and size to the low electron den-sity round area visible on one of the TEM image of phy-toliths shown by Laue et al. (2007) (Fig. 2b of Laue et al., 2007). However, SEM observation of the GSC phytoliths just placed on the aluminum mount did not evidence any holes on the phytolith surface. When observed with NL microscopy (Fig. 3) the internal cavities were recognizable as opaque ar-eas.
Figure 2.
a
b
c
d
e
30mm IC IC ICFigure 2. SEM images of the thin section of the TD-F-L wheat
phytolith types including silica sheets (a, b), and GSC phytoliths of the rondel type (c, d, e). GSC types show micrometric internal cavities (IC).
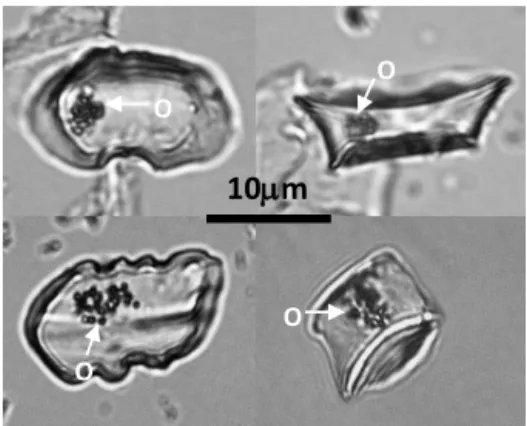
10
m
m
Figure 3.
O O O OFigure 3. NL microscopy images of GSC phytolith types from the
wheat TD-F-L sample showing opaque areas (O).
Two examples of reconstructed 3-D X-ray microscopy volumes are presented in Figs. 4 and 5. The observed pat-terns were common to the five analyzed GSC particles. The siliceous structure appeared porous at the sub-micrometer scale (Figs. 4a and 5a). Inside the structure, areas of a few micrometers in diameter, with significantly lower X-ray ab-sorption than the surrounding, were observed (Fig. 4a). 2-D planes of the reconstructed volumes evidenced that these het-erogeneities were the cavities several micrometers wide pre-viously identified on the cross sections by SEM. The cavities were interconnected (Figs. 4b, 5b). Some particles showed cavities isolated from the phytolith surface by a few microm-eter thick silica wall (Fig. 4b). Other particles showed cav-ities connected to the phytolith surface by small holes of 0.1 µm diameter only (Fig. 5b). These cavities appeared to be filled with air (no X-ray absorption), although the high con-trast in X-ray absorbance between silica and air may have masked the presence of organic compounds.
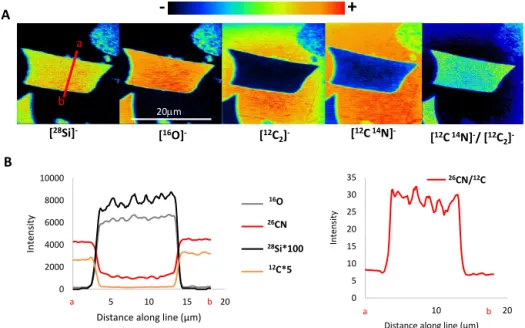
The NanoSIMS results, common to the dozens of ana-lyzed phytolith thin sections, are illustrated in Figs. 6–8. Adjustments were done to find the pre-sputtering duration (3 min), the primary ion beam intensity (L1 = 2 kV), the pri-mary diaphragm diameter (750 µm) and the duration of anal-yses (11 min) appropriate for obtaining sufficient total ion current (TIC) and avoid charging effects (Figs. 6a, 7a). When the primary ion beam intensity was increased to L1 = 4 kV (Fig. 8a), when the primary diaphragm diameter was de-creased to 300 µm (Fig. 8b), or when a succession of analy-ses resulted in increasing the duration of sputtering (Fig. 8c), a zone devoid of secondary ion signal appeared at the cen-ter of the silica surface. This was probably due to charg-ing (Mueller et al., 2012) and/or to topographic heterogene-ity (Winterholler et al., 2008). As silica was more resistant to polishing than the epoxy, silica surfaces were often con-vex (Fig. 8). The tests conducted here emphasized the im-portance of looking for the most efficient adjustment (i.e., avoiding charging and topographic effects) before perform-ing NanoSIMS analyses on silica surfaces.
[28Si]−, [16O]−, [12C]−and [26CN]−images clearly indi-vidualized phytoliths from the epoxy resin. The [28Si]−and [16O]− images and scan lines showed that phytoliths were made of a continuous silica structure (Figs. 6 and 7) some-times interrupted by central micrometric areas devoid of sil-ica (Fig. 7). This is again in concordance with the central cav-ities identified in SEM and 3-D X-ray imaging. Carbon was present in the cavities and in the silica structure itself. How-ever when values of [12C]−intensity were similar in the cav-ities and in the epoxy resin, they were 10 to 20 times lower in the silica structure than in the epoxy resin (Figs. 6 and 7). N was also present in the silica structure and [26CN]− in-tensity was 3 to 4 times lower in the silica structure than in the cavities or the epoxy (Figs. 6 and 7). Interestingly, the [26CN]−/ [12C]−ratio ranged between 20 and 30 in the sil-ica structure and between 5 and 10 in the cavities and the epoxy. The silica structure was thus enriched in N by a fac-tor of 4 to 8 relative to the surrounding epoxy. These fea-tures were reproducible from a particle to another. Bulk C and N contents in phytoliths, measured by chemilumines-cence and EA (cf. Sect. 2), were 0.4 and 0.1 % dry weight for phytoliths, and 68.8 and 2.8 % dry weight for the epoxy resin, respectively. The N / C ratio was 0.27 for the phytoliths and 0.04 for the epoxy resin. The bulk phytolith sample was thus enriched in N relative to the epoxy resin by a factor of 6.8, in agreement with N enrichments calculated from the NanoSIMS data. This consistency strengthened the accu-racy of the [12C]−and [26CN]−relative intensities measured with the NanoSIMS. Finally, [26CN]−/ [12C]− NanoSIMS images clearly showed that organic compounds, with N con-tent significantly higher than in the resin, were continuously distributed (at the sub-micrometer scale) in the silica struc-ture. On the contrary, cavities appeared to be filled with the epoxy resin.
4 Discussion
4.1 PhytC locations in the silica structure of GSC phytoliths
SEM, 3-D X-ray microscopy and NanoSIMS images showed that the silica structure of GSC phytoliths was homogeneous at the micrometric scale and systematically contained cen-tral micrometric interconnected cavities. The fact that some particles contained cavities isolated from the outside sug-gests that the opening to the outside can be either original or result from dissolution after the phytolith formation. Phy-toliths often contain up to a few percent by dry weight of aluminium (Al) by dry weight (Bartoli and Wilding, 1980; Carnelli et al., 2004) co-precipitating with silica (Hodson and Sangster, 1993). As Al dissolves in strong acids and in strong bases, the phytolith chemical extraction procedure that in-cluded HNO3and H2SO4steps may have initiated phytolith
sil-Figure 4 Back Front IC Back Front A IC IC IC IC 20 mm a b c d e f B Front Back
Figure 4. 3-D X-ray microscopy of a GSC phytolith from wheat (TD-F-L): (a) four views of the reconstructed volumes; internal cavities
(IC) are distinguishable. (b) 2-D X-ray slices superimposed on the phytolith volume rendering, showing from front to back the internal cavity (IC). No connection to the surface was evidenced. The blue area corresponds to the thresholding of the phytolith grayscale values.
Back Front Back Front IC H (0,4mm) IC H H 14 mm Figure 5 A B a b c d e f 14 mm H (0,4mm)
Figure 5. 3-D X-ray microscopy of a GSC phytolith from wheat (TD-F-L): (a) reconstructed volume. (b) 2-D X-ray images from back to
front of the phytolith showing the internal cavity (IC) and its connection to the surface, forming holes (H). The blue area corresponds to the thresholding of the phytolith grayscale values.
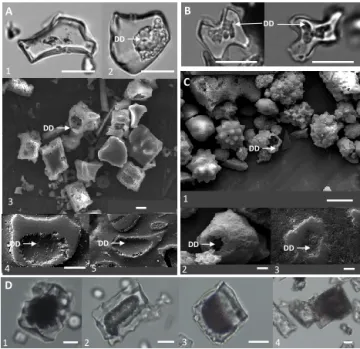
ica wall between the cavities and the phytolith surface. The procedure also included a final alkaline step (KOH solution at pH 11) that may also have increased the dissolution fea-tures on the silica surfaces. As phytoliths were directly ex-tracted from the plant, the surficial dissolution was revealed here at its beginning. It is expected to reach higher degrees over time in natural environments where multiple dissolu-tion factors come into play (Iler, 1979). Large dissoludissolu-tion features were indeed often observed on fossil phytoliths and were quantified to assess the degree of weathering of soil phytolith assemblages (Alexandre et al., 1999; Oleschko et al., 2004). To illustrate this point, SEM and NL microscopy images of the entirety and cross sections of fossil monocel-lular phytoliths collected from soils are shown in Fig. 9. The phytolith types are characteristic of grass epidermis (GSC types and Cuneiform bulliform types; Madella et al., 2005)
(Fig. 9a, b) and wood parenchyma (globular granulate type; Madella et al., 2005) (Fig. 9c). The dissolution of silica has made central depressions of several micrometers wide. The particles appear empty inside, which is consistent with dis-solution starting from the silica walls located between the cavities and the phytolith surface, then slightly opening, or increasing the opening of the cavities to the outside, and then enlarging the cavities into dissolution depressions. Such dis-solution depressions are not limited to GSC phytoliths. They were observed on many types of monocellular phytoliths from grasses and non-grasses extracted from soils and sed-iments as illustrated in Fig. 9a5 (Acicular type), 9b2 and 9b3 (globular granulate). This implies that the inner part of all these phytolith types was constituted by silica less dense than the outer part, either due to phytC occlusion or to a lack of
0 2000 4000 6000 8000 10000 0 5 10 15 20 In ten sity
Distance along line (µm)
16O 26CN 28Si*100 12C*5 0 5 10 15 20 25 30 35 0 10 20 In te n si ty
Distance along line (µm) CN/C [12C 2]- [ 12C14N] -[28Si] -[16O]
--
+
[12C14N]-/ [12C 2] -Figure 6. A B a b a b 20mm a b 26CN/12C 26CN/12C 16O 26CN 28Si*100 12C*5Figure 6. NanoSIMS images and intensities of a first typical GSC phytolith (rondel type) from TD-F-L (wheat) embedded in epoxy resin
(pol-ished section). Pre-sputtering: L1 = 2 kV de-focused (60 × 60 mm) [Cs]+primary beam, for 3 min (a) [28Si]−, [16O]−, [12C2]−, [12C14N]−
and [12C14N]−/ [12C2]−images obtained with a [Cs]+primary beam with L1 = 2 kV, D1-1 primary diaphragm (750 µm), for 11 min; (b)
secondary ion intensities along line scans (red line in a).
0 2000 4000 6000 8000 10000 12000 0 5 10 15 20 In ten sity
Distance along line (µm)
16O 26CN 28Si*100 12C*5 [12C]- [12C14N] -[28Si]- [16O] -- + 2 0 m m [12C14N]-/ [12C 2] -Figure 7. 0 5 10 15 20 25 30 35 0 5 10 15 20 In ten sity
Distance along line (µm)
26CN/12C A B C [28Si] -a b a b a b 20mm 12C*5 16O 26CN 28Si*100
Figure 7. NanoSIMS images and intensities of a second typical GSC phytolith (rondel type) from TD-F-L (wheat) embedded in epoxy
resin (polished section). Pre-sputtering: L1 = 2 kV de-focused (60 × 60 mm) [Cs]+primary beam, for 3 min (a) [28Si]−, [16O]−, [12C2]−,
[12C14N]−and [12C14N]−/ [12C2]−images obtained with a [Cs]+primary beam with L1 = 2 kV, D1-1 primary diaphragm (750 µm), for 11 min; (b) [28Si]−image obtained with a [Cs]+primary beam increased with L1 = 4 kV, D1-1 primary diaphragm, for 11 min; (c) secondary ion intensities along line scans (red line in Fig. 5a).
dissolved Si available for precipitation during the phytolith formation.
Inside the internal cavities, no original organic com-pounds could be detected by NanoSIMS. If initially present, they may have been squeezed out and replaced by the epoxy resin during the polishing step. On the contrary, the [26CN]−/ [12C]−images clearly evidenced the presence of organic compounds rich in N continuously distributed in
the silica structure and clearly differentiated from the epoxy resin. The absolute composition of [26CN]−and [12C]−was not calculated. This would have required including standard materials with known composition in the analyzed section. However, the consistency of N enrichment of the organic compound in the silica structure (measured by NanoSIMS) with N enrichment of the bulk phytC (measured by chemi-luminescence/EA) supports the claim that the organic
com-20mm [28Si] -10mm 20mm 20mm SEM Figure 8. A B C 1 2 3 Si r Si Si r Si r
Figure 8. SEM images of the polished section showing convex
silica surfaces (Si) in the epoxy resin (r). Associated NanoSIMS [28Si]− images showing central areas devoid of secondary ion signal. (a) [Cs]+ primary beam with L1 = 4 kV, D 1-1 pri-mary diaphragm (750 mm), 11 min; (b) [Cs]+primary beam with L1 = 2 kV, D 1–2 primary diaphragm (300 µm), 11 min; (c) [Cs]+ primary beam with L1 = 2 kV, D1-1 primary diaphragm (750 µm), 3 min analyses for 1, 2 and 3 successively.
pound measured by NanoSIMS is phytC. Finally, although our data cannot be used to conclude the presence or absence of any phytC in the internal cavities, they demonstrate that the phytC is, in whole or in part, continuously distributed in the silica structure.
4.2 Implications regarding phytC occlusion and phytC accessibility
Evidence of the continuous distribution of phytC in the silica structure, at the sub-micrometric scale, suggests that it had been occluded since the early stage of silicification. SEM, environmental scanning electron microscope (ESEM) and TEM-EDX analyses showed that silica first precipitates in the inner cell wall, probably triggered by the presence of callose or lignin (Laue et al., 2007; Law and Exeley, 2011; Zhang et al., 2013). Silica nanospheres are then organized in a variety of structural motifs such as sheet-like, globular and fibrillar bundles that, from the cell wall, infill the cell lumen in a centripetal way (e.g., Kaufman et al., 1981; Sangster and Parry, 1981; Perry et al., 1987; Laue et al., 2007; Zhang et al., 2013), until most of the cell becomes silicified (Motomura, 2004; Laue et al., 2007). As previously noted, an organic template may participate to the silica formation Harrison, 1996; Laue et al., 2007). This organic template, progressively trapped in the silica structure, may constitute the phytC evi-denced by NanoSIMS in the phytoliths. Its N / C value (0.27) is in the range of N / C values characteristic of amino acids. Amino acids may originate either from the cell itself or from
Figure 9. A B C 3 2 1 1 2 DD DD DD DD DD DD DD DD 1 2 3 4 D 5 4 1 3 2
Figure 9. NL microscopy and SEM images of dissolution
depres-sions (DD) affecting fossil phytoliths from soils. (a) Grass epider-mis monocellular phytoliths (cuneiform bulliform types and aci-cular type) from Mascareignite (MSG 70, La Réunion, France) (Crespin et al., 2008); NL microscopy phytolith surface (1, 2), SEM phytolith volume (3) and polished section (4, 5). (b) Grass epi-dermis monocellular phytoliths from a ferrugineous soil (Salitre, Brazil) (Alexandre et al., 1999); NL microscopy phytolith. (c) Phy-toliths from palms and trees from a ferallitic soil (Dimonika, RDA) (Alexandre et al., 1997); SEM globular granulate type volumes (1, 2) and polished section (3). (d) Opaque areas observed with NL microscopy on bulliform cell phytoliths from MSG 70 (1, 2) and Salitre (3, 4). Scale bars: 10 µm.
the extra-cellular space. Different families of transporters have been identified for their import into plant cells (Tegeder, 2012). At the same time, amino acids entering the cell si-multaneously to silica thanks to an invagination/vesicle for-mation mechanism previously evidenced (Neumann and De Figueiredo, 2002) may occur.
At the end of the cell silicification, residual cell organic compounds that were not already occluded may gather in any remaining space and delimitate the micrometric central cavities. This second pool of phytC should be rapidly ox-idized when phytoliths start to dissolve after their deposi-tion in litter, soil or sediment (Fig. 9). This suggests that this phytC pool participates to a limited extent in long-term at-mospheric CO2sequestration. These considerations rise the
need to further estimate the respective contributions to C con-tents measured from bulk phytolith concentrates of (i) phytC in the silica structure, (ii) phytC in the central cavities and (iii) extraneous C that may remain on porous phytolith sur-faces. This is a prerequisite for reliable assessments of the significance of phytC in atmospheric CO2sequestration. For
assem-blages characterized by 3-D X-ray microscopy as dominated by phytoliths with closed internal cavities or by phytoliths with open cavities should be compared.
4.3 Reassessment of NL microscopy observations
Several studies have speculated that opaque areas observed by NL microscopy in fossil phytoliths from soils and sedi-ments were burnt organic remains indicative of past fire oc-currence (Kealhofer and Penny, 1998; Elbaum et al., 2003; Parr, 2006; Piperno, 2006). However, when observed by NL microscopy, the empty dissolution depressions evidenced by SEM on monocellular phytoliths from soils (Fig. 9a) also ap-peared as opaque areas, especially when they were oriented downwards (Fig. 9c). This is probably due to trapped air in the dissolution depressions that caused an optical artifact at the place where the air met the mounting medium. This feature implies that opaque areas in fossil phytoliths should not be considered as unequivocal evidence of burnt organic compounds. Similarly, internal cavities may also appear as opaque spots due to the occurrence of trapped air, indepen-dent of the presence of organic compounds.
5 Conclusions
3-D X-ray microscopy reconstructions of GSC phytoliths from harvested grasses, and SEM observations of their cross sections, showed that the silica structure contains micromet-ric internal cavities. These cavities were sometimes observed isolated from the outside. Their opening may be an origi-nal feature or may result from the silica dissolution during the chemical extraction procedure, mimicking the beginning of dissolution process that may happen in natural environ-ments. The phytC that may originally occupy those cavities is thus susceptible to rapid oxidation. It was not detected by the NanoSIMS technique. On the contrary, another pool of phytC, continuously distributed in and protected by the silica structure was evidenced by NanoSIMS. Its N / C ratio (0.27) is in agreement with the presence of amino acids. These find-ings constitute a basis to further characterize the origin, oc-clusion process, nature and accessibility of phytC, necessary for assessing its significance in the global C cycle.
Acknowledgements. The authors gratefully acknowledge support from LABEX OT-Med (France) (2013–2014 grant to A. Alexan-dre), from the U.S. National Science Foundation (DEB-1144888 to GMS) and from the “Investissements d’Avenir” French Govern-ment program of the French National Research Agency that funded the French X-ray CT platform Nano-ID (ANR-10-EQPX-39-01). NanoSIMS analyses were conducted at the Plateforme NanoSIMS, OSUR, Université de Rennes 1, France. We express special thanks to Franz Badeck and Luigi Cattivelli (CRA – Genomic Research Centre, Fiorenzuola d’Arda, Italy) for providing the wheat sample. The authors would like to thank two anonymous reviewers and Jack Middelburg, Biogeosciences associate editor, for their
valu-able comments and suggestions for improving the manuscript. Edited by: J. Middelburg
References
Alexandre, A., Colin F., and Meunier J.-D., Phytoliths as indica-tors of the biogeochemical turnover of silicon in equatorial for-est, Compte-rendus de l’Académie des Sciences, Paris, 319, 453– 458, 1994.
Alexandre, A., Meunier, J. D., Colin, F., and Koud, J. M., Plant Im-pact on the Biogeochemical Cycle of Silicon and Related Weath-ering Processes, Geochim. Cosmochim. Ac., 61, 677–682, 1997. Alexandre, A., Meunier, J. D., Mariotti, A., and Soubies, F.: Late Holocene phytolith and carbon isotope record from a latosol at Salitre, south-central Brazil, Quaternary Res., 51, 187–194, 1999.
Alexandre, A., Bouvet, M., and Abbadie, L.: The role of savannas in the terrestrial Si cycle: a case-study from Lamto, Ivory Coast, Global Planet. Change, 78, 162–169, 2011.
Alexandre, A., Crespin, J., Sylvestre, F., Sonzogni, C., and Hilbert, D. W.: The oxygen isotopic composition of phytolith assem-blages from tropical rainforest soil tops (Queensland, Australia): validation of a new paleoenvironmental tool, Clim. Past, 8, 307– 324, doi:10.5194/cp-8-307-2012, 2012.
Bartoli, F. and L. P. Wilding. Dissolution of Biogenic Opal as a Function of Its Physical and Chemical Properties, Soil Sci. Soc. Am. J., 44, 873–878, 1980.
Blecker, S. W., McCulley, R. L., Chadwick, O. A., and Kelly, E. F.: Biologic cycling of silica across a grass-land bioclimosequence, Global Biogeochem. Cy., 20, GB3023, doi:10.1029/2006gb002690, 2006.
Carnelli, A. L., Theurillat, J. P., and Madella, A.: Phytolith types and type-frequencies in subalpine-alpine plant species of the Eu-ropean Alps, Rev. Palaeobot. Palyno., 129, 39–65, 2004. Carter, J. A.: Atmospheric carbon isotope signatures in
phytolith-occluded carbon, Quatern. Int., 193, 20–29, 2009.
Corbineau, R., Reyerson, P. E., Alexandre, A., and Santos, G. M.: Towards producing pure phytolith concentrates from plants that are suitable for carbon isotopic analysis, Rev. Palaeobot. Palyno., 197, 179–185, 2013.
Cornelis, J.-T., Delvaux, B., Georg, R. B., Lucas, Y., Ranger, J., and Opfergelt, S.: Tracing the origin of dissolved silicon transferred from various soil-plant systems towards rivers: a review, Biogeo-sciences, 8, 89–112, doi:10.5194/bg-8-89-2011, 2011.
Currie, H. A. and Perry, C. C.: Silica in plants: biological, biochem-ical and chembiochem-ical studies, Ann. Bot., 100, 1383–1389, 2007. Elbaum, R., Weiner, S., Albert, R. M., and Elbaum, M.:
Detec-tion of burning of plant materials in the archaeological record by changes in the refractive indices of siliceous phytoliths, J. Ar-chaeol. Sci., 30, 217–226, 2003.
Elbaum, R., Melamed-Bessudo, C., Tuross, N., Levy, A. A., and Weiner, S.: New methods to isolate organic materials from sili-cified phytoliths reveal fragmented glycoproteins but no DNA, Quatern. Int., 193, 11–19, 2009.
Gao, Y., Cheng, Z., Ling, W., and Huang, J.: Arbuscular mycor-rhizal fungal hyphae contribute to the uptake of polycyclic
aro-matic hydrocarbons by plant roots, Bioresource Technol., 101, 6895–6901, 2010.
Harrison, C. C.: Evidence for intramineral macromolecules contain-ing protein from plant silicas, Phytochemistry, 41, 37–42, 1996. Hatton, P.-J., Remusat, L., Zeller, B., and Derrien, D.: A
multi-scale approach to determine accurate elemental and isotopic ra-tios by nano-scale secondary ion mass spectrometry imaging, Rapid Commun. Mass Sp., 26, 1363–1371, 2012.
Herrmann, A. M., Clode, P. L., Fletcher, I. R., Nunan, N., Stockdale, E. A., O’Donnell, A. G., and Murphy, D. V.: A novel method for the study of the biophysical interface in soils using nano-scale secondary ion mass spectrometry, Rapid Commun. Mass Sp., 21, 29–34, 2007.
Hodson, M. J. and Sangster, A. G.: The interaction between silicon and aluminium in Sorghum bicolor (L.) Moench: growth analysis and X-ray microanalysis, Ann. Bot., 72, 389–400, 1993. Huang, Z., Li, Y., Jiang, P., Chang, S. X., Song, Z., Liu, J., and Zhou,
G.: Long-term intensive management increased carbon occluded in phytolith (PhytOC) in bamboo forest soils, Scientific Report, 4, 3602, doi:10.1038/srep03602, 2014.
Iler, R.: The Chemistry of Silica. Solubility, Polymerization, Col-loid and Surface Properties, and Biochemistry, Chichester: John Wiley and Sons, 1979.
Instruments-for-research: SIMS: http://www.cameca.com/ instruments-for-research/sims.aspx, 2014.
Jones, R. L. and Beavers, A. H. Some mineralogical and chemical properties of plant opal. Soil Sci., 96, 375–379. 1963.
Kaufman, P. B., Dayanandan, P., Takeoka, Y., Bigelow, W. C., Jones, J. D., and Iler, R.: Silica in shoots of higher plants, in: Silicon and Siliceous structures in biological systems, edited by: Simpson, J. L. and Volcani, B. E., Springer Verlag, NY, 409–449, 1981.
Kealhofer, L. and Penny, D.: A combined pollen and phytolith record for fourteen thousand years of vegetation change in north-eastern Thailand, Rev. Palaeobot. Palyno., 103, 83–93, 1998. Kelly, E. F., Amundson, R. G., Marino, B. D., and Deniro, M. J.:
Stable isotope ratios of carbon in phytoliths as a quantitative method of monitoring vegetation and climate change, Quater-nary. Res., 35, 222–233, 1991.
Laue, M., Hause, G., Dietrich, D., and Wielage, B.: Ultrastructure and microanalysis of silica bodies in Dactylis glomerata L., Mi-crochim. Acta, 156, 103–107, 2007.
Law, C. and Exley, C.: New insight into silica deposition in horsetail (Equisetum arvense), BMC Plant Biol., 11, 112, doi:10.1038/srep03602, 2011.
Li, B., Song, Z., Li, Z., Wang, H., Gui, R., and Song, R.: Phylo-genetic variation of phytolith carbon sequestration in bamboos, Scientific Report, 4, 4710, doi:10.1038/srep04710, 2014. Lins, U., Barros, C. F., da Cunha, M., and Miguens, F. C.:
Struc-ture, morphology, and composition of silicon biocomposites in the palm tree Syagrus coronata (Mart.) Becc., Protoplasma, 220, 89–96, 2002.
Madella, M., Alexandre, A., Ball, T., and Grp, I. W.: International code for phytolith nomenclature 1.0, Ann. Bot., 96, 253–260, 2005.
McInerney, F. A., Strömberg, C. A. E., and White, J. W. C.: The Neogene transition from C3 to C4 grasslands in North America: stable carbon isotope ratios of fossil phytoliths, Paleobiology, 37, 23–49, 2011.
McMichael, C. H., Bush, M. B., Silman, M. R., Piperno, D. R., Raczka, M., Lobato, L. C., Zimmerman, M., Hagen, S., and Palace, M.: Historical fire and bamboo dynamics in western Amazonia, J. Biogeogr., 40, 299–309, doi:10.1111/jbi.12002, 2012.
Miller, L. A., Smith, S. Y., Sheldon, N. D., and Strömberg, C. A. E.: Eocene vegetation and ecosystem fluctuations inferred from a high-resolution phytolith record, Geol. Soc. Am. Bull., B30548.1, doi:10.1130/B30548.1, 2012.
Moore, K. L., Schröder, M., Wu, Z., Martin, B. G. H., Hawes, C. R., Mcgrath, S. P., Hawkesford, M. J., Ma, J. F., Zhao, F.-J., and Grovenor, C. R. M.: High-Resolution Secondary Ion Mass Spectrometry Reveals the Contrasting Subcellular Distribution of Arsenic and Silicon in Rice Roots, Plant Physiol., 156, 913– 24, 2011.
Motomura, H.: Silica deposition in relation to ageing of leaf tissues in Sasa veitchii (Carriere) Rehder (Poaceae: Bambusoideae), Ann. Bot., 93, 235–248, 2004.
Mueller, C. W., Kölbl, A., Hoeschen, C., Hillion, F., Heister, K., Herrmann, A. M., and Kögel- Knabner, I.: Submicron scale imaging of soil organic matter dynamics using NanoSIMS – from single particles to intact aggregates, Org. Geochem., 42, 1476– 1488, 2012.
Mueller, C. W., Weber, P. K., Kilburn, M. R., Hoeschen, C., Kle-ber, M., and Pett-Ridge, J.: Advances in the Analysis of Bio-geochemical Interfaces: NanoSIMS to Investigate Soil Microen-vironments, Adv. Agron., 121, 1–46, doi:10.1016/B978-0-12-407685-3.00001-3, 2013.
Müller, W. E. G., Wang, X., Sinha, B., Wiens, M., Schröder, H.-C., and Jochum, K. P.: NanoSIMS: insights into the organization of the proteinaceous scaffold within Hexactinellid sponge spicules, Chembiochem, 11, 1077–1082, 2010.
Neumann, D. and De Figueiredo, C.: A novel mechanism of silicon uptake, Protoplasma, 220, 59–67, 2002.
Oleschko, K., Parrot, J.-F., Ronquillo, G., Shoba, S., Stoops, G., and Marcelino, V.: Weathering: toward a fractal quantifying, Math. Geol., 36, 607–627, 2004.
Parr, J. F.: Effect of fire on phytolith coloration, Geoarchaeology, 21, 171–185, 2006.
Parr, J. F. and Sullivan, L. A.: Soil carbon sequestration in phy-toliths, Soil Biol. Biochem., 37, 117–124, 2005.
Parr, J. F. and Sullivan, L. A.: Comparison of two methods for the isolation of phytolith occluded carbon from plant material, Plant Soil, 374, 45–53, 2014.
Parr, J., Sullivan, L., Chen, B., Ye, G., and Zheng, W.: Carbon bio-sequestration within the phytoliths of economic bamboo species, Glob. Change Biol., 16, 2661–2667, 2010.
Paungfoo-Lonhienne, C., Lonhienne, T. G. A., Rentsch, D., Robin-son, N., Christie, M., Webb, R. I., Gamage, H. K., Carroll, B. J., Schenk, P. M., and Schmidt, S.: Plants can use protein as a ni-trogen source without assistance from other organisms, P. Natl. Acad. Sci. USA, 105, 4524–4529, 2008.
Perry, C. C., Williams R. J. P., and S.C. Fry. Cell Wall Biosynthesis during Silicification of Grass Hairs, J. Plant Physiol., 126, 437– 48, 1987.
Piperno, D. R. and Becker, P.: Vegetational history of a site in the central Amazon Basin derived from phytolith and charcoal records from natural soils, Quaternary Res., 45, 202–209, 1996.
Piperno, D. R. and Stothert, K. E.: Phytolith evidence for early Holocene Cucurbita domestication in southwest Ecuador, Sci-ence, 299, 1054–1057, 2003.
Piperno, D. R. Phytoliths. A Comprehensive Guide for Archaeolo-gists and PaleoecoloArchaeolo-gists. Lanham, New York, Toronto, Oxford: AltaMira Press (Rowman & Littlefield), 2006.
Pironon, J., Meunier, J. D., Alexandre, A., Mathieu, R., Mansuy, L., Grosjean, A., and Jarde, E.: Individual characterization of phy-toliths: experimental approach and consequences on paleoenvi-ronment understanding, A. A. Balkema, Lisse, 2001.
Prychid, C. J., Rudall, P. J., and Gregory, M.: Systematics and biol-ogy of silica bodies in monocotyledons, Bot. Rev., 69, 377–440, 2003.
Sangster, A. G. and Parry, D. W.: Some factors in relation to bulli-form cell silicification in the grass leaf, Ann. Bot., 33, 315–323, 1969.
Sangster A. G. and Parry D. W.: Ultrastructure of silica deposits in higher plants. In Silicon and siliceous structures in biological systems, ed. Simpson and Volcani, 383–407, New York, Heidel-berg and Berlin, Springer-Verlag, 1981.
Santos, G. M., Alexandre, A., Coe, H. H. G., Reyerson, P. E., Southon, J. R., and De Carvalho, C. N.: The phytolith C-14 puz-zle: a tale of background determinations and accuracy tests, Ra-diocarbon, 52, 113–128, 2010.
Santos, G. M., Alexandre, A., Southon, J. R., Treseder, K. K., Cor-bineau, R., and Reyerson, P. E.: Possible source of ancient car-bon in phytolith concentrates from harvested grasses, Biogeo-sciences, 9, 1873–1884, doi:10.5194/bg-9-1873-2012, 2012. Smith, F. A. and Anderson, K. B.: Characterization of organic
com-pounds in phytoliths: improving the resolving power of phytolith delta C-13 as a tool for paleoecological reconstruction of C3 and C4 grasses, in: Phytoliths – Applications in Earth Science and Human History, edited by: Meunier, J. D., and Colin, CRC Press, 317–327, 2001.
Smith, F. A. and White, J. W. C.: Modern calibration of phytolith carbon isotope signatures for C3/C4 paleograssland reconstruc-tion, Palaeogeogr. Palaeocl., 207, 277–304, 2004.
Song, Z., Wang, H., Strong, P. J., Li, Z., and Jiang, P.: Plant impact on the coupled terrestrial biogeochemical cy-cles of silicon and carbon: implications for biogeochem-ical carbon sequestration, Earth-Sci. Rev., 115, 319–331, doi:10.1016/j.earscirev.2012.09.006, 2012.
Song, Z., Wang, H., Strong, P. J., and Guo, F.: Phytolith carbon sequestration in China’s croplands, Eur. J. Agron., 53, 10–15, 2014.
Sowers, A. E. and Thurston, E. L.: Ultrastructural evidence for up-take of silicon-containing silicic acid analogs by Urtica pilulifera and incorporation into cell wall silica, Protoplasma, 101, 11–22, 1979.
Strömberg, C. A. E., Dunn, R. E., Madden, R. H., Kohn, M. J., and Carlini, A. A.: Decoupling the spread of grasslands from the evolution of grazer-type herbivores in South America, Nat. Com-mun., 4, 1478, doi:10.1038/ncomms2508, 2013.
Struyf, E. and D. J. Conley. Silica: An Essential Nutrient in Wetland Biogeochemistry, Front. Ecol. Environ., 7, 88–94. 2009. Tegeder, M.: Transporters for amino acids in plant cells: some
func-tions and many unknowns, Curr. Opin. Plant Biol., 15, 315–321, 2012.
Warren, C. R.: Post-uptake metabolism affects quantification of amino acid uptake, New Phytol., 193, 522–531, 2012.
Watling, K. M., Parr, J. F., Rintoul, L., Brown, C. L., and Sullivan, L. A.: Raman, infrared and XPS study of bamboo phytoliths after chemical digestion, Spectrochim. Acta A, 80, 106–111, 2011. Webb, E. A. and Longstaffe, F. J.: Limitations on the climatic and
ecological signals provided by the delta C-13 values of phytoliths from a C4 North American prairie grass, Geochim. Cosmochim. Ac., 74, 3041–3050, 2010.
Whiteside, M. D., Treseder, K. K., and Atsatt, P. R.: The brighter side of soils: quantum dots track organic nitrogen through fungi and plants, Ecology, 90, 100–108, 2009.
Whiteside, M. D., Garcia, M. O., and Treseder, K. K.: Amino acid uptake in arbuscular mycorrhizal plants, PLoS ONE, 7, e47643, doi:10.1371/journal.pone.0047643, 2012.
Winterholler, B., Hoppe, P., Foley, S., and Andreae, M. O.: Sul-fur isotope ratio measurements of individual sulfate particles by NanoSIMS, Int. J. Mass Spectrom., 272, 63–77, 2008.
Zhang, C., Wang, L., Zhang, W., and Zhang, F.: Do lignification and silicification of the cell wall precede silicon deposition in the silica cell of the rice (Oryza sativa L.) leaf epidermis?, Plant Soil, 372, 137–149, 2013.
Zuo, X., Lu, H., and Gu, Z.: Distribution of soil phytolith-occluded carbon in the Chinese Loess Plateau and its implications for silica-carbon cycles, Plant Soil, 374, 223–232, 2014.